

Sample Category Title
USDJPY Struggling To Find Buying Interest
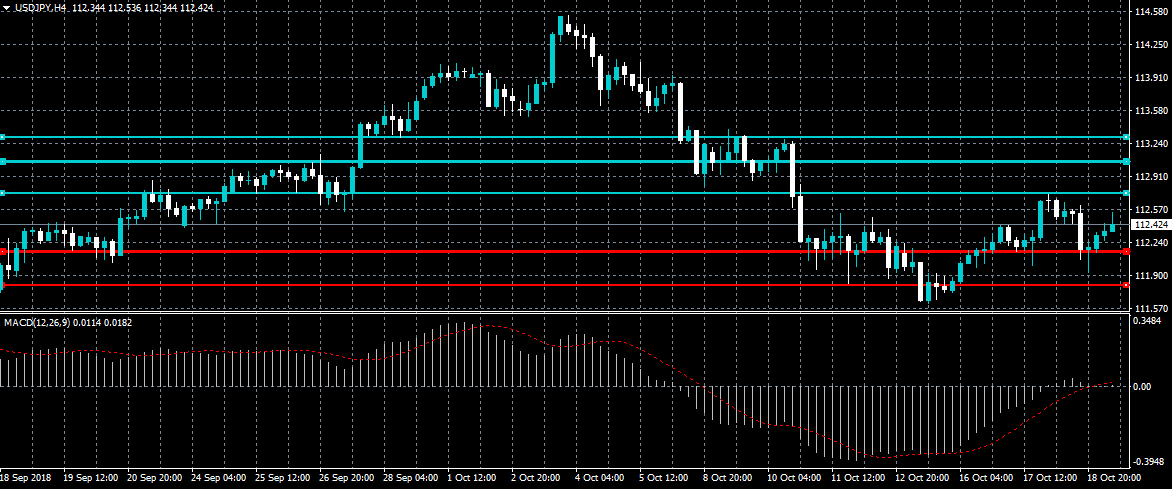
The US dollar is starting to trade lower against the Japanese yen currency, after meeting strong technical resistance from the 112.70 level. The recent bullish momentum in the USDJPY pair is starting to fade, with the MACD indicator on the four-hour time frame also struggling to trend higher. Buyers now need to break the 112.70 resistance level, while sellers will attempt a higher time frame price close below the 112.20 support level.
The USDJPY pair is only intraday bullish while trading above the 112.45 level, key resistance is now found at the 112.70 and 113.00 levels.
If the USDJPY pair trades below the 112.20 level, key intraday support is found at the 111.90 and 111.60 levels.
DAX Slide Continues On Italy Budget Crisis
The DAX index continues to lose ground on Friday, after sharp losses in the past two sessions. Currently, the index is at 11,552, down 0.32% on the day. The index has given up the strong gains which it recorded early in the week. The sole event on the schedule is the eurozone current account surplus, which widened from EUR 21.3 billion to 23.9 billion. This easily beat the estimate of EUR 21.4 billion.
This week’s EU summit came and went without a statement on the Brexit negotiations, one of the most important issues facing the EU. European leaders openly expressed their pessimism over reaching a deal, unless Theresa May brings fresh proposals to the table. In a conciliatory move, Michel Barnier, chief Brexit negotiator for the EU, offered to extend the transition phase by 12 months, which would leave it in place until December 2021. This would give the sides more time to work on the shape of a new customs union as well as outstanding issues. Prime Minister May said she would consider extending the transition stage “for a few months”, but even this suggestion has raised the ire of Brexiteers in the cabinet, who want a clean cut from Brussels. With the Brexit negotiations at an impasse, the mood over Brexit is so sour that officials are saying that they may not hold a November EU summit, unless substantial progress is made in the next several weeks.
Italy’s draft budget has become the latest crisis for the European Union. The budget boosts public spending and cuts taxes, would raise the country’s deficit, which breaches EU rules. The government has sent the budget for approval to the European Union. On Thursday, the European Commission told Italy that the budget was not acceptable, and demanded a reply by Monday. This could put Rome and Brussels on a collision course, and the sour mood has sent Italian bond prices higher. The yield on 10-year Italian bonds stands at 3.73%, some 3.33% over the equivalent German bonds, as the gap between the two continues to widen. Bond prices in Spain, Portugal and Greece have also increased, making investors nervous. Italy’s debt stands at an astounding 132% of GDP, and there is a real risk that the country’s financial woes could destabilize the entire eurozone.
What Does The Low Volatility Mean For Cryptos ?
Lower volatility presents an opoortunity and the indicators are showing some clear signs in which direction the Bitcoin and Ethereum price could break
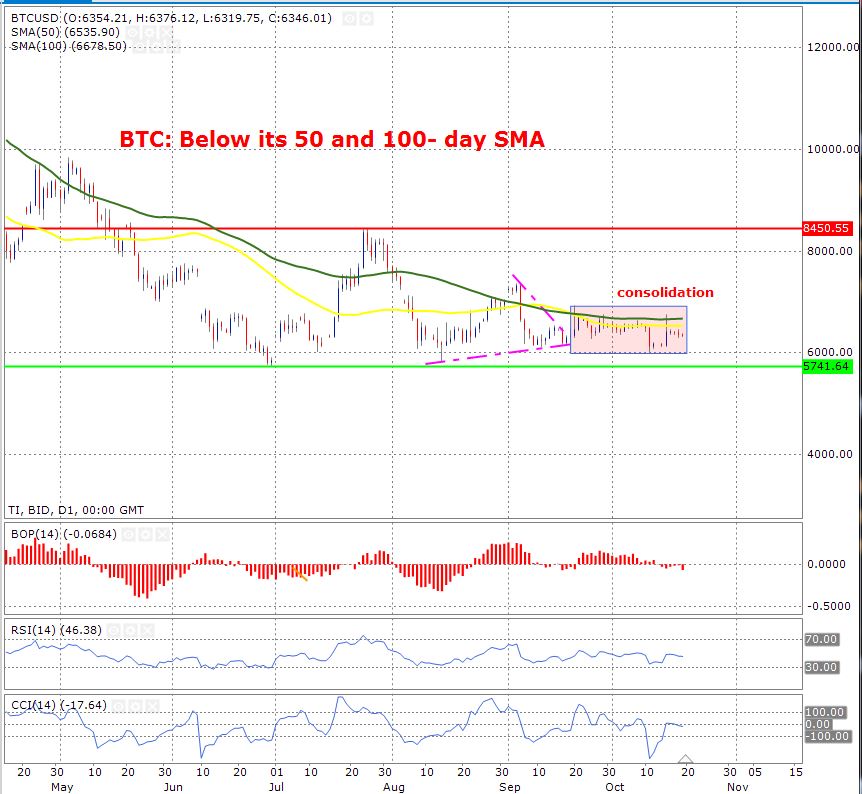
Bitcoin is stuck in a consolidation zone on a daily time frame. There isn’t much movement at all and the volatility is extremely low. The consolidation zone is shown by the rectangle on the chart. Given that the volatility has dropped so much (and this has been the case for some considerable period of time), it is likely that we will see the capitulation soon. In which direction that is going to take place is difficult to say.
But by looking at the Balance of Power, one thing becomes clear that the bears are in control of the price because we have the red bars below the zero line confirming this argument. Further strength for this argument comes from the fact that the price is trading below the 100 and 50-day moving averages.
It is important to emphasize that the price is trading very close to these averages. This is important because the bulls would not have too much trouble in moving the price above the 50 and 100-day moving averages. The moving averages prove to be a good point of resistance only when the price is trading well away from them.
The support zone is shown by the green horizontal line
The resistance zone is shown by the red horizontal line
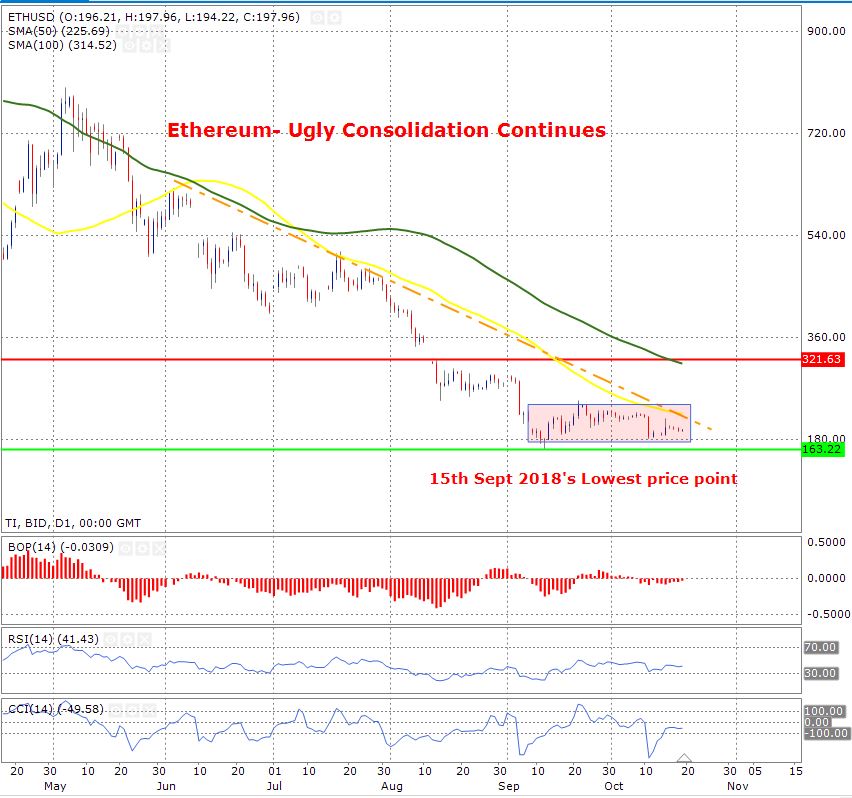
Ethererum is mirroring the price action of Bitcoin. It’s price action shows that the traders are not sure what direction of the trade they should choose. The daily time frame chart shows that the price is struggling to break out of the consolidation zone. The trend is firmly skewed to the downside because the price is trading below the downward trend line. This line is shown in orange colour. The support from the 15th September is still very much intact. The intriguing element is that the price is trading near the support zone and this makes me believe that there are higher chances that the price may break towards the downside.
The RSI is trading near the oversold zone of 30 and this gives a strong bull signal. If the RSI trades near the 30-zone, it shows that the price is oversold. This sends the signal that it is likely that the price is going to move higher. Similarly, if the RSI trades near the 70-zone, it shows that price is overbought and it is likely that we may see a retracement.
However, it is important to keep in mind that the 50-day moving average (shown in yellow) is trading below the 100-day (shown in green). This shows that the price is controlled by the bears and the Balance of power also confirms the same argument.
The support zone is shown by the green horizontal line
The resistance zone is shown by the red horizontal line
WTI Oil Outlook: Bears Are Taking A Breather Above Daily Cloud Base
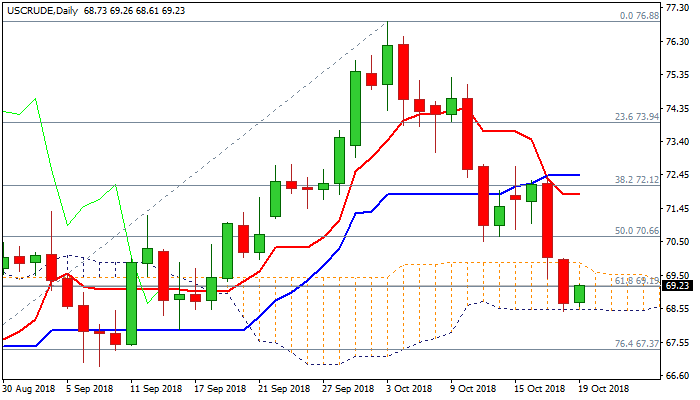
WTI oil consolidates above daily cloud base ($68.51) on Friday, following strong fall on Wed/Thu when oil price registered losses of nearly 5%.
Strong bearish acceleration was sparked by unexpected build in crude inventories, which further soured sentiment.
Extension of near-term downtrend from $76.88 (10Oct high) retraced over 61.8% of $64.43/$76.88 ascend and tested the base of daily cloud, which provides temporary footstep.
The latest data showed that economic growth in China, world’s largest oil importer, slowed in Q3 which could have further negative impact on oil prices.
Current political tensions over murdered Saudi journalist and concerns about supply shortage when US sanctions on Iran take effect on 04 November, showed were so far unable to dent bears.
Bearish daily techs (10/20 / 10/30 SMA’s bear crosses / strengthening bearish momentum) add to negative outlook, with two big red weekly candles (WTI contract is on track for the second strong bearish weekly close) continue to weigh.
Meanwhile, profit-taking and oversold conditions may trigger consolidative / corrective action, before bears resume towards $67.38 (200SMA / Fibo 76.4% of $64.43/$76.88).
Daily cloud top ($69.89) marks solid barrier, reinforced by 55SMA, which is expected to ideally cap and guard former low at $70.49, violation of which would sideline immediate bears for stronger correction.
Res: 69.89, 70.00, 70.49, 71.57
Sup: 68.51, 67.93, 67.37, 66.85
The Analytical Overview Of The Main Currency Pairs
The EUR/USD currency pair
Technical indicators of the currency pair:
Prev Open: 1.15789
Open: 1.14521
% chg. over the last day: -0.41
Day's range: 1.14329 – 1.14602
52 wk range: 1.0571 – 1.2557
Yesterday, the bearish sentiment was observed on the EUR/USD currency pair. The US currency was supported by positive economic data. In October, Philadelphia Fed manufacturing index counted to 22.2 and was better than the expected value of 19.7. Fed officials plan to adhere to the current monetary policy tightening. At the moment, the key support and resistance levels are: 1.14300 and 1.14600, respectively. Trading instrument has the potential for further decline. We recommend opening positions from the key levels.
Important economic reports on 19.10.2018:
Existing home sales in the US at 17:00 (GMT+3:00).
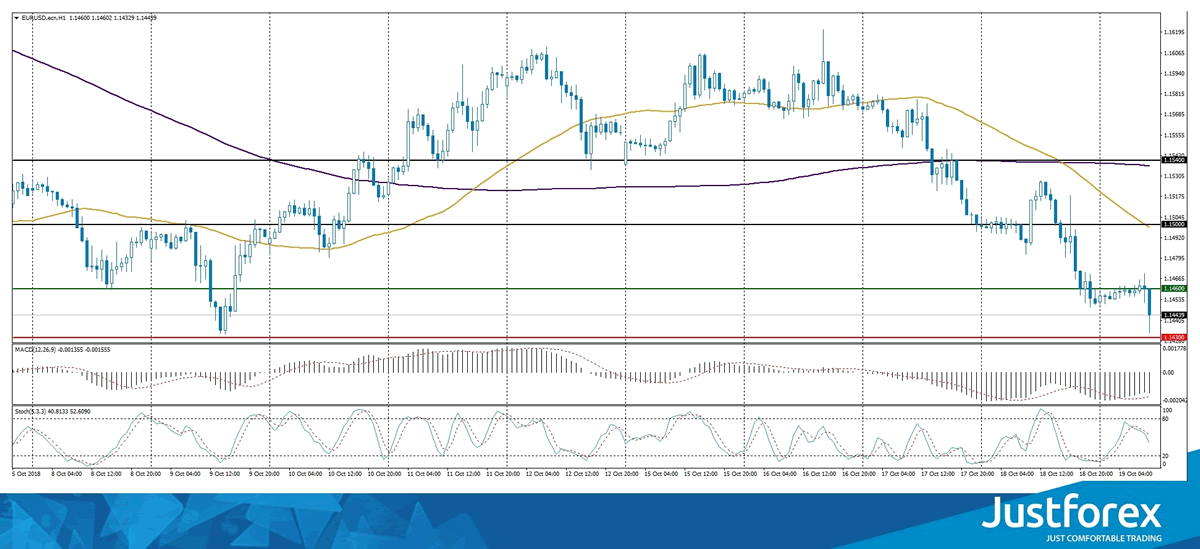
The price has fixed below 50 MA and 200 MA, which indicates the power of sellers.
The MACD histogram is in the negative zone, but above the signal line, which gives a weak signal to sell EUR/USD.
Stochastic Oscillator is in the neutral zone, the %K line is below the %D line, which indicates the bearish sentiment.
Trading recommendations
Support levels: 1.14300, 1.14000
Resistance levels: 1.14600, 1.15000, 1.15400
If the price fixes below the support level of 1.14300, a further fall in the EUR/USD quotes is expected. The movement is tending to 1.14000-1.13750.
An alternative may be the correction of the EUR/USD currency pair to the level of 1.14800-1.15000.
The GBP/USD currency pair
Technical indicators of the currency pair:
Prev Open: 1.31509
Open: 1.30171
% chg. over the last day: -0.74
Day's range: 1.30122 – 1.30383
52 wk range: 1.2361 – 1.4345
There are aggressive sales on the GBP/USD currency pair. The British pound weakened significantly against the US dollar due to weak retail sales statistics. The key support and resistance levels are: 1.30000 and 1.30400, respectively. Positions should be opened from these marks. Trading instrument has the potential for further decline.
We recommend paying attention to the speech by the Bank of England governor.
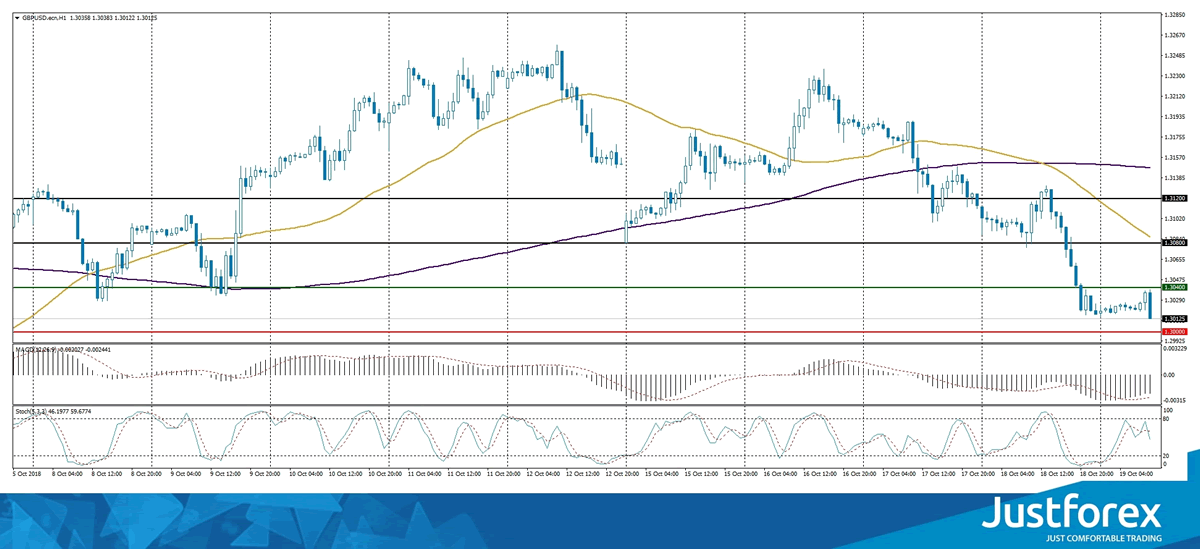
The price has fixed below 50 MA and 200 MA, which indicates the power of sellers.
The MACD histogram is in the negative zone, but above the signal line, which gives a weak signal to sell GBP/USD.
Stochastic Oscillator is in the neutral zone, the %K line is crossing the %D line. There are no accurate signals.
Trading recommendations
Support levels: 1.30000, 1.29700
Resistance levels: 1.30400, 1.30800, 1.31200
If the price fixes below the round level of 1.30000, a further decrease in the GBP/USD quotes is expected. The movement is tending to 1.29700-1.29500.
An alternative may be the GBP/USD currency pair growth to the level of 1.30750-1.31000.
The USD/CAD currency pair
Technical indicators of the currency pair:
Prev Open: 1.29915
Open: 1.30833
% chg. over the last day: +0.47
Day's range: 1.30536 – 1.30666
52 wk range: 1.2059 – 1.3795
The USD/CAD currency pair moved away from monthly highs. At the moment, the technical pattern is ambiguous. Local support and resistance levels are: 1.30400 and 1.30650, respectively. Positions should be opened from these marks. In the near future, correction of the USD/CAD quotes is not excluded after a prolonged growth.
The news feed on 19.10.2018:
Reports on inflation and retail sales in Canada at 15:30 (GMT+3:00).
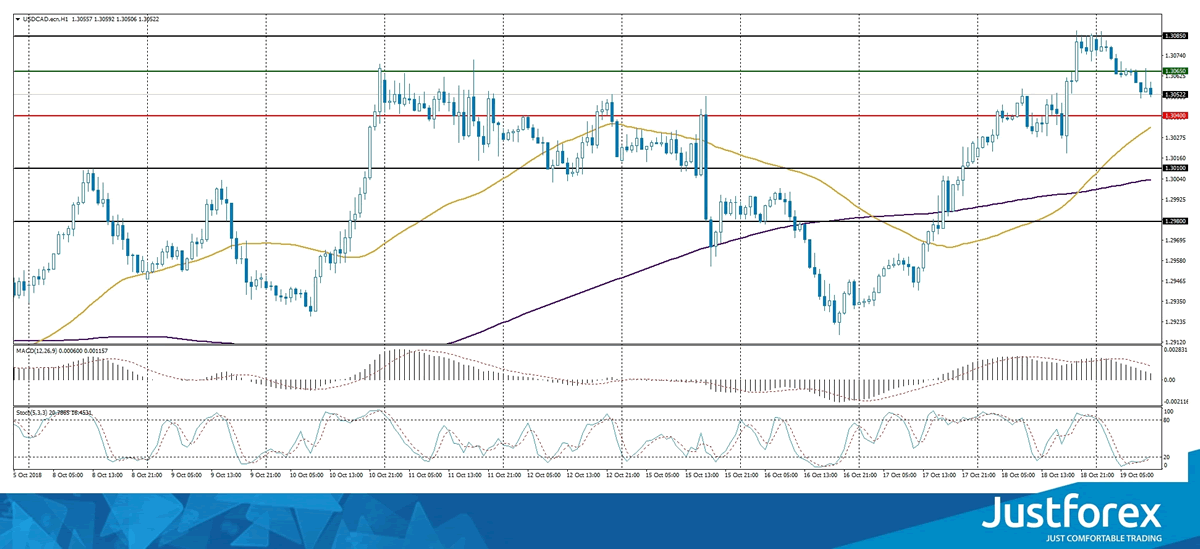
Indicators point to the power of buyers: the price is above 50 MA and 200 MA.
The MACD histogram is in the positive zone, but below the signal line, which gives a weak signal to buy USD/CAD.
Stochastic Oscillator is moving out of the oversold zone, the %K line is above the %D line, which indicates the bullish sentiment.
Trading recommendations
Support levels: 1.30400, 1.30100, 1.29800
Resistance levels: 1.30650, 1.30850, 1.31000
If the price fixes below the local support of 1.30400, it is necessary to look for entry points to the market to open short positions. The target movement level is 1.30100-1.29800.
Alternative option. If the price fixes above the resistance of 1.30650, the USD/CAD quotes growth is expected. The movement is tending to the round level of 1.31000.
The USD/JPY currency pair
Technical indicators of the currency pair:
Prev Open: 112.131
Open: 111.767
% chg. over the last day: -0.33
Day's range: 112.089 – 112.129
52 wk range: 104.56 – 114.74
There is a variety of trends on the USD/JPY currency pair. Investors expect additional drivers. At the moment, local support and resistance levels are: 112.300 and 112.550, respectively. Positions should be opened from these marks. We recommend paying attention to the US government bonds yield.
Publication of important economic reports from Japan is not planned.
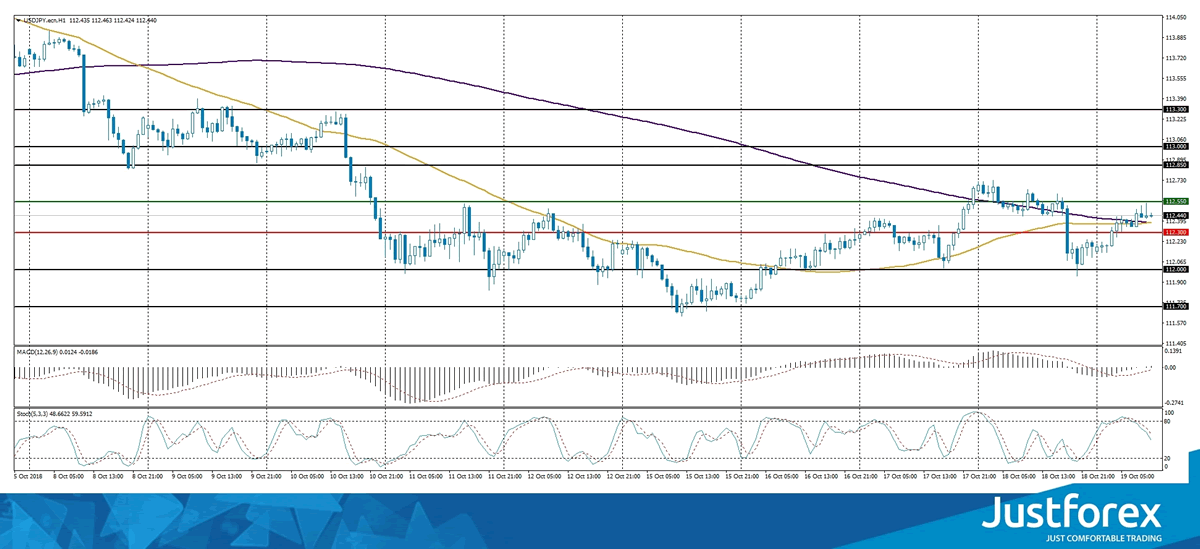
Indicators do not send accurate signals: 50 MA is crossing 200 MA.
The MACD histogram is near the 0 mark.
Stochastic Oscillator is in the neutral zone, the %K line is below the %D line, which indicates the bearish sentiment.
Trading recommendations
Support levels: 112.300, 112.000, 111.700
Resistance levels: 112.550, 112.850
If the price fixes above the resistance level of 112.550, the USD/JPY quotes growth is expected. The movement is tending to 113.000-113.250.
Alternative option. If the price fixes below 112.300, we recommend looking for entry points to the market to open short positions. The target movement level is 112.000-111.700.
Sell-Off Continues
Sell-off continues
The stock market sell-off remains centred in developed economies. The Euro Stoxx 600 was down 0.42%, driven by Brexit deadlock and growing confrontation between the EU executive and the Italian populist coalition over the latter's 2019 spending plan. The biggest loser in Europe remains the DAX, with a drop of nearly 1% amid a weakening CDU-CSU coalition following Bavarian elections. Geopolitical tensions pushed US shares lower. Tech stocks were hit hardest with the NASDAQ down -2%, DJIA -1.20% and S&P 500 -1.45%. The US decline was also induced by Treasury Secretary Steven Mnuchin's announcement that he won't participate at an investment conference in Saudi Arabia, due to the disappearance of journalist Khashoggi. Asian shares remained solid aside from Japanese Nikkei 225, down 0.56%. Chinese shares remained solid following Chinese regulators statements that they will be supporting the economy. The Shanghai CSI 300 index closed at +2.97% after dropping to a 3-year low in early trading. Hong Kong's Hang Seng remained up +0.42%. Australian shares fell slightly at -0.05%.
China's economic growth lowest since 2009
The Chinese economy expanded in Q3 by 6.50% yearly and 1.60% quarterly (prior: 6.70%, 1.80%), signalling a slowdown in growth, driven by weakness in manufacturing. The impact of US sanctions (total: 10% tariffs on USD 200 billion Chinese imports, implemented on 24 September) are weighing on the economy and expected to reach 25% by year-end if no agreement between both counterparts is found. High expectations relate to the G20 meeting in Argentina (30 November-1 December), where the US and Chinese presidents will discuss the matter. Although the economic outlook remains tough for the Chinese economy given trade war and credit risk, Chinese regulators maintain a reassuring tone, as central bank governor Yi Gang confirmed financial support of private companies (i.e. credit granting), thus sustaining the economy via stimulus. For now, Chinese authorities remain on track with their GDP growth target of 6.50% for 2018. Accordingly, CNY is under pressure but still remains below USD/CNY fixing at 6.9387, which means that the Renminbi remains in place, despite further depreciation risk amid a weaker economic outlook.
CHI50 Stock Index Set For The Biggest Daily Jump Of The Year, Neutral In Short Term
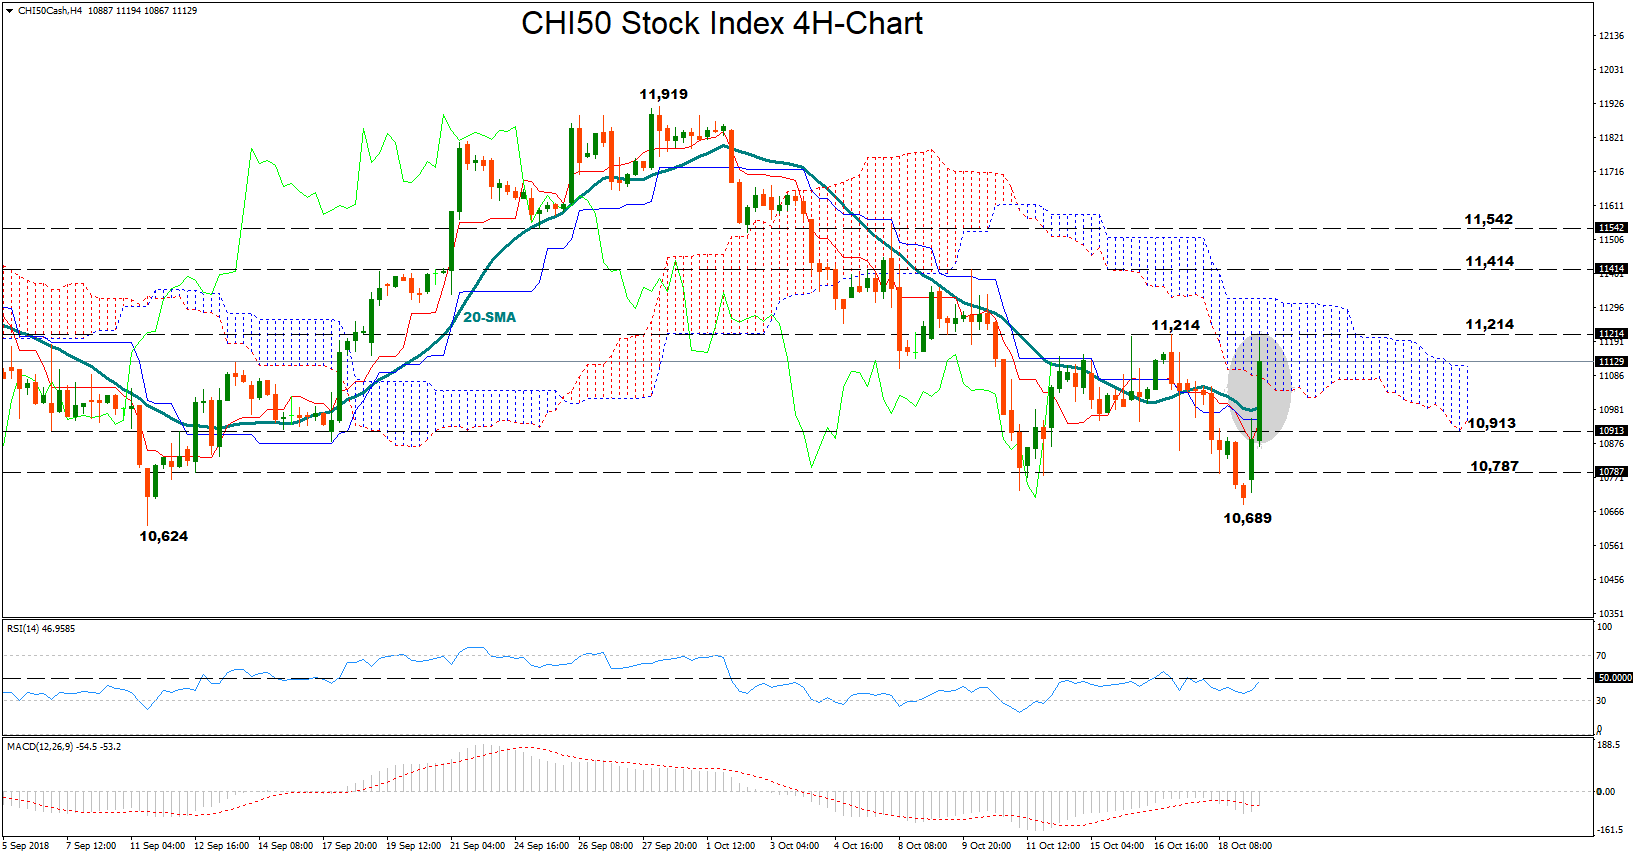
CHI50 stock index is currently building its biggest green candle of the year in the four-hour chart and in the daily timeframe as well, reversing losses which led the price to a one-month low of 10,689 on Thursday. The technical picture though supports that the price might lack direction in the short term as the RSI approaches its 50 neutral threshold and the MACD flirts with its red signal line.
However, if bullish pressures dominate, the index could run up to test the latest peak at 11,214. Surpassing that level, a stronger wall could be met around 11,414 which bulls were unable to overcome on October 10 and September 19-20. Note that the mark is also comfortably above the Ichimoku cloud, which could increase speculation that further gains might follow up should the price break that point. In this case, eyes will turn towards the support-turned-resistance handle of 11,542.
On the flip side, a pullback is likely to stall around 10,913 which was a significant support in September. Lower than that, another obstacle is likely to be detected near 10,787, while if this fails to halt downside corrections too, attention would immediately shift to the 10,689 bottom. Traders would be also curious to see whether the bears are able to pierce the more-than-a-year low of 10,624.
GBPJPY Recovers Some Ground In Short Term
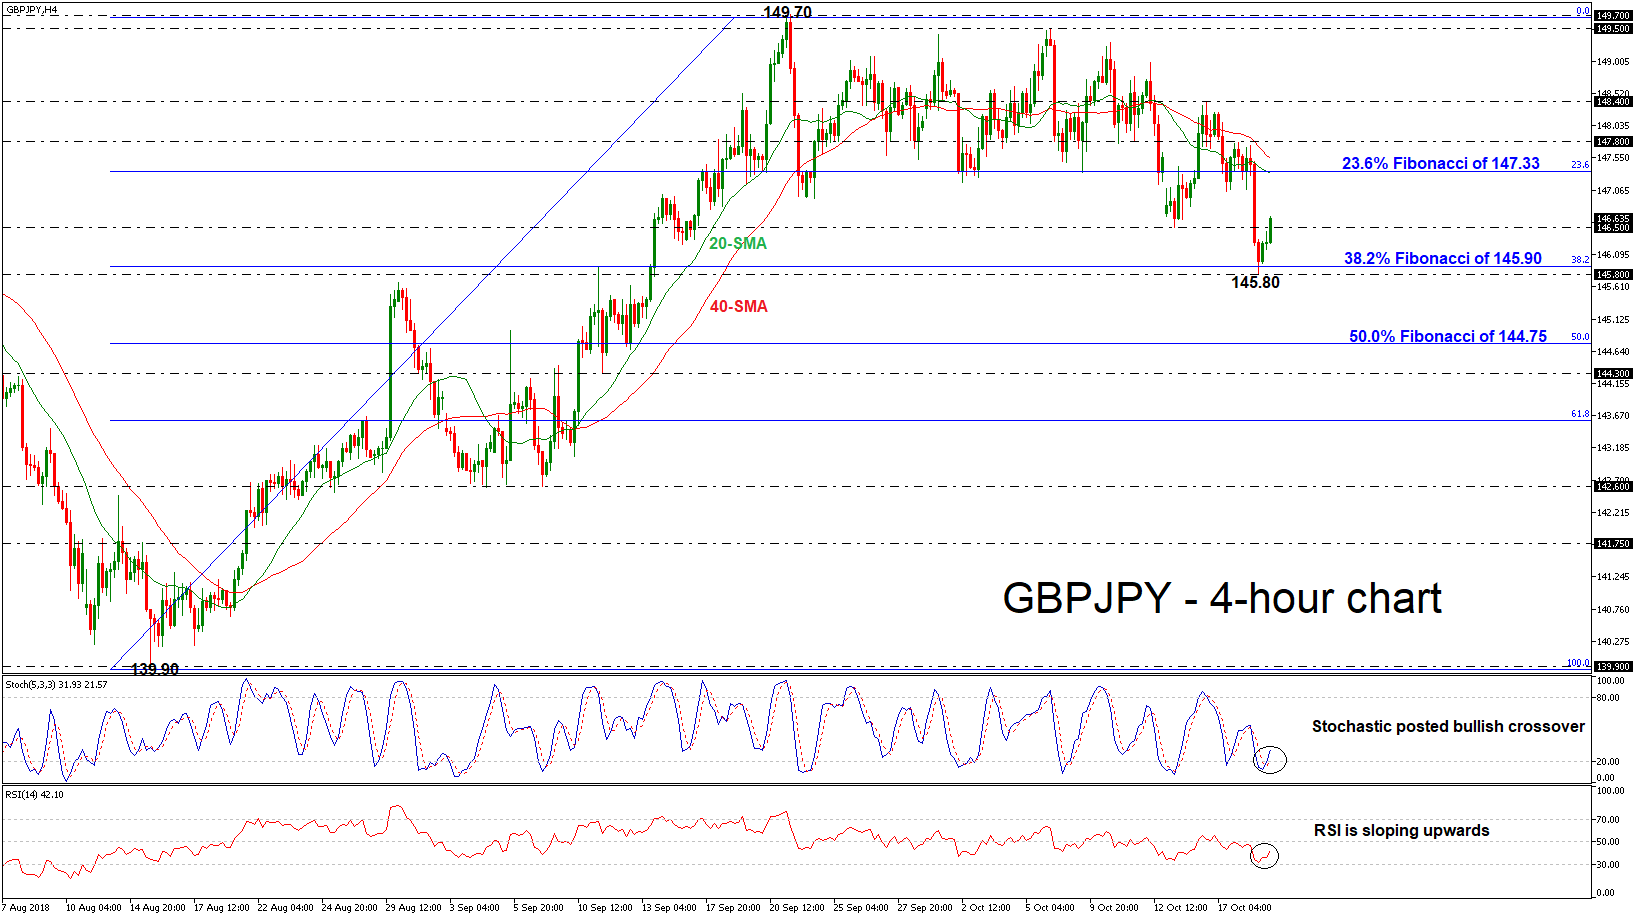
GBPJPY has been edging higher over the last couple of sessions in the 4-hour chart, following the rebound on the one-month low of the 145.80 support level. The RSI indicator is confirming this movement as it is approaching the threshold of 50. Furthermore, the %K line of the stochastic oscillator created a bullish cross with the %D line in the oversold zone, which is a strong buying signal for traders.
The next resistances are coming from the 20- and then the 40-simple moving averages (SMAs) at 147.33 and 147.55 respectively, but first the price needs to surpass the 146.50 strong obstacle. The mentioned level is encapsulating by the 23.6% Fibonacci retracement level of the upleg from 139.90 to 149.70. A successful leg above the aforementioned level would open the way towards the 147.80 resistance, taken from the latest highs on October 17. An even higher jump would ease the downside pressure and drive the pair until the 148.40 barrier, reached on October 16.
If there’s a failure of upside movements the market would return to losses and hit the support level at 145.80 near the 38.2% Fibonacci of 145.90. If the bears take charge and pull the pair below it, the 50.0% Fibonacci of 144.75 would be next level for investors to have in mind.
Overall, GBPJPY remains below the 20- and 40-simple moving averages (SMAs) in the 4-hour chart and a climb above these lines could confirm the scenario for short term upside tendency.
Pick Your Poison
Friday October 19: Five things the markets are talking about
Global concerns about rising yields, a deteriorating economic outlook and rising geopolitical tensions has capital markets closing out this volatile week on the back foot.
China’s slowing economic growth, Brexit and tensions between Rome and Brussels over the Italian budget are among the issues currently concerning investors. Also, throw into the mix – U.S/Saudi relations are worsening over the disappearance of journalist Jamal Khashoggi and investors are also waiting for November congressional elections in the U.S for guidance.
This Friday morning, Euro stocks are struggling as dealers weigh up corporate earnings against Chinese regulators whose rhetoric overnight promised to keep risks under control despite weaker economic headlines. This assurance saw China bourses rally from their four-year lows.
Elsewhere, Treasuries and the ‘big’ dollar are trading steady, while Italian debt comes under pressure as the E.U Commission responds to Italy draft budget plan with a stern rebuke – Italy plans are an “unprecedented” deviation from budget rules.
Oil prices have recovered a tad from their one-month lows after expanding U.S stockpiles surpassed tensions between the U.S and Saudi Arabia.
On Tap: Canadian CPI and retail sales are due at 08:30 am EDT.
1. Stocks mixed results
In Japan, the Nikkei ended the week in the ‘red,’ booking its third week of declines. The Nikkei share average at one stage dropped almost -2% intraday to hit a six-week low, however, by the closing bell, it was down -0.56%. The benchmark index has given up around -7.8%t since its 27-year peak print on Oct. 2.
Down-under, Aussie stocks edged lower overnight as China posted its weakest economic growth since the global financial crisis. The S&P/ASX 200 index eased -0.05%. The benchmark was up +0.7% for the week, snapping two straight weeks in the red. In S. Korea, the Kospi index recovered from early falls to close higher on the day. At the close, the index was up +0.37% after declining -1.4% earlier in the session. For the week, it slipped -0.3%, in its third consecutive weekly fall.
In China, regulators rushed to rally market confidence overnight as regional bourses traded atop of their four-year low on weaker economic data. China’s Q3 GDP y/y: +6.5% vs. +6.6%e (slowest growth since Q1 2009) and Sept. Industrial Production y/y: +5.8% vs. +6.0%e (slowest growth since 2016). Strong rhetoric managed to push the Shanghai index to close out +2.6% higher. Even with that, the index is still down -10% this month and nearly -25% on the year. In Hong Kong, the Hang Seng index also had a volatile session, closing out the week +0.42% higher.
In Europe, regional bourses are trading mixed. Italy remains the primary focus after the E.U Commission sent a letter to Finance Minister Tria regarding budget violations.
U.S stocks are set to open in the ‘black’ (+0.1%).
Indices: Stoxx600 -0.4% at 11533, FTSE -0.1% at 7019, DAX -0.5% at 11531, CAC-40 -0.8% at 5077, IBEX-35 -0.7% at 8833, FTSE MIB -1.3% at 18846, SMI +0.2% at 8798, S&P 500 Futures +0.1%
2. Oil higher, but set for weekly loss on stock builds, gold up
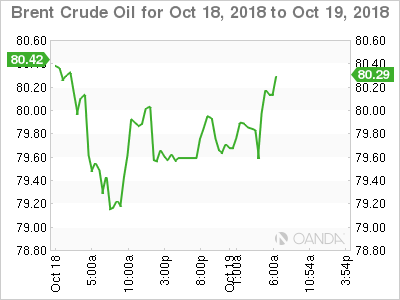
Oil prices are a tad firmer ahead of the U.S open on signs of surging demand in China, although the market is heading for a second consecutive week of losses on concern that trade wars were curbing economic activity and rising U.S inventories.
Brent crude oil is up +20c a barrel at +$79.49, while U.S light crude is up +15c at +$68.80.
Note: For the week, Brent is down -1% while WTI is down -3.5%, with both on track for a second consecutive weekly decline.
China is the world’s largest importer of crude and refinery data for September showed it rose to a record high of +12.49m bpd as some independent plants restarted operations after prolonged summer shutdowns.
However, undermining sentiment is weaker China growth data and a surge in last weeks U.S inventory data. According to the EIA, U.S crude stocks last week climbed +6.5m barrels, marking a fourth consecutive weekly build and almost triple market expectations.
Ahead of the U.S open, gold prices are holding steady as renewed political and economic concerns weigh on investor sentiment. The yellow metal is on track for a third consecutive weekly gain. Spot gold is up +0.1% at +$1,226.44 per ounce. The metal is up +0.7% for the week. U.S gold futures are up +0.1% at +$1,230.9 an ounce.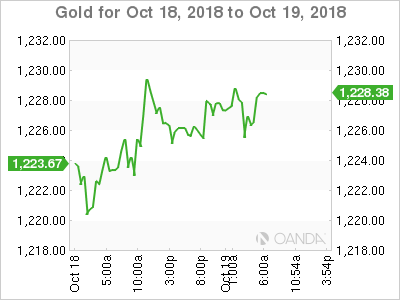
3. Italian bonds sold as E.U warns on Italy budget
Investors are selling Italian Euro periphery bonds, with Italy’s BTP yield hitting four-year highs as the E.U called its draft budget an “unprecedented” breach of E.U fiscal rules.
Italy’s benchmark 10-year bond yield has rallied to +3.74%, the highest since February 2014 and the spread of Italy’s 10-year BTP’s over Germany’s advanced +9 bps to the biggest premium in more than five-years.
Up to this point, E.U periphery debt, Spain and Portugal in particular, had gone somewhat unscathed, however this morning; periphery debt has also backed up +5 to +6 bps on possible signs of contagion.
Elsewhere, the yield on 10-year Treasuries decreased -1 bps to +3.18%. In Germany, the 10-year Bund yield declined -1 bps to +0.40%, the lowest in more than five weeks. In the U.K, the 10-year Gilt yield has dipped -1 bps to +1.533%, reaching the lowest in more than two-weeks on its seventh consecutive decline.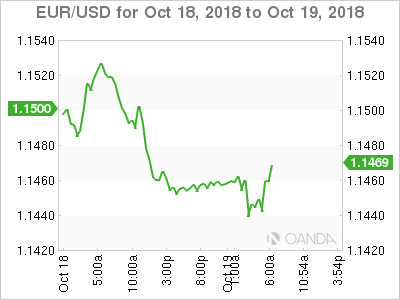
4. Italian worries push Euro to two-month lows
Concerns about Italy and a widening of the spread between Italian and German bond yields are keeping the EUR below the psychological €1.15 handle. The EUR is down -0.10% at €1.1445. The gap between BTP/Bund widened to a multi-year high after the E.C said Italy’s budget deviation was “unprecedented” and warned of “particularly serious non-compliance.”
Note: Next week, the Italian budget situation is key on the upcoming rating agency actions with S&P and Moody’s likely to act with possible downgrades on Italy.
Sterling trades slightly higher, up +0.1% at £1.3039 outright. Hard and soft Brexiteers’, moderates, the DUP and the SNP have all voiced opposition to the idea of an extension to the Brexit transition and this could bring up again speculation that PM May’s days are numbered.
PBoC continues to fix yuan weaker after escaping U.S treasury currency manipulator designation. USD/CNY was fixed at ¥6.9387 overnight, +112 pips from last fixing.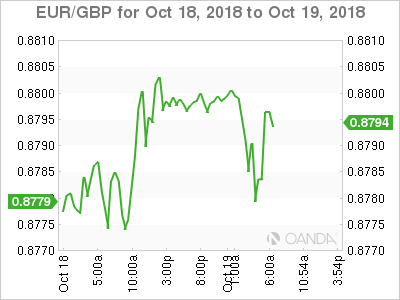
5. Eurozone’s current account surplus widens in August
Data this morning showed that the eurozone’s current-account surplus widened in August compared with July, supported by a rising surplus in goods.
The region’s current-account balance recorded a surplus of +€24B in August after July’s surplus of +€19B.
Despite the pickup, the balance was smaller than the +€39B surplus recorded in August last year, but the eurozone’s surplus remained elevated on a 12-month accumulated basis.
Numbers like this; you can bet further criticism from President Trump who has repeatedly scolded Germany for its bulging trade surplus, is coming.
In the 12-months through August this year, the eurozone recorded a current-account surplus of +€379B, or +3.3% of its GDP.
Note: By comparison, the U.S.’s current-account balance records a deficit.
EUR/USD – Euro Halts Slide As Current Account Impresses
EUR/USD has steadied on Friday, after posting considerable losses in two straight sessions. Currently, the pair is trading at 1.1447, down 0.04% on the day. It’s a quiet end to the week, with no key releases on the schedule. The eurozone current account surplus widened from EUR 21.3 billion to 23.9 billion. This easily beat the estimate of EUR 21.4 billion. In the U.S, Existing Home Sales is expected to drop to 5.29 million.
Italy’s draft budget has become a major headache for EU officials, and the crisis could escalate. The budget, which boosts public spending and cuts taxes, would raise the country’s deficit, which breaches EU rules. The government has sent the budget for approval to the European Union. On Thursday, the European Commission told Italy that the budget was not acceptable, and demanded a reply by Monday. This could put Rome and Brussels on a collision course, and the sour mood has sent Italian bond prices higher. The yield on 10-year Italian bonds stands at 3.73%, some 3.33% over the equivalent German bonds, as the gap between the two continues to widen. Bond prices in Spain, Portugal and Greece have also increased, making investors nervous. Italy’s debt stands at an astounding 132% of GDP, and there is a real risk that the country’s financial woes could destabilize the entire eurozone.
The Federal Reserve minutes from the September meeting showed that a majority of members want to continue raising interest rates until the U.S economy shows signs of slowing down. However, the duration of a tighter policy remains unclear, as the minutes noted that “there is considerable uncertainty surrounding all estimates of the neutral federal funds rate.” This would likely be around the 3 percent level, which will not be reached until the second half of 2019, as the Fed has indicated it will raise rates three times next year. At the September meeting, the Fed removed the phrase “the stance of monetary policy remains accommodative”, which was considered outdated, given the policy of steady rate hikes. As rates approach the “neutral rate”, we could see further changes in language at upcoming policy meetings.