

Sample Category Title
Currencies: USD Supported By Higher US Yields, At Least For Now
- Rates: Significant underperformance of US Treasuries against German Bunds
The Italian spread rose back above 300 bps as several EU heavyweights suggested that Italy will have to correct its draft budget. German Bunds outperformed US Treasuries, with the latter facing a significant sell-off at the end of trading. We expect recent trading pattern to extend today given a lack of impetus from the eco/event calendar. - Currencies: USD supported by higher US yields, at least for now
Yesterday, the dollar regained pole position on FX markets. Hawkish perceived Fed Minutes propelled US yields and the dollar. The US government refraining from labelling China as currency manipulator was slightly USD positive too. Today, the eco calendar is thin. If EMU-US interest rates continue to diverge, EUR/USD might go for a retest of the 1.1432 support
The Sunrise Headlines
- US equity markets closed yesterday’s session largely unchanged, with only the Dow Jones losing some ground (-0,36%). Asian markets are opening today’s session in red, with China underperforming (-2%.
- UK PM May returned home from the EU summit in Brussels with little progress made. She told European leaders that she is willing to extend the Brexit transition period beyond 2020. The move infuriated Eurosceptic Conservatives.
- Wilbur Ross, secretary of the US Commerce Dept., said the Trump-Juncker trade agreement is on loose screws. He said that Trump’s “patience is not unlimited” after EU trade commissioner Malmström accused the US of dragging its feet.
- The FOMC meeting minutes of the September meeting showed that Fed policy makers are not hesitating to continue to raise interest rates. The central bank seeks to prevent overshooting inflation and limit the risks of financial excesses.
- The US government refrained from labelling China as a currency manipulator in its semi-annual currency report. Treasury Secretary Mnunchin warned though for lack of Chinese FX transparency and recent yuan weakness.
- Matteo Salvini, Italy’s Deputy PM, said friends from various countries are urging him to run for the European Commission presidency in May 2019. He added that he is considering it.
- Today’s eco calendar contains the Philadelphia Fed Business Outlook for October and the Initial Jobless Claims in the US. The UK releases numbers on retail sales. ECB’s Nowotny and Fed’s Bullard and Quarles speak today.
Currencies: USD Supported By Higher US Yields, At Least For Now
Will USD enjoy additional interest rate support?
Global equity markets took a cautious approach yesterday after Tuesday’s US rally. The dollar returned to pole-position. USD strength gained further momentum later. The Minutes of the September meeting showed broad support within the Fed to raise rates beyond neutral if the economy stays on track. US yields jumped north and the dollar profited from this additional interest rate support. The US government also refrained from labelling China (or any other trading partner) as a currency manipulator. This might have been a slightly USD positive, too. EUR/USD closed at 1.1501. USD/JPY also finished in positive territory at 112.65. This time, the USD/JPY was also mainly driven by interest rate differentials rather than developments on the equity markets. Overnight, Asian equities are mostly trading in negative territory. Chinese indices are again a notable underperformer. USD/CNY trades near 6.94, the weakest yuan level since early 2017. The combination of higher US yields and a risk-off sentiment this time supports the dollar. EUR/USD is drifting below the 1.15 level. USD/JPY is losing a few ticks. Maybe the yen also profits slightly from comments of BoJ’s Kuroda as he suggested that core inflation has returned to the 1.0% area (rather than 0.5%-1.0% indicated in the Sept BoJ policy statement). Later today, the EMU eco calendar is empty. US jobless claims and Philly Fed business outlook are only of intraday significance. For USD traders, the question is whether US yields will extend yesterday’s rise. If so, the dollar can keep a positive momentum. European topics (budgets, rising Italian spreads, Brexit) probably won’t yield support for the euro. In this context, some further USD strength might be the way of least resistance. The EUR/USD 1.16/1.1620 area proved to be rather tough ST resistance of late. In a context of rising USD yields, EUR/USD might go for a retest of the 1.1432 ST bottom. A break would open the way to the 1.1301 August correction low.
Yesterday, sterling initially lost some further ground ahead of the EU Brexit summit and on softer than expected September UK eco data. The summit as expected didn’t yield any progress in Brexit. PM May considering the option of longer transition period was mentioned as a positive. EUR/GBP closed the session little changed at 0.8770. Today, the UKL retail sales are expected soft (0.4% M/M). For EUR/GBP, more technical trading around current levels might be on the cards.
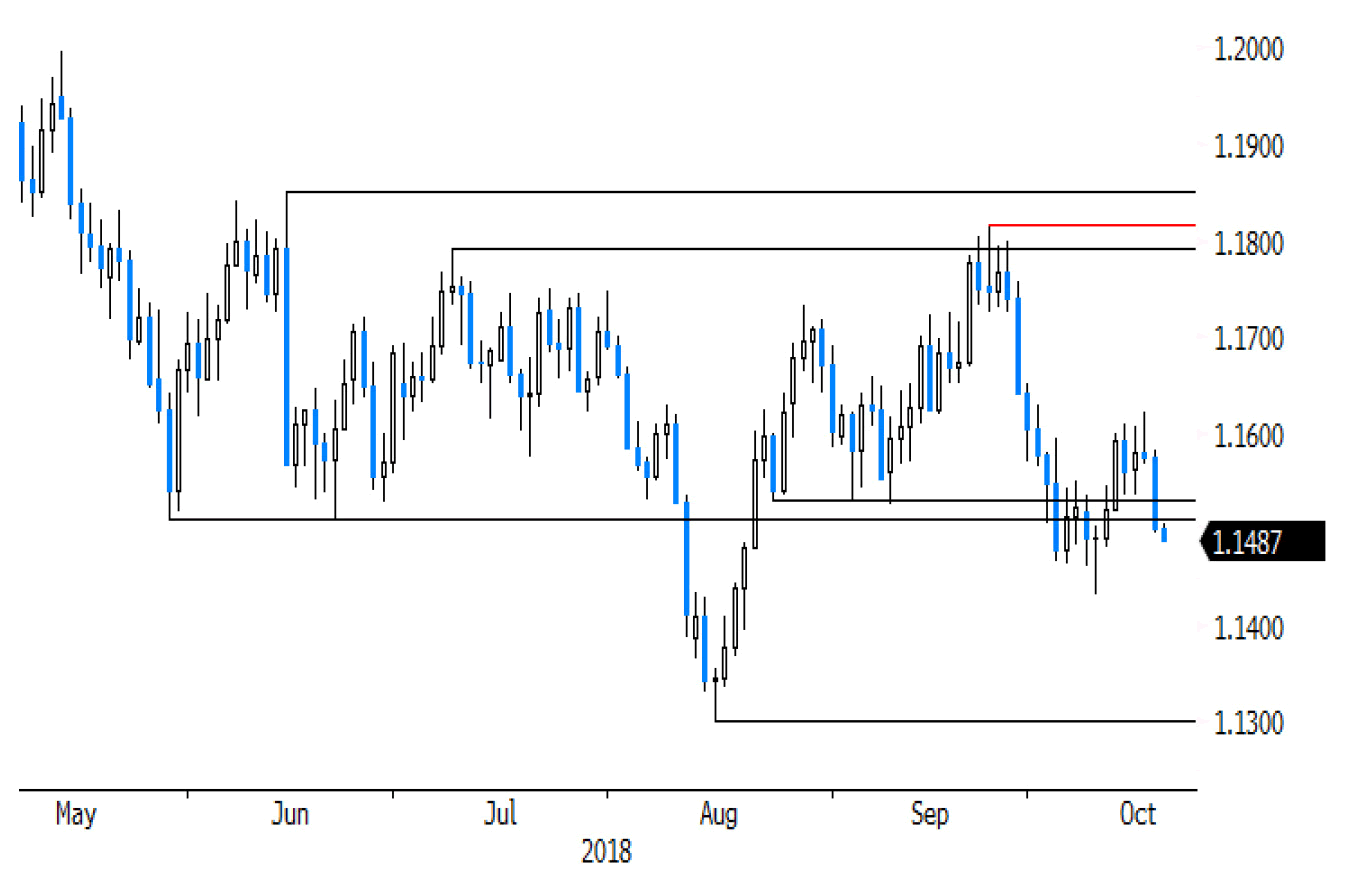
EUR/USD: dollar supported by rising US interest rates. Test of EUR/USD 1.1432 might be on the cards
Is the FOMC or the Private Sector More Consistent?
"Prophesy is a good line of business, but it is full of risks." – Mark Twain
Executive Summary
In our previous reports, we developed a framework to analyze FOMC and private sector forecast behavior, and our analysis suggested that the FOMC is overly optimistic.1 That is, the FOMC paints a positive picture by forecasting trend-like growth and a "controlled" inflation outlook. Our final report of this series examines whether FOMC and private sector growth and inflation forecasts are consistent with the corresponding fed funds rate forecasts.
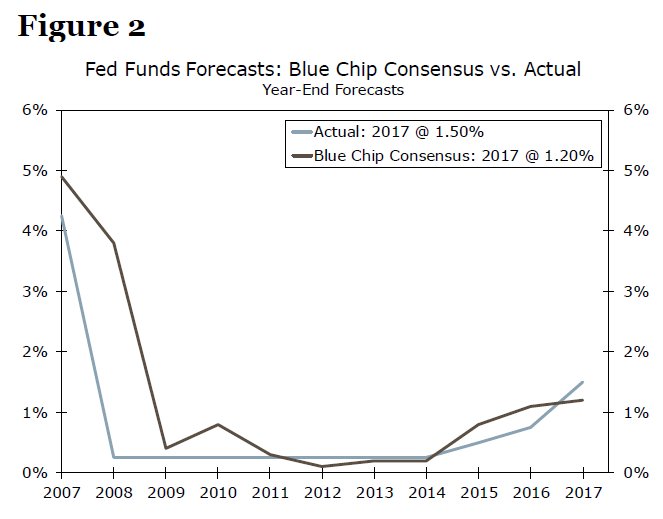
Our analysis suggests that the FOMC under-forecasted the fed funds rate, while the Blue Chip consensus, a proxy for private sector forecast behavior, over-forecasted the fed funds rate for the complete time period. Under Fed Chair Bernanke's leadership, the FOMC under-forecasted the fed funds rate, while the Blue Chip consensus over-forecasted the fed funds rate for the same period. But under Chair Yellen, the FOMC over-forecasted the fed funds rate, while the Blue Chip consensus continued to over-forecast the fed funds rate for the same period.
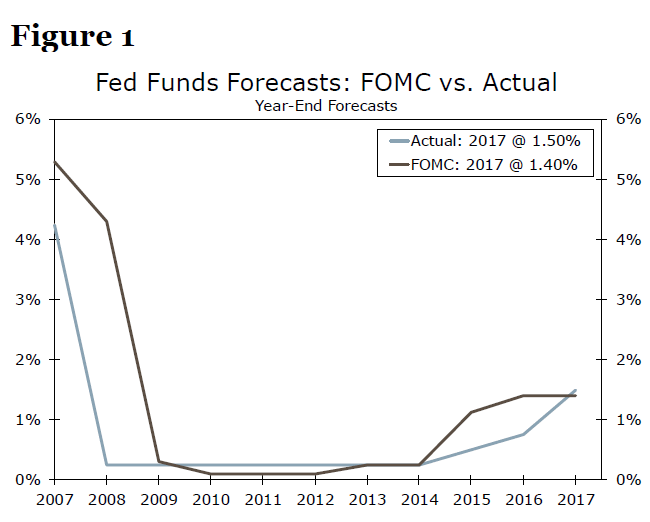
At first glance, the Blue Chip consensus' forecasting behavior seems "consistent," as overforecasting the fed funds rate is consistent with over-forecasting GDP growth. In theory, a stronger growth outlook would suggest a higher fed funds rate, all else equal. The same theoretical standards would characterize the FOMC's forecasting behavior as "inconsistent," as the FOMC underforecasted the fed funds rate, but over-forecasted GDP growth for the same time period.
However, the FOMC and Blue Chip consensus forecasts seem to be consistent with their respective objectives. For example, the private sector's objective likely includes informing decision makers about potential changes in the economic regime, such as rising borrowing costs. Moreover, the fed funds rate is an important element in determining borrowing costs, and a stronger growth outlook would boost borrowing costs, all else equal. Private sector forecasts could send signals about the potential for higher borrowing costs via over-forecasting the fed funds rate. The FOMC's stronger GDP growth forecasts and under-forecasts of the fed funds rate are also likely consistent with the FOMC's dual mandate of price stability and fostering maximum employment. That is, the FOMC could be forecasting an economic outlook consistent with its mandate, where the economy is growing close to its potential without excessive inflationary pressures, so the fed funds rate increases only gradually.
A Theoretical Framework for Examining Forecast Behavior
Our previous report presented a theoretical framework to evaluate FOMC and private sector forecasts to characterize whether the FOMC or the private sector is overly optimistic. In practice, forecasts do not always hit their targets, and this creates a higher possibility of forecast errors. The total cost (potential damages/losses) of forecast errors is labeled as the loss function. The forecast error can be divided into an under-forecast (the forecast is lower than the actual value) and an over-forecast (the forecast is higher than the actual value). The question then becomes whether the cost of under-forecasting is identical to the cost of over-forecasting, known as a symmetric loss function. If the cost of being wrong is not identical for under-/over-forecasts, this is called an asymmetric loss function. In the case of a symmetric loss function, a forecaster is indifferent between under- and over-forecasting. However, an asymmetric loss function has the potential to dictate a preference for forecast errors. If a forecaster knows that under-forecasting could cause more damage than over-forecasting, that forecaster may tend to over-forecast, all else constant. We suggested that the loss function is asymmetric for both the FOMC and for the private sector. We now examine possible forecasting rationales for the Blue Chip consensus and the FOMC in terms of the fed funds rate forecasts.
Blue Chip consensus forecasts are a proxy for the private sector, and most of those forecasters and their firms would likely be affected by changing borrowing costs. In theory, a rising fed funds rate would increase borrowing costs for the private sector, and to gauge the borrowing cost trajectory, forecasters could send signals about the potential path of the fed funds rate. For example, a stronger growth outlook along with rising inflation would suggest a rising interest rate environment, all else equal, so over-forecasting GDP growth and inflation would be consistent with over-forecasting the fed funds rate. Most Blue Chip members' forecasts also likely do not have the same type of explicit goal as the FOMC's dual mandate, or the potential to influence expectations to the same degree as the FOMC.
The FOMC, however, has an explicit dual mandate, and its forecasts may also influence private sector forecasts2. Our previous reports concluded that the FOMC paints an optimistic picture through its GDP growth and inflation forecasts. In addition, the FOMC could influence private sector expectations via its fed funds rate forecast, as the forecast would indicate the expected policy stance. That is, a lower fed funds rate path may suggest an accommodative monetary policy stance, compared to a rising fed funds forecast that would indicate policy normalization or a restrictive policy stance, all else equal. In this way, the FOMC's fed funds forecasts have a different objective than the private sector in terms of setting monetary policy, whereas the private sector responds to these policy changes.
Fed Funds Forecasts: The FOMC vs. the Blue Chip Consensus
We examine 10 years of historical fed funds rate forecast data from both the FOMC and the private sector, using the Blue Chip consensus as a proxy for private sector expectations. We compare the year-ahead fed fund forecast for each source to the actual year-end fed funds rate.3 While we only have limited readily available forecast data back to 2006, we find that for the entire forecast period, the FOMC under-forecasts the fed funds rate 55% of the time, while the Blue Chip consensus over-forecasts the fed funds rate 64% of the time. When we break out forecasts by Fed chair, we find a similar story for the Bernanke era, as the FOMC under-forecasted the fed funds rate 63% of the time, while the Blue Chip consensus over-forecasted the fed funds rate 63% of the time. Moving to the Yellen era, the trend reverses for the FOMC, as it over-forecasts the fed funds rate 67% of the time. The Blue Chip consensus maintains its forecast consistency over the same time period, also over-forecasting the fed funds rate 67% of the time.
Fed Funds vs. GDP and Inflation: Not All Forecasts are Created Equal
In our view, the fed funds rate forecasts may also carry a higher weight than growth and inflation forecasts. The GDP growth and inflation forecasts represent the FOMC's expectations about the near-term economic outlook. The growth and inflation outlook is an integral element of rate-setting decisions; however, it is likely not the only aspect that influences these decisions. The FOMC has mentioned several times in its policy statements that financial sector developments, fiscal policy and international events are also part of the process when setting the fed funds rate target. Essentially, the fed funds rate forecast could shed light on the FOMC's expectations about the near-term overall outlook, encompassing not only domestic economic factors, but also political and international events as well. Finally, the fed funds rate is arguably the most visible of these forecasts, giving it additional consideration in the policymaking process.
Conclusion: Power of Positive Thinking Does Matter in Policymaking
In our final report, we find that the FOMC tended to under-forecast the fed funds rate for the complete forecast period, while private sector forecasts measured by the Blue Chip consensus tended to over-forecast the fed funds rate. These differences likely stem from differing forecast objectives, as the FOMC likely focuses on its dual mandate and overall visibility of its expected monetary policy stance. The private sector, on the other hand, is more directly affected by rising borrowing costs, and could use its over-forecasts of the fed funds rate to signal such an event. These differing forecast outcomes confirm that objectives matter when it comes to forecasting monetary policy and informing the business community of the possible effects of policy changes.
APPENDIX
Our analysis utilizes 10 years of historical fed funds forecast data from the Fed's Greenbook forecasts/Summary of Economic Projections (SEP) and the Blue Chip Economic Forecasts. For the FOMC's fed funds forecasts, as the FOMC did not begin publishing the SEP until 2012, we use the forecasts complied by the Fed staff in the Greenbook and given to the FOMC ahead of each meeting as a proxy for the FOMC's forecasts from 2006-2012. For each year, we take the one-year ahead forecast measured as the Q4 average published in the December Greenbook/SEP of the prior year. For example, we use the December 2006 Greenbook to get the full-year 2007 forecast. Once the FOMC began publishing the SEP in 2012, we use the median year-ahead forecast from the December "Dot Plot," which displays fed funds rate projections of FOMC members.
For the Blue Chip consensus data, we use the Blue Chip Financial Forecast publication, which includes an aggregate consensus forecast of the individual forecast submissions of leading forecasters.4 We take the one-year ahead forecast measured as the Q4 average for each variable that is published in the January Blue Chip Financial Forecast publication. Using the January publication allows for the most complete year-ahead forecast, because forecasters effectively do not have information on economic conditions for the current year when preparing to submit forecasts for a January release.
1 "Is the FOMC Overly-Optimistic?" Published on July 31, 2018. "Is the FOMC or the Private Sector More Optimistic?" Published on August 28, 2018.
2Romer, Christina, D., and David H. Romer. 2000. "Federal Reserve Information and the Behavior of Interest Rates." American Economic Review, 90 (3): 429-457.
3For more details on our methodology, please see the Appendix.
4 https://lrus.wolterskluwer.com/store/product/blue-chip-financial-forecasts/
GBPUSD Furhter Weakness Expected Below 1.3100
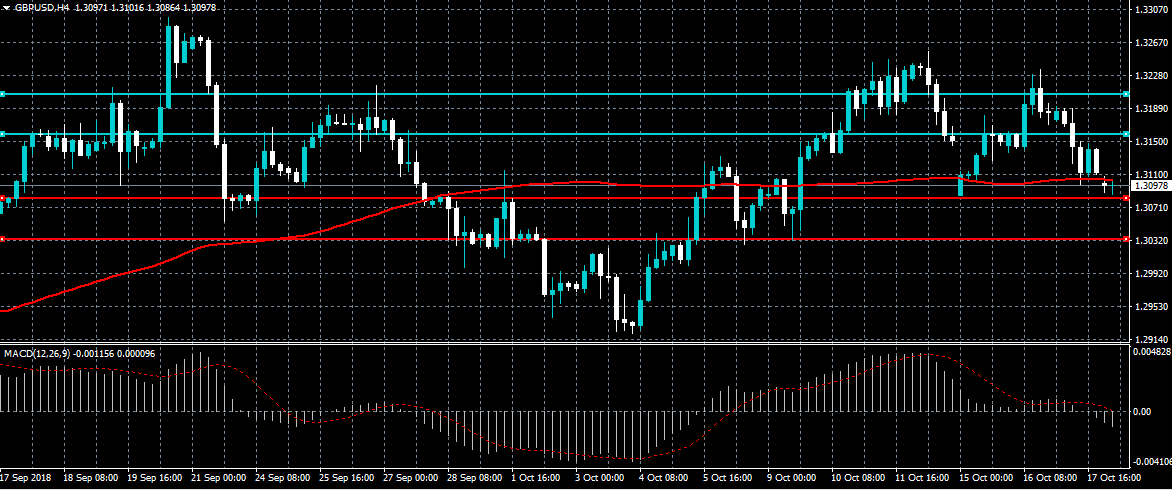
The British pound has weakened below the 1.3100 level against the greenback after the US dollar index strengthened to a one-week trading high following the FOMC Meeting Minutes. The GBPUSD pair is likely to weaken further while trading below the 1.3100 level. Buyers need to move price above the 1.3155 resistance level to change the intraday bias, while sellers will attempt to break the current weekly trading low.
The GBPUSD pair is strongly bearish while trading below the 1.3100 level, key support is found at the 1.3070 and 1.3033 levels.
If the GBPUSD pair moves above the 1.3100 level, buyers may test towards the 1.3155 and 1.3200 levels.
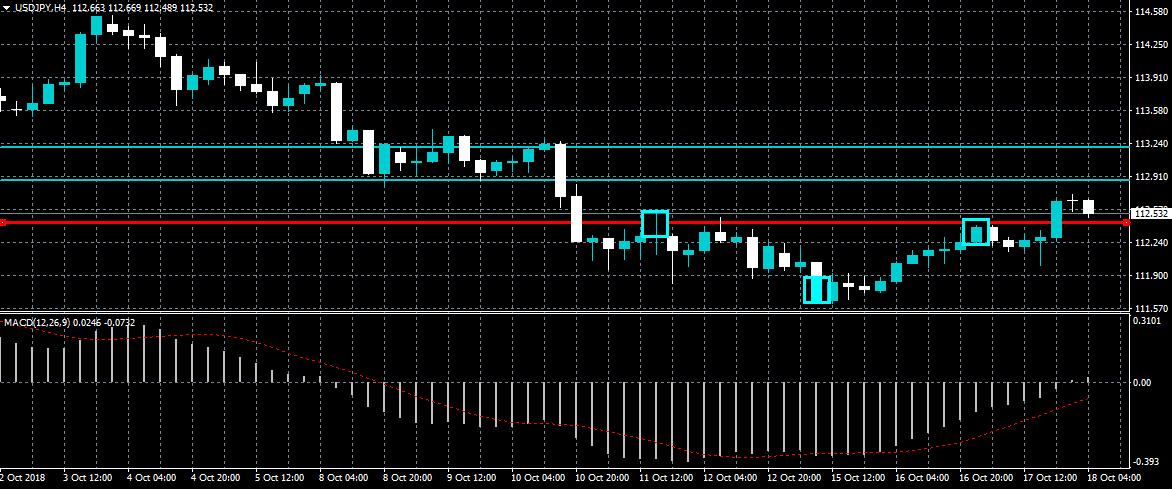
USDJPY Intraday Bullish Above 112.45
The US dollar is breaking to the upside against the Japanese yen after the FOMC Meeting Minutes showed the Federal Reserve struck a hawkish tone towards future US rate increases. The USDJPY pair is intraday bullish above 112.45 level and supported by a bullish inverted head and shoulders pattern. The Moving Average Convergence Divergence indicator on the four-hour time frame is also starting to trending higher.
The USDJPY pair is intraday bullish while trading above the 112.45 level, key resistance is found at the 112.90 and 113.20 levels.
If the USDJPY pair trades below the 112.45 level, intraday sellers may test towards 112.20 and 112.00 support levels
Crude Oil Falls Sharply After A Surprise Increase In Inventories
Japanese yen declined against the USD after Japan reported disappointing export data. In September, exports fell by minus 1.2% while exports to the US declined by 0.2%. The decline is mostly attributed to the current issues about trade. It has been offset by the weakening yen, which makes exports cheaper. Since April, the yen has declined by more than 7% against the USD.
The dollar index rose broadly after the Federal Reserve released minutes for the past meeting. The minutes showed that all officials were supportive of interest rate hikes. They also suggested that a time will come when the Fed will move from normalization to a more restrictive stance. The statement said:
With regard to the outlook for monetary policy beyond this meeting, participants generally anticipated that further gradual increases in the target range for the federal funds rate would most likely be consistent with a sustained economic expansion, strong labor market conditions, and inflation near 2 percent over the medium term.
Certainly, the statement did not please the US President, Donald Trump, who has criticized the Fed for the ongoing tightening. In interviews, he has called the Fed crazy and cited it as his biggest threat. He is also disappointed with Jerome Powell being the Fed chair.
The euro declined against the USD in the Asian session after reports that a deal between the US and the EU was at risk. In July, the US President met with EU leaders to iron out issues about trade. They left the meeting with a truce and a promise for a deal that involved lowering of tariffs and non-tariff barriers. Yesterday, commerce secretary, Wilbur Ross, said that the President’s patience was ‘not unlimited’. He accused Cecilia Maelstrom of acting in bad faith while negotiating with the US. There was criticism about the deal with many people saying it was short of specifics.
The price of crude oil declined sharply after EIA released the latest inventory numbers. The numbers showed that inventories jumped to 6.5 million barrels, which was almost triple than what traders were expecting. This was similar to last week when inventories continued to rise. This week, the price of crude has been fluctuating as traders think about inventories, Iran sanctions, and the growing issues between the US and Saudi Arabia.
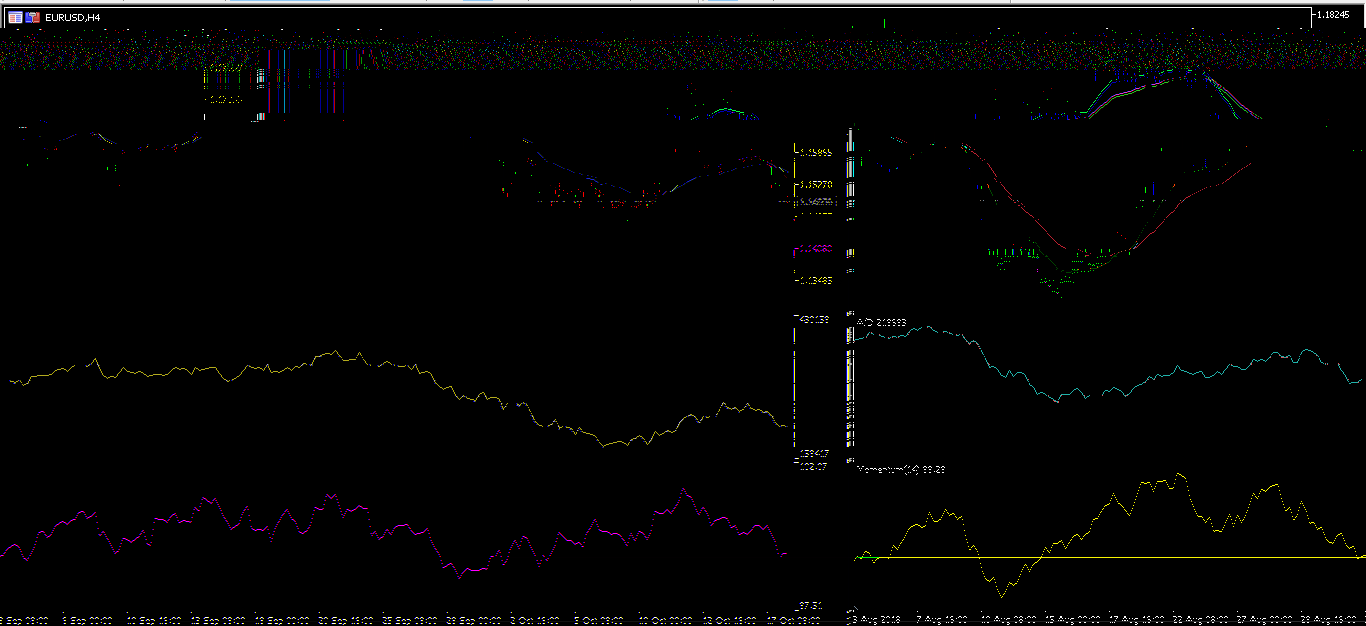
EUR/USD
The EUR/USD pair declined to an intraday low of 1.1500 in the Asian session. This was the lowest level since Thursday last week. The double EMA of the 14 and 28-day moving averages point to a continued decline of the pair. However, this is happening during a period of low volumes, which is an indication that the pair’s decline could be short lived. This is confirmed by the momentum indicator and the accumulation/distribution indicators as shown below.
USD/JPY
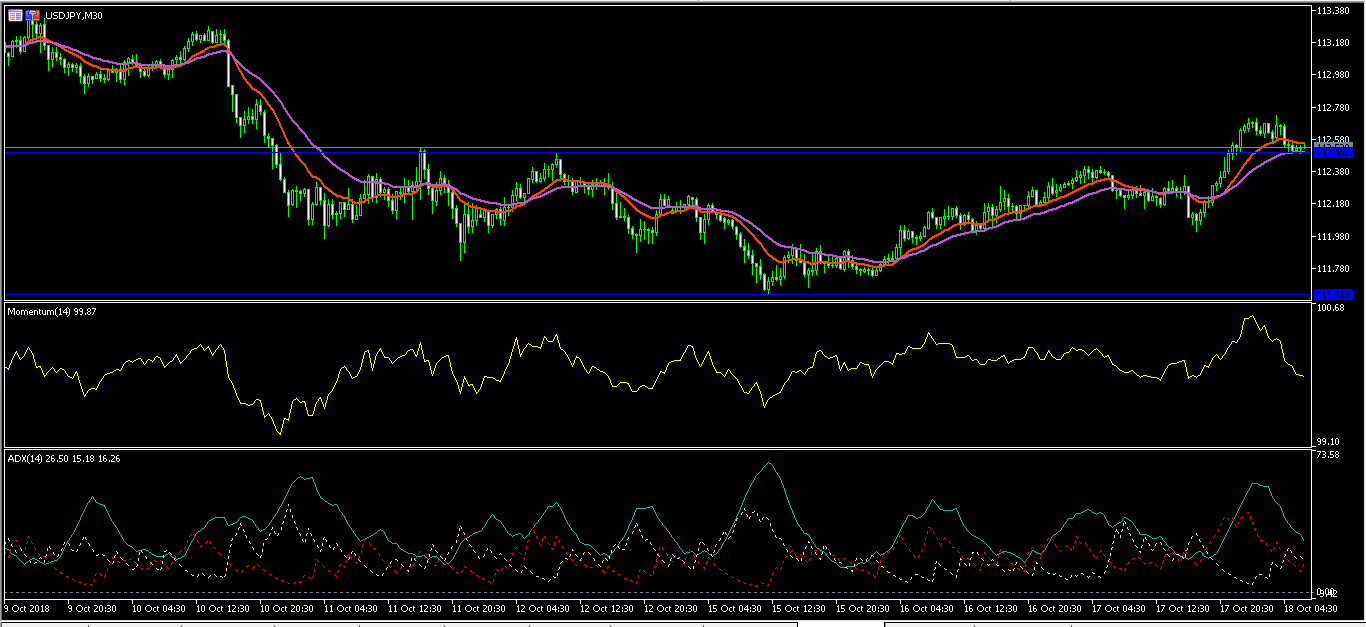
The USD/JPY pair has been moving upwards since Monday this week. It has moved from a low of 111.61 to the current high of 112.72. The price is along the 14 and 28-day EMA which seem headed for a crossover. The upward momentum has eased as shown by the momentum indicator above while the strength of the upward trend is also questionable. This is because of the trend in the ADX indicator, which is currently at 26.
XTI/USD
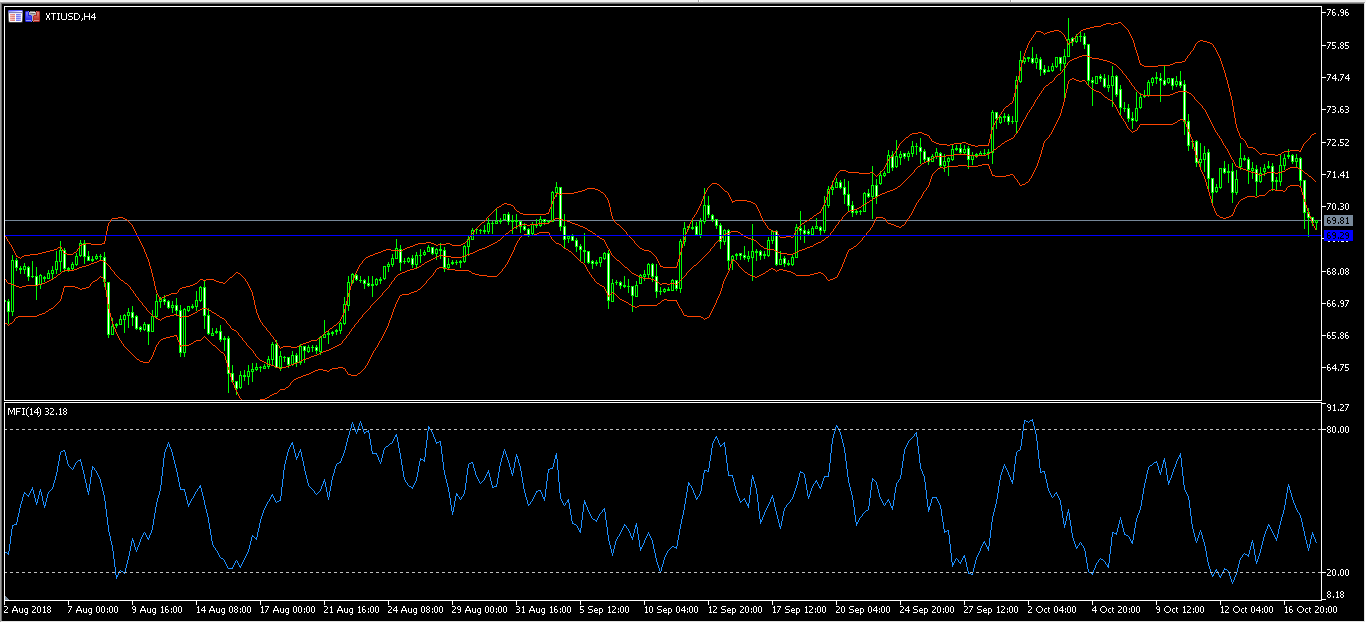
The price of crude oil continued to decline after inventory numbers released yesterday. The WTI reached a low of $69.29, which was the lowest level since September 20. The price is deeply along the lower line of the Bollinger Band, which is a sign that the downward trend will continue. This is confirmed by the MFI indicator and the RSI which show a likelihood of further declines. If it happens, the XTI/USD pair will likely test the 68 support.
GBP/USD Bearish Price Action Needs Break For Wave-3
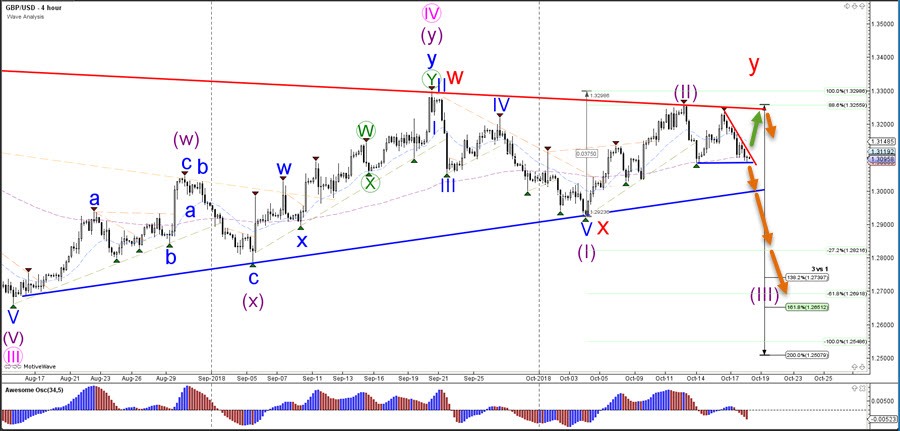
The GBP/USD bearish bounce is now testing the previous bottom (blue) and larger support trend line (blue), which are both bounce or break spots.
The GBP/USD break above the resistance trend line (red) could indicate a bullish move towards the higher resistance trend line (red) whereas a break below support could confirm the potential wave 3 (purple) pattern.
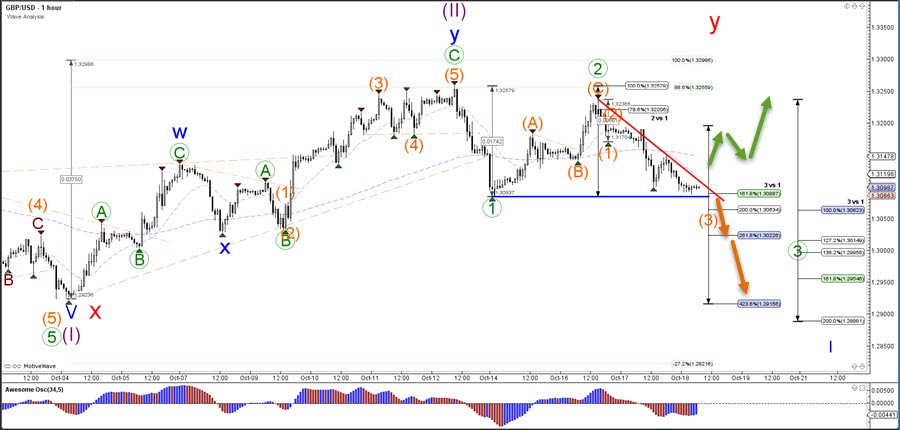
The GBP/USD bounced Fibonacci resistance levels but still needs to break below support if it is going to confirm a potential wave 3 (orange). A break above resistance could indicate and expanded correction in wave 2 (green).
GBP/JPY Daily Outlook
Daily Pivots: (S1) 147.11; (P) 147.69; (R1) 148.32; More...
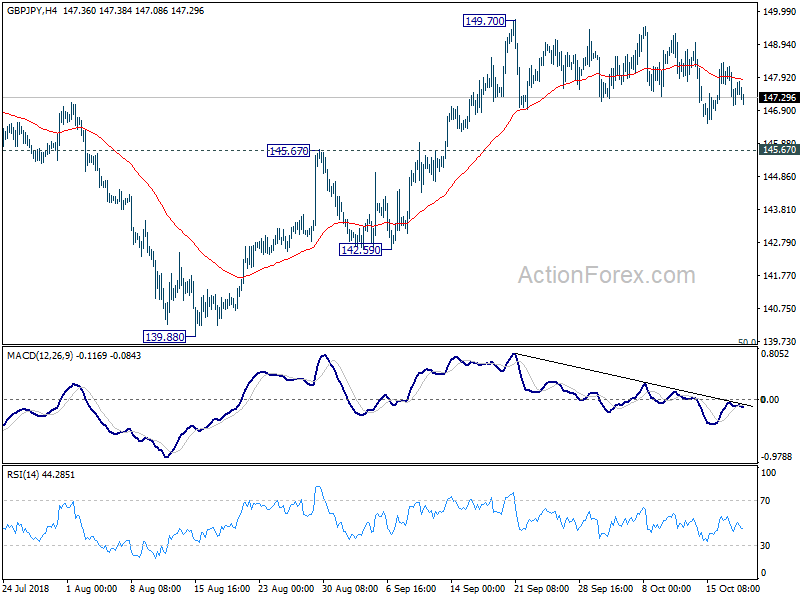
No change in GBP/JPY's outlook. Consolidation from 149.70 is still in progress and intraday bias stays neutral. In case of another fall, outlook will remain cautiously bullish as long as 145.67 resistance turned support holds. On the upside, above 149.70 will target 153.84/156.69 resistance zone next. However, break of 145.67 will suggest that the rebound from 139.88 has completed and turn near term outlook bearish again.
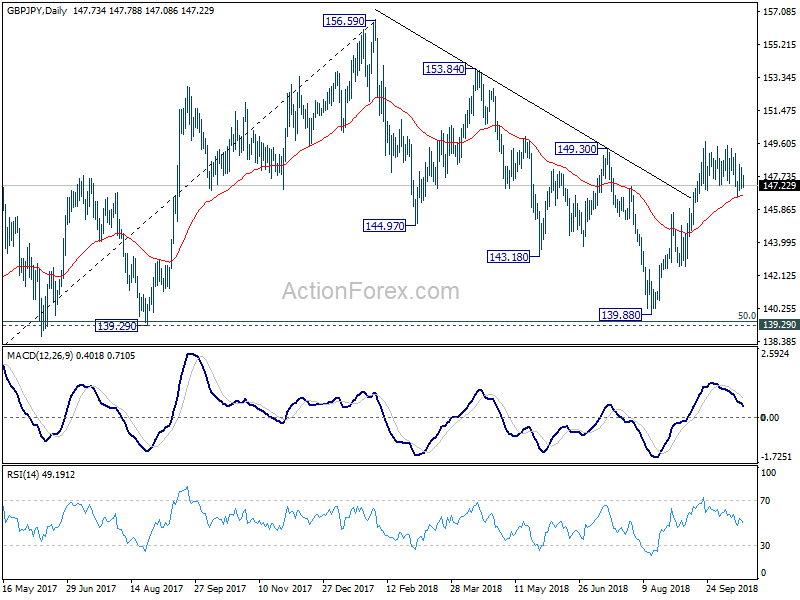
In the bigger picture, current development suggests that GBP/JPY has successfully defended 139.29 cluster support (50% retracement of 122.36 to 156.59 at 139.47). And, the rally from 122.36 (2016 low) is still intact. Such medium to long term rise would extend through 156.96 high. This will now be the preferred case as long as 145.67 near term support holds. However, break of 145.67 will turn focus back to 139.29/47 key support zone.
Upcoming China GDP Figures In Focus
General Trend:
- Asian equity markets trade generally weaker, recently released Fed minutes eyed
- Shanghai Composite falls to lowest level since November 2014, declines over 2% in early trade
- China local government moves to ease risks related to share pledging agreements
- Australian energy producers Santos and Woodside decline following production updates
- Australia Sept unemployment rate hit the lowest level since 2012, labor participation rate declined
- Japan’s exports declined in Sept for the first time in 22 months
- Former PBoC member Fan Gang said China will never sell off its Treasury holdings amid trade war
- Bank of Korea Gov Lee said ‘time to pay attention to risks to financial stability’
- Taiwan Semi is expected to report earnings later today
- US companies expected to report earnings on Thursday (including afterhours) include American Express, Bank of New York, Intuitive Surgical , Nucor, PayPal, Philip Morris, Blackstone Group, Travelers
- China Q3 GDP data due for release on Friday
Headlines/Economic Data
Japan
- Nikkei 225 opened +0.1%
- (JP) Japan Investors Weekly Net Buying of Foreign Bonds: +¥1.02T v -¥200.5B prior; Foreign Buying of Japan Stocks: ¥52.6B v +¥1.58T prior
- (JP) Japan Sept Trade Balance: +¥139.6B v -¥45.1Be; Adj Trade Balance: -¥238.9B v -¥333.4Be; Exports y/y: -1.2% v 2.1%e (1st decline in 22-months); Imports y/y: 7.0% v 13.7%e
- (US) Treasury Currency Report: Leaves Japan on the watch list
- (JP) Bank of Japan (BoJ) Gov Kuroda: Expect CPI to pick up towards 2% target, core currently ~1%; reiterates will keep rates very low for an extended period
- (JP) Japan MoF sells ¥1.0T v ¥1.0T indicated in 0.70% (prior 0.50%) 20-yr bonds; avg yield 0.6830% v 0.4920% prior; bid to cover 4.23x v 4.54x prior
Korea
- Kospi opened -0.4%
- (US) Treasury Currency Report: Leaves South Korea on the watch list
- (KR) BANK OF KOREA (BOK) LEAVES 7-DAY REPO RATE UNCHANGED AT 1.50% (AS EXPECTED) ; Reiterates to keep policy accomodative, to see if more adjustment in policy accomodation needed; decision was not unanimous with 2 dissenters v 1 at prior decision
China/Hong Kong
- Hang Seng opened +0.8%, Shanghai Composite -0.7%
- (CN) China local govt of Guangzhou considering measures to ease share pledge risk
- (CN) China Securities Regulatory Commission (CSRC) planning to ease up on A-share funding via stock issues and investment banking – press
- (CN) China Policy Adviser/former PBoC Member Fan Gang says China will never sell off its US Treasury holdings to hit back at the US amid trade war; China must not launch retaliatory attacks against US companies - financial press
- (US) Treasury Currency Report: Leaves China on the watch list; China's lack of currency transparency is a particular concern; Treasury will monitor yuan depreciation; Dollar strength and yuan decline could widen imbalances; Estimates that Chinese Central Bank's direct currency intervention has been limited this year
- (CN) China Premier Li said domestic economy faces increasing downward pressure, reiterates government will take targeted measures to prevent large fluctuations in growth - financial press
- (CN) China PBoC Open Market Operation (OMO): Skips OMO v skipped prior: Net: nil v nil prior
- (CN) China PBoC set yuan reference rate: 6.9275 v 6.9103 prior
- (CN) China Sept FDI YTD y/y: 2.3% v 2.3% prior
- (CN) CHINA SEPT M2 MONEY SUPPLY Y/Y: 8.3% V 8.3%E; M1 Money Supply Y/Y: 4.0% v 3.9%e; M0 Money Supply Y/Y: 2.2% v 3.5%e
- (CN) CHINA SEPT NEW YUAN LOANS (CNY): 1.380T V 1.359TE
- (CN) CHINA SEPT AGGREGATE FINANCING (CNY): 2.21T V 1.55TE
- (US) Commerce Sec Ross: China negotiations due appear to be in a hiatus currently
- (CN) Exporters in China are seeking to protect profit margins, some firms said to cut prices amid tariff impact - HK Press
Australia/New Zealand
- ASX 200 opened +0.0%
- WPL.AU Reports Q3 production 23.1 MMBOE v 20.3 y/y; Total Rev $1.29B v $1.01B y/y
- STO.AU Reports Q3 production 15 MMBOE v 15 y/y; Rev $973M v $793M y/y; Narrows FY19 guidance, cuts CAPEX
- (AU) Analysts note Australia power demand to be much weaker this year; forward prices are weak and competition has increased
- (AU) Australia Q3 NAB Business Confidence: 3 v 7 prior (weakest reading since 2016); Conditions: 13 v 15 prior
- (AU) Australia Trade Min Ciobo: Australia has joined the WTO pact on government procurement
- (AU) AUSTRALIA SEPT EMPLOYMENT CHANGE: 5.6K V 15.0KE (2ND CONSECUTIVE MONTH OF GROWTH); UNEMPLOYMENT RATE: 5.0% V 5.3%E (lowest level since 2012)
- (AU) Australia Q3 NAB Business Confidence: 3 v 7 prior
- (NZ) New Zealand Opposition finance Spokesperson: Opposition has serious concerns about RBNZ reforms; independence at risk from reforms
Other Asia
- (TW) Local banks in Taiwan said to pass stress test - Taiwanese Press
North America
- (US) Treasury Currency Report: Refrains from naming China as currency manipulator; keeps same six countries on FX watch list
- ECYT To be acquired by Novartis for $24/shr in cash in a $2.1B deal
Europe
- (UK) PM May told EU leaders that "we have shown we can do difficult deals together constructively, I remain confident of a good outcome"; willing to consider keeping Britain locked to the EU beyond 2020 in an extended transition
- (US) Treasury Currency Report: Switzerland must boost its FX transparency and domestic economy (CHF weakened on the statement)
- (EU) EU Parliament president Tajani:UK PM May offered nothing “new in content” during her address to leaders in Brussels, though there was a willingness to keep negotiating
- NESN.CH Reports 9M (CHF) Rev 66.4B v 65.1B y/y; affirms FY18 & 2020 targets
- SAP.DE Reports Q3 Non-IFRS Net €973M v €1.03Be, non-IFRS Op €1.74B v €1.80Be, Rev €6.03B v €6.02Be
- NOVN.CH Reports Q3 $1.32 v $1.31e, Rev $12.8B v $12.8Be; Raises FY18 outlook
Levels as of 01:30ET
- Hang Seng -0.4%; Shanghai Composite -2.0%; Kospi -0.7%; Nikkei225 -0.7%; ASX 200 +0.1%
- Equity Futures: S&P500 -0.3%; Nasdaq100 -0.4%, Dax -0.3%; FTSE100 -0.1%
- EUR 1.1505-1.1494; JPY 112.73-112.46 ; AUD 0.7137-0.7105;NZD 0.6556-0.6535
- Dec Gold -0.1% at $1,226/oz; Nov Crude Oil +0.1% at $69.82/brl; Dec Copper -0.0% at $2.76/lb
EUR/JPY Daily Outlook
Daily Pivots: (S1) 129.10; (P) 129.63; (R1) 130.10; More....
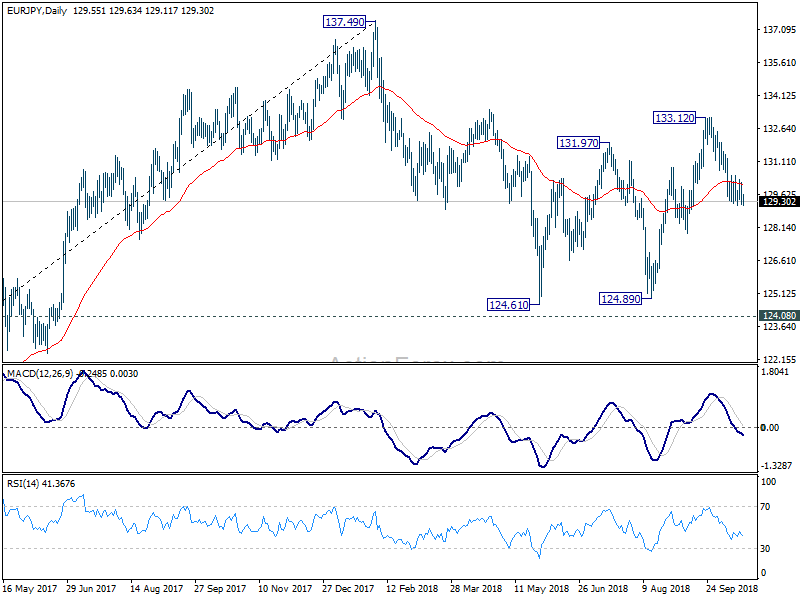
EUR/JPY is staying in consolidation above 129.11 and intraday bias remains neutral first. Near term outlook stays bearish with 130.70 resistance intact and further fall is expected. On the downside, break of 129.11 will target 127.85 support first. Break there will confirm completion of rebound from 124.89 at 133.12 and bring retest of this low. On the upside, though, above 130.70 minor resistance will turn bias back to the upside for 133.12 instead.
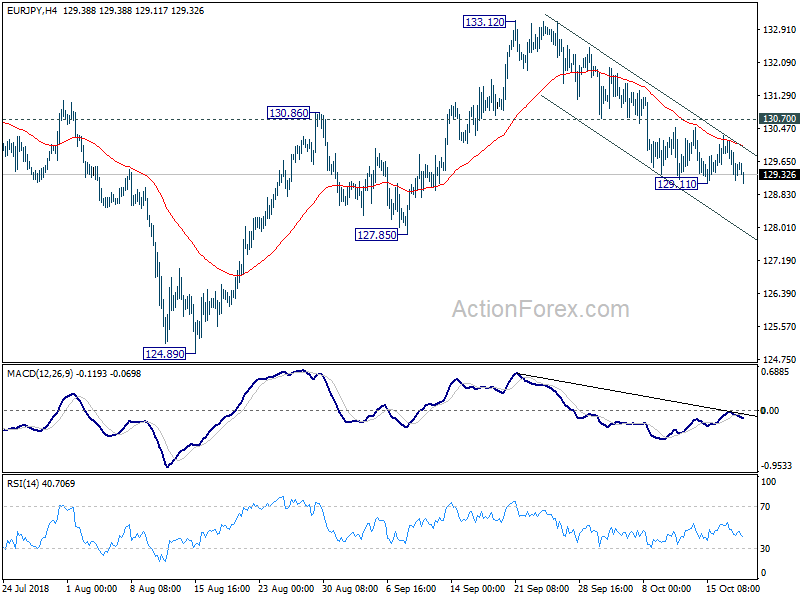
In the bigger picture, current development suggests that EUR/JPY could have defended key support level of 124.08 key resistance turned support. And, the larger up trend from 109.03 (2016 low) is still in progress. Firm break of 137.49 structural resistance will target 141.04/149.76 resistance zone next. This will be the preferred case as long as 127.85 near term support holds. However, break of 127.895 will turn focus back to 124.08 key support level.
US Yields Rise On FOMC Minutes
Market movers today
Markets will keep an eye on the EU summit in Brussels where focus remains on the Brexit negotiations. Furthermore, migration and reforms to deepen the EMU - where progress during the June summit was miniscule - will also be on the agenda today.
A range of second tier data is also due out, with the US Philly Fed index for October and UK retail sales data for September, which markets tend to pay attention to, despite it being a relatively poor indicator of private consumption developments. In the Scandi countries, Swedish Valueguard property prices and unemployment for September are being released (see next page).
Selected market news
Overall, we do not think there was any major news in the FOMC minutes, see below. Yet, subsequent price action suggests speculation of a somewhat softer rhetoric, with US yields edging higher, thereby contributing to a further stall in the risk rebound. Less impressive earnings reports and renewed focus on the US's hawkish stance towards China have also contributed to sending most major Asian equity indices into the 'red' this morning.
As expected, the FOMC minutes revealed a central bank on track to deliver rate hikes until the 'neutral' 3% is reached (probably in June 2019 after hikes in both December-18 and March-19). After that, monetary policy will be more 'stop and go' depending on how the economy and markets are doing, but 'a substantial majority' expect policy to turn contractionary. There were no discussions about the target for the balance sheet (i.e. when QT ends) or the future monetary policy framework (although a couple of FOMC members thought it would be good ' to hold a periodic and systematic review of' the monetary policy framework). The minutes showed that ' almost all' considered it appropriate to remove the phrase stating policy ' remains accommodative' , because the removal would not signal a policy change while waiting would give a false sense of the certainty as to the actual level of the neutral rate. Finally, the minutes did not give any indications that the board had been influenced by the recent critique from President Trump.
As expected, there was no withdrawal agreement at yesterday's Brexit working dinner (negotiations broke down on Sunday). The EU leaders also said that the possible extraordinary EU summit in November is cancelled due to the lack of progress but sources say that it might come back into play if negotiations progress over the coming weeks. The tone was positive though and it did not end like the Salzburg meeting. At the moment, it seems likely that we will have to wait for the EU summit in December before a deal can be signed (and we cannot rule out that we have to wait until January). Our base case is still a decent Brexit, where the UK leaves on orderly terms.
Late last night, US Treasury released its semi-annual currency manipulation report. As expected, China was not labelled a currency manipulator, as it still does not meet the criteria (despite Trump claiming it). Still, the report included very hawkish language against China. It is difficult to see a solution to the trade war/strategic conflict in the short term, as the US economy is strong and China does not want to negotiate under pressure and also seems to be preparing for a long fight. Due to monetary policy divergence, we expect CNY to weaken further and forecast USD/CNY in 7.20 in 12M.