Sample Category Title
Forex Technical Analysis: EUR/USD, USD/JPY, GBP/USD
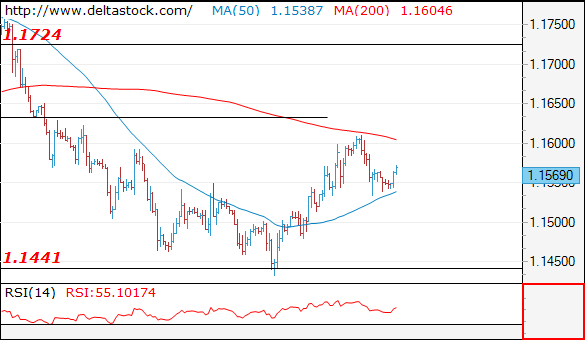
EUR/USD
Current level - 1.1569
I believe, that current dip is a minor pullback and should be limited above 1.1510, followed by another attempt higher, towards 1.1640. Intraday allow a dip to 1.1510 area.
| Resistance | Support | ||
| intraday | intraweek | intraday | intraweek |
| 1.1640 | 1.1835 | 1.1510 | 1.1300 |
| 1.1720 | 1.2010 | 1.1440 | 1.1100 |
USD/JPY
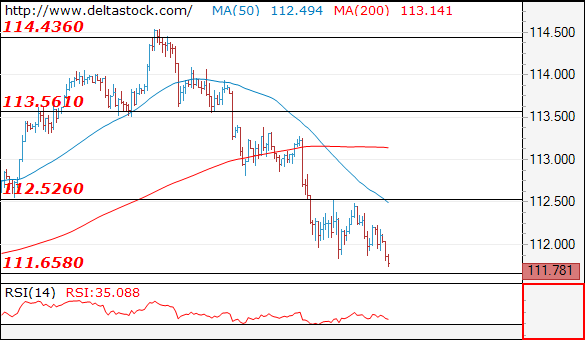
Current level - 111.78
My outlook is counter-trend against 111.65, for a reversal and climb towards 112.50 resistance. An eventual break lower will challenge 110.40.
| Resistance | Support | ||
| intraday | intraweek | intraday | intraweek |
| 112.50 | 114.40 | 111.65 | 111.65 |
| 113.50 | 114.40 | 111.40 | 110.40 |
GBP/USD
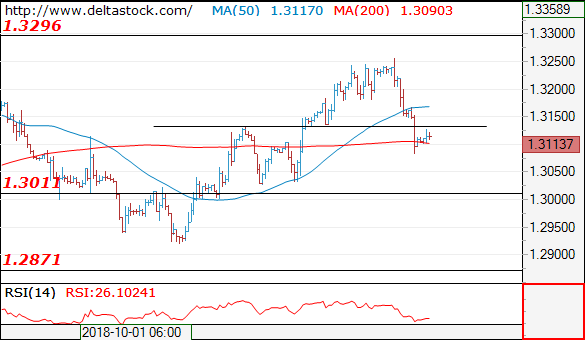
Current level - 1.3113
A reversal has been confirmed at 1.3260 and the bias is already bearish, for a slide towards 1.3010, en route to 1.2870 area. Key hurdle on the upside is projected at 1.3180.
| Resistance | Support | ||
| intraday | intraweek | intraday | intraweek |
| 1.3180 | 1.3440 | 1.3010 | 1.2570 |
| 1.3295 | 1.3440 | 1.2870 | 1.2570 |
XAUUSD Intraday Analysis
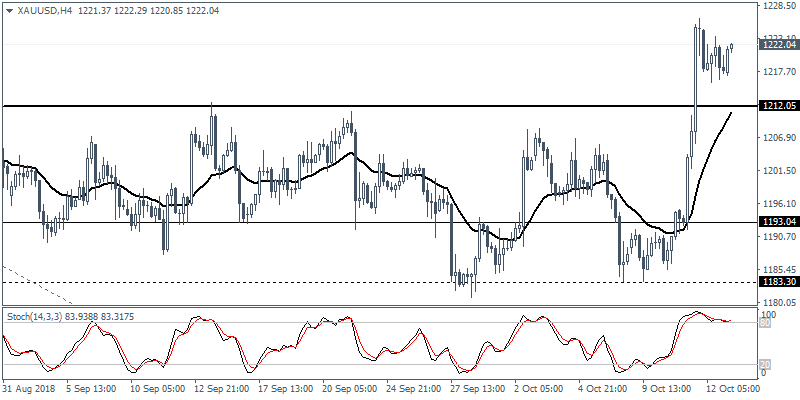
XAUUSD (1222.02): Gold prices look to have finally broken out from the flat price action last week. After breaching the resistance level at 1212.05, gold prices seem settled to post further gains. Watch for a potential bullish flag pattern being formed. This could potentially indicate further strong gains to come. To the downside, gold prices are at risk of posting a more substantial correction. This could push the price of the precious metal down to the support at 1212.05.
GBPUSD Intraday Analysis
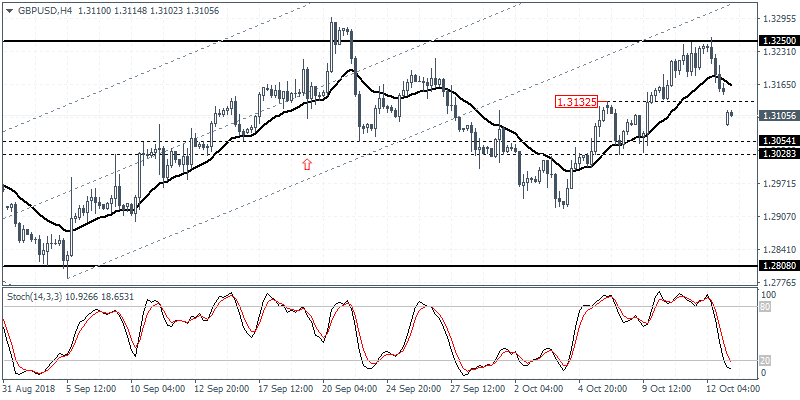
GBPUSD (1.3105): The GBPUSD extended gains strongly off the support at 1.3054 to test the resistance level at 1.3250. As previously noted, the rebound off the resistance level pushed the GBPUSD lower on the day on Friday. The immediate support is seen at 1.3132 which failed to hold the declines. We now expect the cable to fall back to the previous support level at 1.3054 - 1.3028.
EURUSD Intraday Analysis
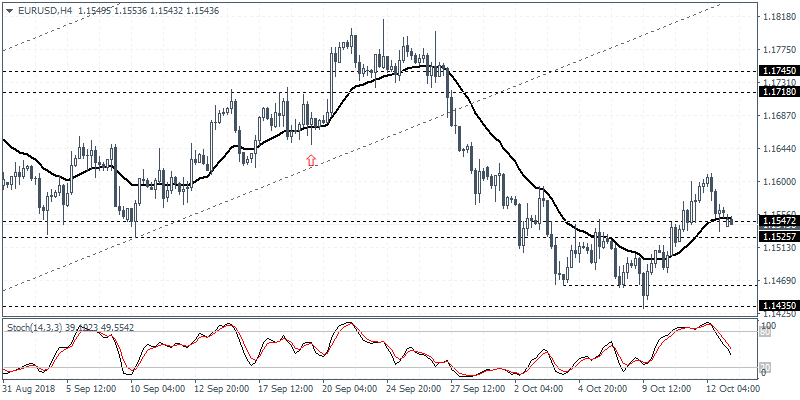
EURUSD (1.1543): The EURUSD currency pair was seen easing back, giving up some of the gains on Friday. Price action looks comfortably settled above the recently breached resistance level of 1.1540. If support is established here, we expect the gains to push the EURUSD currency pair higher in the near term. The next main resistance level is seen at 1.1718. However, this can be achieved if the euro can post a strong reversal and break past the previous highs established at 1.1607.
U.S. Retail Sales Expected To Rise
The U.S. Dollar index managed to post recovery as price action turned slightly bullish on Friday. However, the price was contained within Thursday's range.
The German final inflation report showed an unchanged print as consumer prices rose 0.4% on the month. The Eurozone's industrial production numbers rose 1.0%, beating estimates of a 0.4% increase.
Data on Friday showed a mixed picture for the U.S. Import prices in the United States jumped 0.5% in September. Export prices remained unchanged. On a year over year basis, both import and export prices remained broadly unchanged.
Consumer confidence fell slightly in October, data from the University of Michigan showed on Friday. The British pound gapped lower on Monday. The decline came amid news from EU's chief Brexit negotiator Michel Barnier's comments that despite negotiations, some key issues remained. The euro was also seen gapping lower at today's open.
Economic data for the day ahead is expected to remain mostly quiet during the European trading session. The NY trading session will see the release of the retail sales report.
Headline retail sales are expected to rise 0.6% on the month, while core retail sales are forecast to increase by 0.4%. The Empire State Manufacturing Index data later follow this. Economists expect activity to rise to 20.4 on the index.
EURUSD Outlook: Pullback Found Footstep But Limited Upside Prospect Seen On Weak Daily Techs
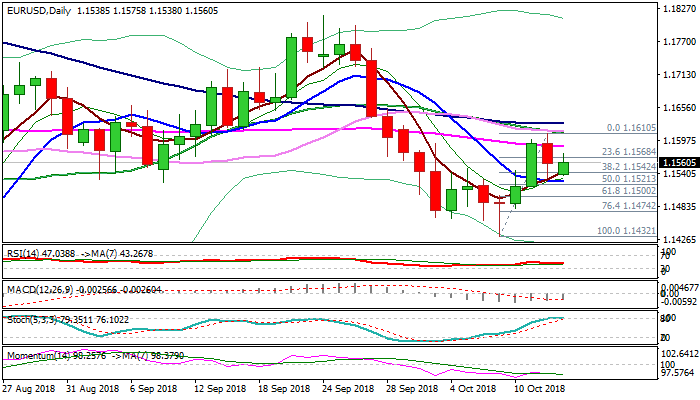
The Euro extended weakness in early Monday’s trading, following Friday’s close in red, but dip found footstep at 1.1538 (just below daily cloud base / Fibo 38.2% of 1.1432/1.1610 upleg).
Profit-taking after strong rally last Wed/Thu was so far seen as corrective action, as pullback failed to clearly break below daily cloud and fresh recovery attacks daily cloud top (1.1574).
Close above cloud is needed to revive bullish bias, however, plethora of MA barriers which lays ahead, marks significant obstacles, starting with 55SMA (1.1587), then converged 20/30SMA’s / Friday’s top (1.1610/13) and 100SMA (1.1626).
Break through these barriers is needed to signal continuation of recovery leg from 1.1432 (09 Oct spike low).
On the other side, daily techs remain weak and warn of fresh weakness, as bearish momentum continues to strengthen and slow stochastic turned sideways on the border of overbought zone, warning of reversal.
Negative scenario, requires close below daily cloud to generate negative signal for extension through 10SMA (1.1526) towards next pivotal support at 1.1500 (round-figure / Fibo 61.8% of 1.1432/1.1610 upleg).
Neutral near-term tone could be expected while the price holds within daily cloud.
Res: 1.1574, 1.1587, 1.1613, 1.1626
Sup: 1.1545, 1.1538, 1.1526, 1.1500
Global Markets At Threat To Further Downward Pressure
While stock markets are at threat to resuming their fall from last week, the initial movements on Monday do not suggest a widespread global reaction to the developments around the disappearance of a Saudi Arabian journalist. It appears that global markets are still at threat to further downward pressure, but not that the potential of a new geopolitical risk element will add to the current magnitude of risks that are facing global markets.
It goes without saying that a 7% decline in any stock market will never make for a favourable headline, but I wouldn’t rule out the potential of Saudi Arabian markets recovering these losses if tensions do not further escalate after the comments made over the weekend.
Investors are likely at this stage monitoring if any more narrative from influential figures such as the Trump Administration comes out before deciding what might possibly happen next within financial markets.
Such a circumstance would risk adding to an external environment that is already challenging towards investors who become hesitant to take on risk.
The most recent report that the Turkish President and Saudi authorities have agreed between them to open a formal investigation over this development does suggest a market-friendly outcome over the near-term, providing an explanation why the Tadawul Index is up over 2% at time of writing and also why global markets have not reacted that much to this development.
USDJPY Breaks Key Technical Support
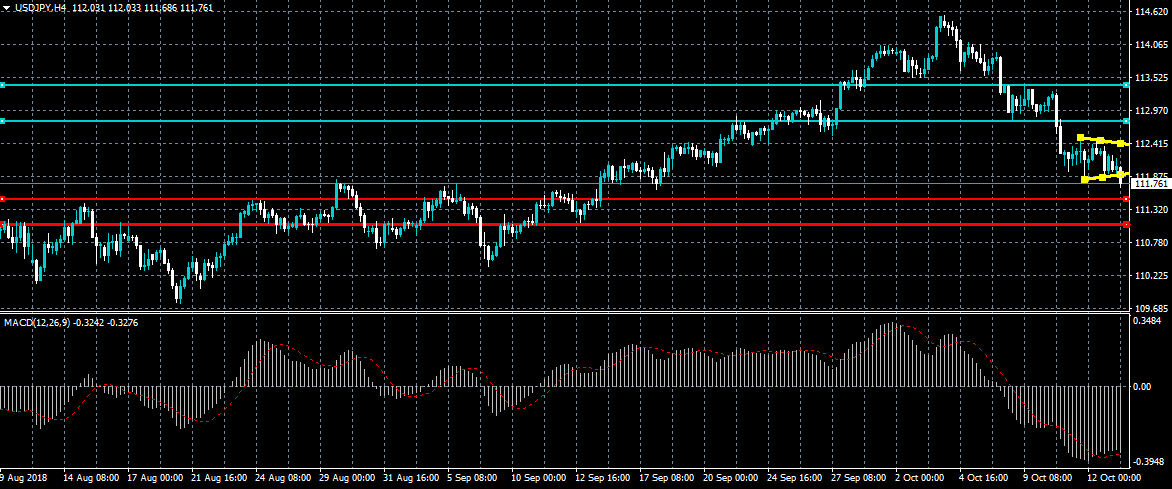
The US dollar has fallen below the key 111.80 support level against the Japanese yen, as the well-defined symmetrical triangle pattern broke to the downside. The USDJPY pair is likely to remain under heavy technical selling pressure while trading below the 111.80 level. The USDJPY pair will likely be impacted by the direction of US equity markets and the release of US Retail Sales data later today.
The USDJPY pair is strongly bearish while trading below the 111.80 level, key support is now found at the 111.40 and 111.10 levels.
If the USDJPY pair trades above the 111.80 level, buyers may test towards 112.00 and 112.55 resistance levels.
EURUSD Attempting To Lift From Key Support
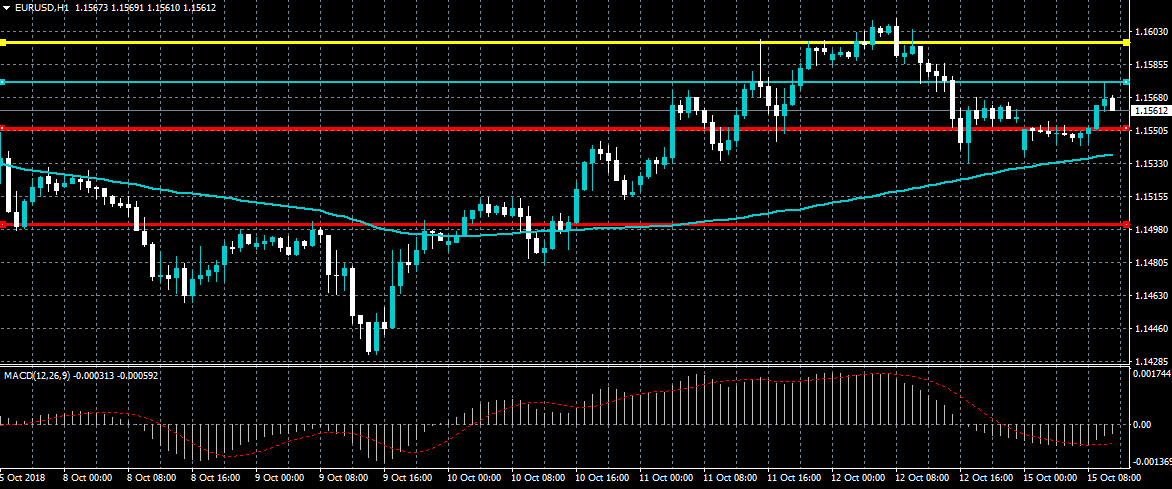
The euro currency is attempting to move away from the key 1.1553 level against the US dollar, after starting the new trading week under bearish pressure. If EURUSD buyers can breach the 1.1570 resistance level, further bullish advancement towards the 1.1600 level appears likely. Technical rejection from current levels opens up the possibility that a bearish head and shoulders pattern may be forming.
The EURUSD pair is only intraday bullish while trading above the 1.1553 level, key technical resistance is found at the 1.1570 and 1.1600 levels.
If EURUSD sellers can move price below the 1.1553 level, key technical support is found at the 1.1530 and 1.1500 levels.
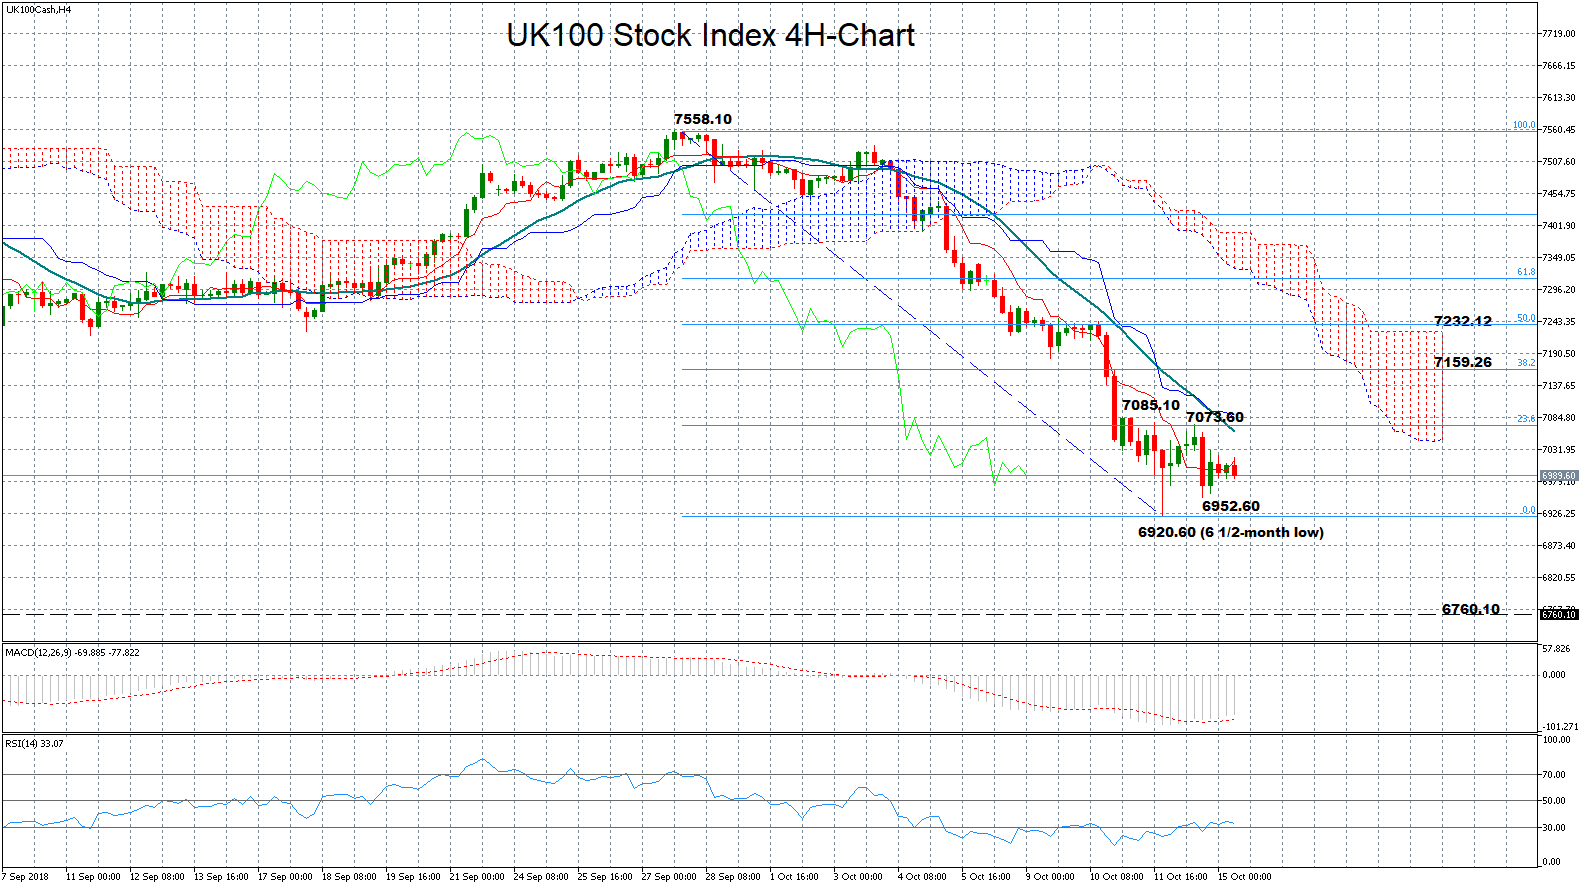
UK100 Stock Index Struggles Near 6 ½-Month Lows, Risk Skewed To The Downside
UK100 stock index (FTSE 100) has been under severe pressure over the past two weeks, tumbling to a 6 ½-month low of 6920.60 last Thursday. While the MACD and the RSI have somewhat improved in the four-hour chart, with the former gaining strength above its red signal line and the latter inching above its 30 oversold threshold, chances for downside corrections remain high as both indicators continue to hold well into the bearish territory; the MACD far below zero and the RSI well under 50.
If bears retake control, Friday’s low of 6952.60 could come first into view before attention turns down to the 6920.60 bottom. However, if negative momentum persists below that trough, all eyes will turn to the 14-month low of 6760.10 printed on March 25. In case that fails too, another barrier is expected to come at 6643.50, where the price posted a strong rebound in December 2016.
On the flip side, a reversal to the upside could see resistance between 7073.60 and 7085.10, taken from the highs printed the previous two sessions. That is slightly above the 23.6% Fibonacci of the donwleg from 7558.10 to 6920.60 which is also where the 20-period moving average currently stands. Any close above that zone could shift the focus towards the 38.2% Fibonacci of 7159.26. A bigger challenge, though, is expected to come around the 50% Fibonacci of 7232.12 as any beat at this level,which halted bearish corrections in September as well, could trigger further upside movements, bringing the neutral picture back into play.