

Sample Category Title
GBP/USD Facing Key Resistance Near 1.3100
Key Highlights
- The British Pound corrected higher, but it failed to hold gains above 1.3100 against the US Dollar.
- There was a failed attempt to break a bearish trend line with current resistance at 1.3095 on the 4-hours chart of GBP/USD.
- The Euro Zone Sentix Investor Confidence in Oct 2018 declined from 12.0 to 11.4.
- Today, the NFIB Business Optimism Index for Sep 2018 will be released, which is forecasted to increase to 108.9.
GBPUSD Technical Analysis
After trading as low as 1.2921, the British Pound started an upside correction against the US Dollar. The GBP/USD pair climbed above the 1.3000 and 1.3050 levels, but it failed to hold gains above 1.3100.
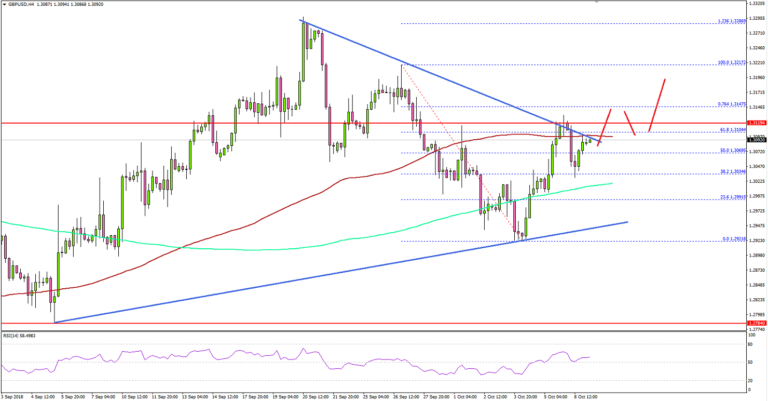
Looking at the 4-hours chart, the pair recovered nicely above the 1.3050 resistance and the 50% Fib retracement level of the last drop from the 1.3217 high to 1.2921 low.
The pair even broke the 200 simple moving average (green, 4-hours) and 1.3075. However, the pair struggled to settle above the 1.3100-1.3110 resistance area. There was also a failed attempt to break a bearish trend line with current resistance at 1.3095.
The pair was rejected from the 61.8% Fib retracement level of the last drop from the 1.3217 high to 1.2921 low. It moved down once again, but there is a good support formed near 1.3000. If the pair fails to stay above 1.3000, it could decline towards a connecting bullish trend line with support at 1.2940.
On the upside, the pair has to settle above the trend line, 1.3100, and the 100 simple moving average (red, 4-hours) to gain bullish momentum towards 1.3150 and 1.3200 in the coming days.
On the other hand, the EUR/USD pair remained under a lot of pressure as it fell below the 1.1500 support level. The next major support on the downside awaits at 1.1420.
Economic Releases to Watch Today
- US NFIB Business Optimism Index Sep 2018 – Forecast 108.9, versus 108.8 previous.
- US IBD/TIPP Economic Optimism Index for Oct 2018 (MoM) – Forecast 54.6, versus 55.7 previous.
- Germany’s Trade Balance for August 2018 – Forecast €16.4B, versus €15.8B previous.
USDJPY – Declined On Sell Off, Eyes 112.86 Level
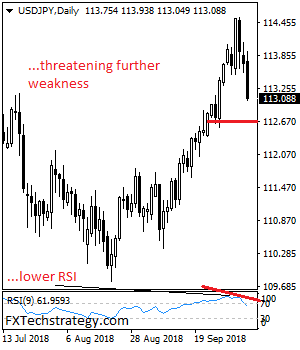
USDJPY declined on sell off during Monday trading session. It now eyes more weakness towards the 113.00/112.86 zone. On the downside, support lies at the 112.50 level where a break will aim at the 112.00 level. A cut through here will turn focus to the 111.50 level and lower towards the 111.00 level. Resistance comes in at 113.50 level. Above here opens the door for more strength towards the 114.00 level. Further out, we envisage a possible move towards the 114.50 level. Further out, resistance resides at the 115.00 level with a turn above here aiming at the 115.50 level. On the whole, USDJPY faces further downside pressure on sell off.
Noisy Markets
Noisy Markets
The headline noise has been deafening and showing few signs of abating. In Asia focus will be squarely on equity sentiment even more with the Yuan under pressure as US/China tensions are set to escalate this week. US Secretary of State Michael Pompeo cited “fundamental disagreement” with China’s foreign minister after meetings, while a senior Treasury official suggested that the US is concerned about the recent depreciation in China’s currency and is monitoring developments. This should provide enough noise to wake the dead. But I think the real focus will fall on how US Treasuries Yields carry through in the context of the broader risk environment. But the market remains understandably brittle with US/China tension in the fore, EU stress over the budget and fiscal targets; and soaring US treasury yields that have caught the market complete flatfooted and have forced a repricing of the markets overly pessimistic view of Fed policy for 2019 through 2020.
However, Treasury markets reopen on Tuesday and after a tumultuous start to the month, it’s not going to get much more comfortable for bond investors as there is a significant amount of supply this week: USD230bn of Treasuries will be up for auction. Give the sizable number of bonds on sale, its unlikely bond trader had the stomach to go into this week’s auction owning to much inventory, so this too could have contributed to the recent Treasury sell-off
Asia Equity Markets
Equity markets have been trading poorly since US yields breached multi-year levels of resistance last Wednesday and continue to do so despite stimulus efforts by the Pboc, as China returned from its Golden Week holiday and played catch up to last week’s global equity weakness. The massive near-term tail risk is that traders are back on US-China watch. A possible train wreck on the negotiation front could completely derail global markets. We should not underestimate the potentially destabilizing effect from a weaker Yuan will have on regional markets if not global markets. Indeed a path no one wants to go down.
Oil markets
Oil initially traded heavy by the prospect of the US potentially permitting waivers to countries who are seeking to continue the purchase of Iranian crude after the November 4 deadline.
But looking at last weeks data net longs in both crude benchmarks were slashed as investors’ confidence sagged not to untypically after printing multi-year highs as last weeks Inventory reports, and the ratification of NAFTA suggest supply-side risks dropped slightly.
Investors were clearly in profit-taking mode, and with the US potentially permitting waivers to countries who are seeking to continue the purchase of Iranian crude after the November 4 compounded by Saudi Arabia repeatedly stating that they had indeed boosted their output to offset the loss of Iranian barrels. They provided more than sufficient inputs to trigger a sell-off especially when the market was leaning in that direction.
However, prices reversed in the morning NY session after Canada’s biggest oil refinery, Saint John, was hit by an explosion and fire early Monday. The refinery processes about 300k barrels per day.
Traders remain on hurricane watch as some O & G platform in the Gulf of Mexico have shuttered as Tropical Storm Michael, which is expected to morph into a category 2 or 3 hurricane rips through the Gulf and will smash into the Florida panhandle midweek. Gulf oil insiders are reporting that 19% of Gulf oil production and about 11% of the natural-gas output have gone offline.
While St Johns and Gulf supply disruptions will provide a near-term fillip to prompt WTI, however, based on the dwindling global spare capacity narrative this rally could continue. And we don’t have to look much further than China ‘s policy efforts to bolster that view. Over the medium to long-term, it’s not too much of a stretch to assume more policy easing measures and increased infrastructure spending after China economy expanded at the slowest pace on record last month. So, for oil markets and commodities in general, the positive effects of China’s monetary and fiscal ambition could be significant.
But this brings us full circle to this week’s US inventory reports, while the markets were not overly sensitive to last weeks increases, given the focus is shifting to a more buoyant near-term supply narrative, there will be highted market focus.
Gold Markets
The markets again found themselves neck deep on oversold territory and with more chatter this morning about central bank purchases, the market is mulling. However, we’re still looking for confirmation on that Central Bank storyline. Update later but please call for any comments.
Currencies
Japanese Yen
With US yields providing a modicum of support but the sagging global equity markets have all but drained the life out the USDJPY battery. JPY traders were getting antsy as the 114 level was an immovable force given the sour equity market sentiment. When you start factoring in the negative implication of a move to 3.5-3.75 in UST’s its difficult to make a positive case for equity valuations. But the prospect of US-China discussion likely to deteriorate further in coming weeks, the 113.50 support gave way like a hot knife through butter,and with the markets on risk alert mode, no one is overly eager to get back on the USDJPY bullish bus.
Malaysian Ringgit
China and US Treasuries remain the primary focus for EM FX, and with US-China negotiation going nowhere, we should see more upside pressure on the regional currencies.
Eco Data 10/9/18
[php_everywhere instance="1"]
EURGBP Looking Lower – Elliott Wave Analysis
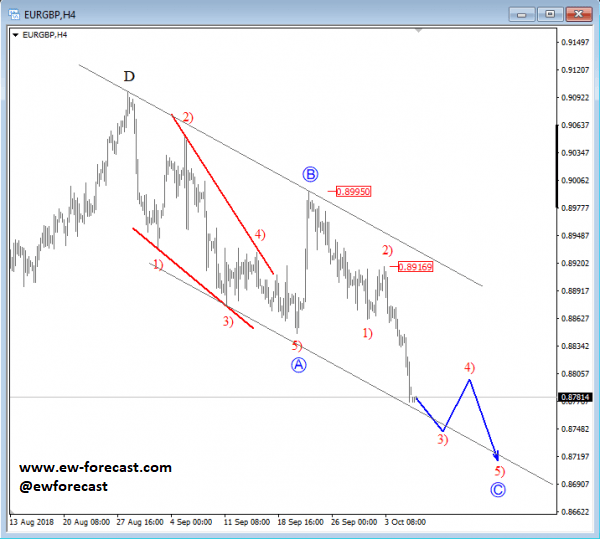
EURGBP can be unfolding a three-wave reversal from the highs, with recently completed leg B and now we see leg C in progress. Leg C is an impulse, meaning a five-wave drop must be seen, before we can regard it as completed. We are currently tracking sub-wave 3) of C, which can look for support near the lower channel line.
EURGBP, 4h
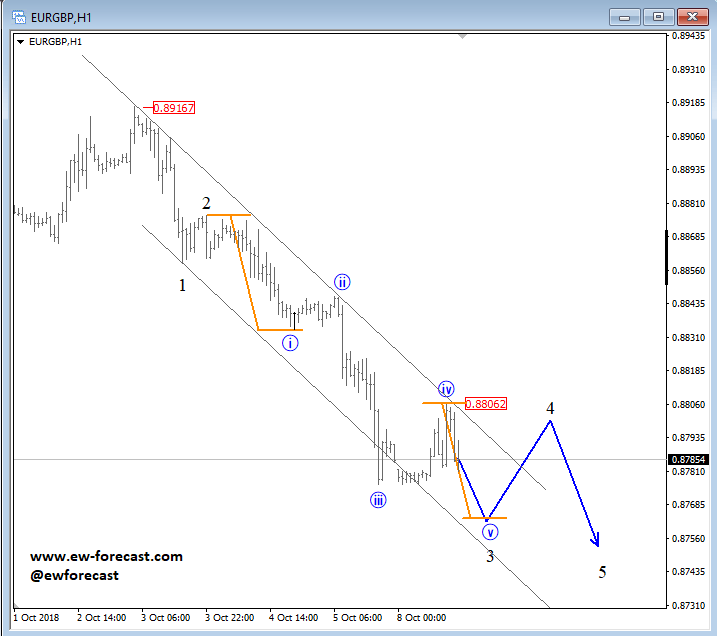
On intra-day chart of EURGBP we have a closer look at wave 3) which is unfolding a five-wave drop from the 0.8917 seing high. Some support can be seen for sub-wave v of 3 near the lower channel line from where a temporary wave 4 correction can follow. Later we may see resistance for a wave 4 correction near the 0.8806 level.
EURGBP, 1h
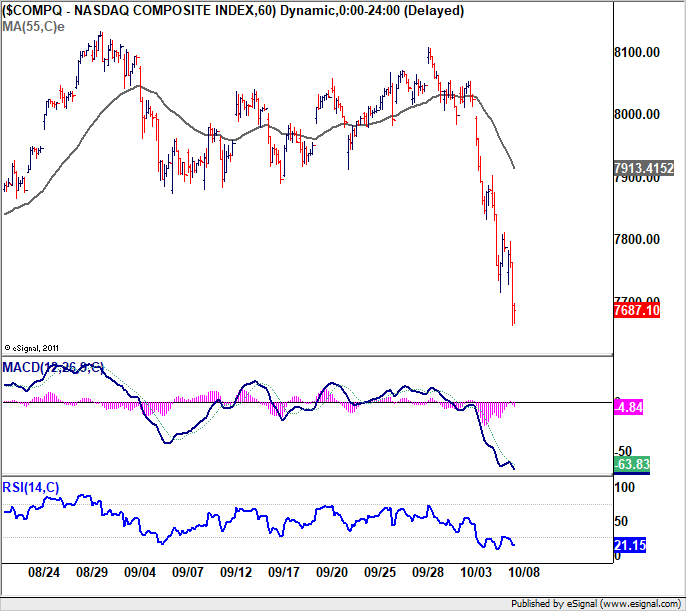
Yen rally extends as risk aversion intensifies, with deep selloff in NASDAQ
Yen rally accelerates as risk aversion intensifies in US session. At the time of writing, DOW is down -0.44%, S&P 500 down -0.47%. NASDAQ is suffering serious selling and is down -1.22%. In Europe, DAX led the decline and closed down -1.36%, CAC down -1.10% and FTSE down -1.16%.
In the currency markets, Australian Dollar is the second strongest one, New Zealand Dollar the third. Sterling is the weakest, followed by Euro and Canadian.
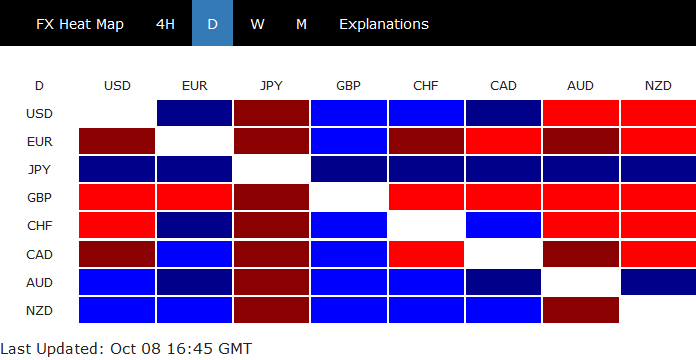
We see some reports blaming Asia and China for risk aversion. But this is apparently wrong and ignorant considering the lack of weakness in Aussie and Kiwi. Italy is the problem for Europe as Italian yield rose 0.1602 to 3.566. Germany 10 year yield, on the other hand dropped -0.0442 to 0.533. One might argue that Swiss Franc is steady. But the Franc has proven itself recently that it showed more reactions to emerging markets like Turkey and Argentina rather than Italy. Another factor for risk version is of course US yield.
Having said that, we don't mean it's problem free for Asia. Given that Chinese Yuan suffers some renewed pressure today, it's just a matter of time when China's stock break through that critical 2700 handle, or USD/CNH breaking 7. It's reported that the US Treasury is concerned with Yuan depreciation. When the US is in an "easy to win" trade war with China, it's the most reasonable outcome for China's economy to get hurt and the exchange rate reflect that fundamental and falls. And further depreciation in Yuan will without a doubt drags down Chinese stocks.
British Pound Loses Ground as Dollar Remains Strong
GBP/USD has posted losses on Monday, recovering much of the losses seen on Friday. In the North American session, the pair is trading at 1.3062, down 0.42% on the day. It’s a quiet start on the release front. In the UK, the sole event is BRC Retail Sales. In the U.S, banks are closed for Columbus Day and there are no U.S indicators on the schedule. On Tuesday, the BoE releases its Financial Policy Committee Statement.
Will Britain and the European Union reach an agreement over Brexit? Despite months of gloom and fears of a hard Brexit, there is renewed optimism in London and Brussels that a deal can be reached before the March 2019 deadline. There are reports that the sides have made progress on a range of issues, including the Irish border and continued EU access to London’s clearinghouses. EU leaders will hold a crucial meeting on October 17, with Brexit one of the key items on the agenda. If there are tangible signs of progress on Brexit ahead of the summit, the pound could move higher.
U.S employment numbers were a mix on Friday. Nonfarm payrolls dropped sharply to 134 thousand, its smallest gain in a year. This was well short of the estimate of 185 thousand. However, one factor in the disappointing release is Hurricane Florence, which led to many employees being unable to report to work during the storm. Wages appear headed in the right direction – Average Hourly Earnings gained 0.3% in September, and are up 2.9% on a year-to-year basis. The unemployment rate fell to 3.7%, its lowest level since 1969. The mixed numbers put a slight damper on the odds of a December hike, which dipped to 76% after the job releases, down from 80% prior to the releases. A December rate hike would be the fourth this year, with the Fed expected to raise rates another three times in 2019.
EURGBP Outlook: Narrow Consolidation to Precede Fresh Weakness as Euro Comes Under Fresh Pressure on Italy
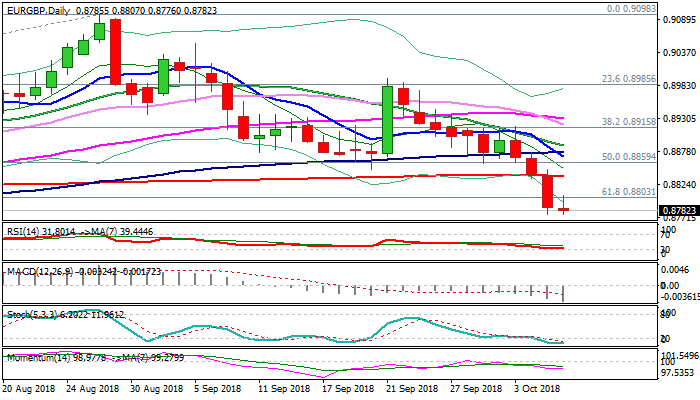
The cross consolidates above new 3 1/2 month low at 0.8776 on Monday, with limited upside attempts, as Euro comes under fresh pressure on Italian budget concerns.
Steep fall in past two week's when the pair was down 2.1%, with break below weekly cloud and close below pivotal support at 0.8803 (Fibo 61.8% of 0.8620/0.9098 ascend), adds to negative outlook.
Daily MA's in full bearish setup and rising bearish momentum, further support negative scenario.
Close below 0.8803 Fibo support would expose 0.8733 (Fibo 76.4%) and 0.8697/0.8680 (29 May/26 Apr troughs) in extension.
Broken 200SMA (0.8837) is expected to cap upticks and maintain bearish bias.
Res: 0.8807; 0.8837; 0.8869; 0.8887
Sup: 0.8776; 0.8733; 0.8680; 0.8620
USDJPY Outlook: Fresh Safe-Haven Demand Lifts Yen; Key 200WMA Support Under Pressure
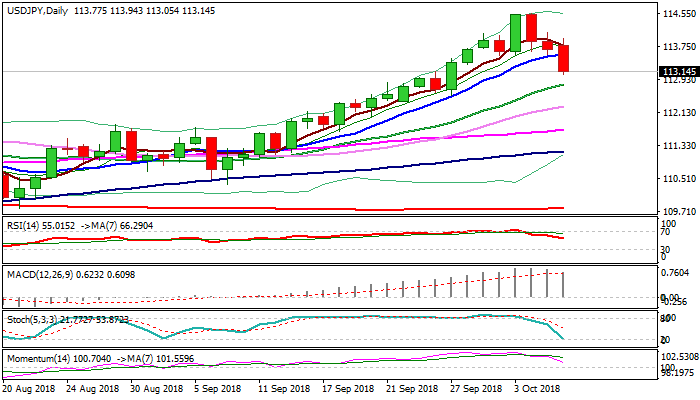
The accelerated lower on Monday and cracked key support – weekly 200SMA (113.15), increasing pressure on next pivotal supports at 112.95 (Fibo 38.2% of 110.38/114.54) and 112.83 (rising 20SMA).
Increasing safe-haven demand on rising US yields inflated yen, signaling that USDJPY's pullback from 114.54 high could extend further.
Close below 200WMA would generate bearish signal, which would be reinforced on loss of 112.95/83 pivots and open way for extension towards 112.46 (Fibo 50%/daily Kijun-sen) and 112.27 (rising 30SMA).
Formation of Doji reversal pattern on weekly chart adds to negative outlook, along with reversal of weekly slow stochastic from overbought zone.
Res: 113.54; 113.94; 114.10; 114.54
Sup: 112.95; 112.83; 112.46; 112.27
XAU/USD – Gold Slides as Treasury Bonds Climb
Gold has posted sharp losses gains in the Monday session. In North American trade, the spot price for one ounce of gold is $1187.14, down 1.38% on the day. U.S banks are closed for Columbus Day and there are no U.S events on the schedule.
Nonfarm payrolls for September may have missed its target, but the Federal Reserve remains on track to raise interest rates in December, with the CME Group pegging a December hike at 76%. The anticipation of further rate hikes in December and throughout 2019 has boosted the yield on U.S treasury bills, while at the same time weighing heavily on gold prices. On Friday, 10-year treasury bonds climbed to their highest level since 2011, and if yields continue to climb during the week, gold’s downward spiral could continue.
In the U.S, the labor market remains hot, but September’s numbers were mixed. Nonfarm payrolls dropped sharply to 134 thousand, its smallest gain in a year. This was well short of the estimate of 185 thousand. However, one factor in the disappointing release is Hurricane Florence, which led to many employees being unable to report to work during the storm. Wages appear headed in the right direction – Average Hourly Earnings gained 0.3% in September, and are up 2.9% on a year-to-year basis. The unemployment rate fell to 3.7%, its lowest level since 1969. The mixed numbers put a slight damper on the odds of a December hike, which dipped to 76% after the job releases, down from 80% prior to the releases. A December rate hike would be the fourth this year, with the Fed expected to raise rates another three times in 2019.