Sample Category Title
AUDJPY in Sharp Sell-Off in Short-Term; Approaches 2-Year Loow
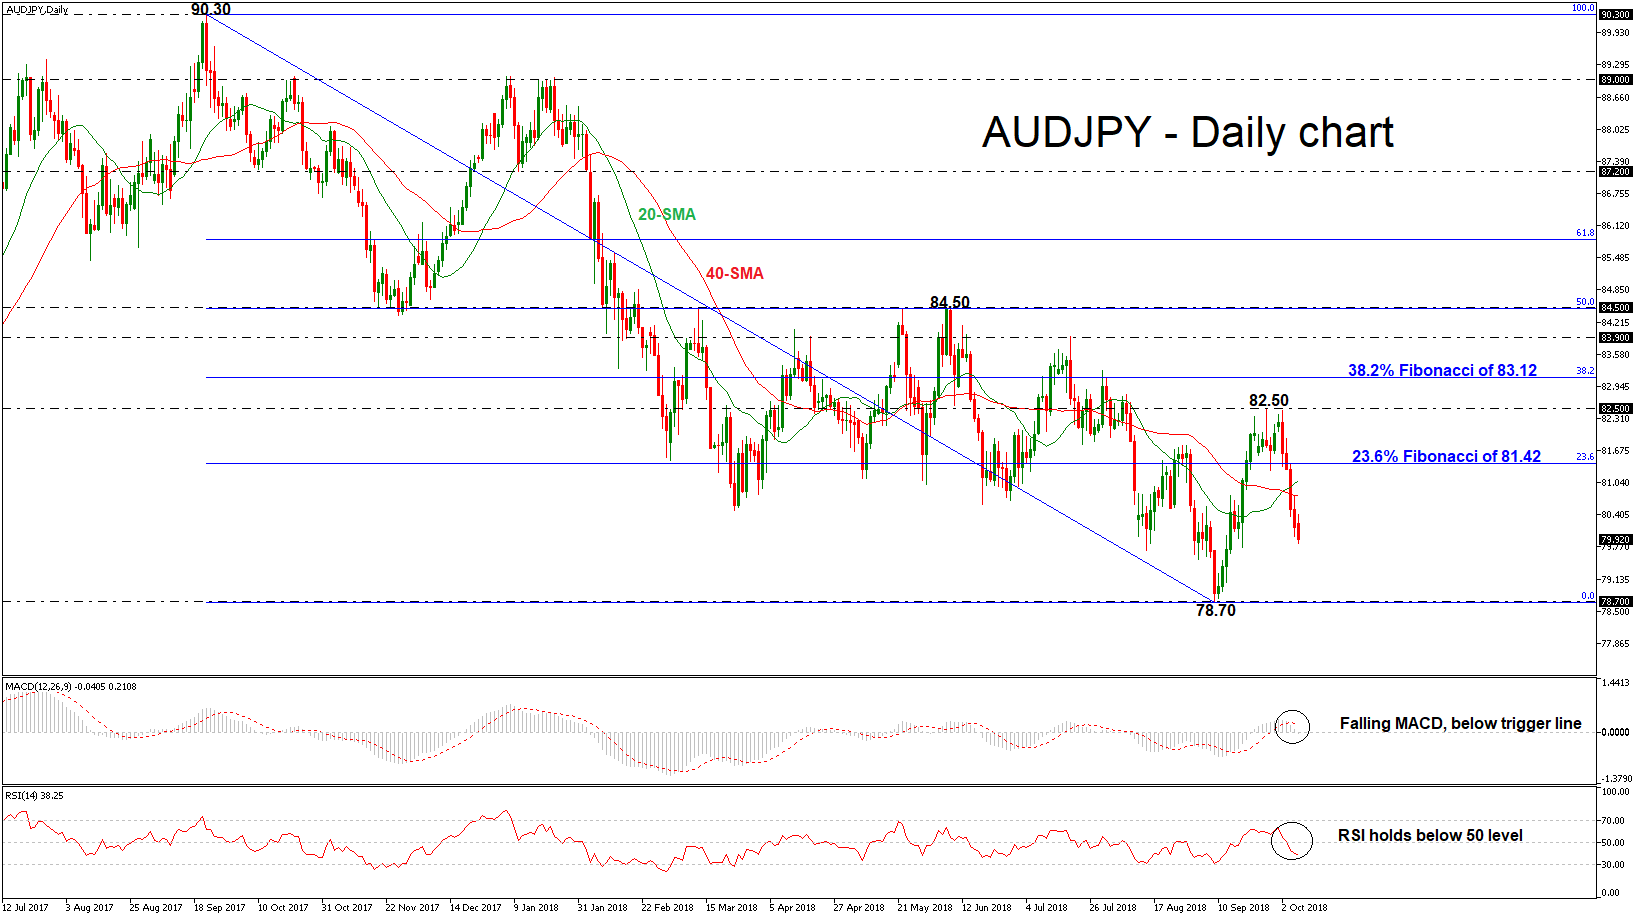
AUDJPY has come under sharp selling pressure following the pullback on the 82.50 resistance level in the preceding week. Moreover, despite that, the 20- and 40-simple moving averages (SMAs) posted a bullish crossover, the price slipped below them and continues the negative movement. Looking at daily oscillators though, there are signs that the latest pullback may continue for a while longer. The RSI turned downwards after it hit resistance near its 70 line, while the MACD is moving below the trigger line.
A further aggressive sell-off could drive the price until the 78.70 support level, reached on September 7, and if this level is breached, it may set the stage for more declines. A clear break below this level could challenge the 76.72 barrier, taken from the low on November 2016.
On the flip side, a possible jump above the SMAs could meet the area near the 23.6% Fibonacci retracement level of the downleg from 90.30 to 78.70, around 81.42. A move higher from this level could send prices until the 82.50 hurdle before being able to hit the 38.2% Fibonacci of 83.12.
Regarding the medium-term picture, the bearish sentiment deteriorated after the downfall from the 90.30 resistance level and fell towards the almost two-year low of 78.70.
China and South Africa Attract Negative Spotlight of Global Markets
It’s been an interesting start to the new trading week with a number of different markets across the globe suffering weakness.
Headlines range from Chinese stocks getting slammed lower as trading resumed from a week-long holiday, the Euro retreating on the news that the European Commission has expressed concerns about the Italian budget deficit, and the South African Rand declining as much as 1% on reports that South African Finance Minister Nhlanhla Nene has asked President Cyril Ramaphosa to release him from his position. Other risks include the Oil markets behaving sensitively to the headlines that the United States might grant some waivers to Iranian Oil sanctions and attention remaining on Brazil following the first round of the Brazilian election. Let’s also not forget that a number of emerging market currencies across the APAC region resumed their position of pointing lower to begin the new week, while these same currencies might also face risks from developments that the Chinese Yuan has fallen to its lowest level against the Dollar in nearly two months.
All in all the early part of Monday has already showed that the combination of different themes and financial risks for markets could mean that this week is a nervous one for traders.
The largest takeaway due to its standing as the second largest economy in the world will be the movements in Chinese markets today. The latest round of selling in China can’t be dismissed and has resulted in Chinese stocks suffering their worst start to October in a decade. While some of today’s losses in China can be attributed to the market playing “catch-up” to being absent from trading due to a week-long public holiday last week, it can’t be understated that Chinese markets as a whole are under tremendous pressure. The Shanghai Composite Index has lost 23.28% year-to-date at time of writing, which is double the losses seen in the German DAX during the same period at 11.15%.
Away from the brutal headlines that the Shanghai Composite Index lost 3.7% on Monday, the implications that this has on other equity markets across the globe will be what traders are watching next. We have seen a trend in the past where weakness in China has resonated on other global markets, and we did encounter selling throughout the Asian region to begin the week.
The trend of weakness in China has come in spite of the PBoC cutting the RRR requirement for the fourth time in 2018 over the weekend. I wouldn’t say that the latest monetary policy action from the PBoC is the reason behind the selling in China, but it has opened up suggestions that policymakers might be concerned over signs of slowing momentum for the Chinese economy. These concerns can also be seen in the offshore Chinese Yuan, with the USDCNH advancing above 6.90 for the first time in nearly two months.
If the Yuan continues to ease from this point, it does paint a picture of more possible pain for emerging markets across the globe this week.
The initial selling reaction in the South African Rand on reports that its Finance Minister has asked to be sacked will encourage investor caution that South Africa could be in store for another round of political risk. Of course, South Africa is no stranger to political headlines but the initial concern could be that the reaction to the Rand to a possible replacement of its finance minister could be similar to what sparked a severe sell-off back in March 2017.
When you consider that the removal of respected Finance Minister Pravin Gordhan all the way back in March 2017 was part of a wider cabinet reshuffle of the unpopular ex-President Jacob Zuma you can’t really compare the news of then and today so closely. I would instead monitor to see how this report develops before becoming concerned that another Rand slump could be upon us due to internal political risk.
The South African economic calendar for this week is mostly thin in volume when it comes to tier-one releases until Manufacturing Production numbers on Thursday, where economists will be closely looking for signs that the economy could exit its first technical recession since 2009. Away from political developments, I would look to see if the Rand reacts to any global uncertainties, specifically the sharp sell-off in Chinese markets and whether this spreads into other emerging markets.
XAUUSD Outlook: Break Below Daily Cloud is Negative Signal
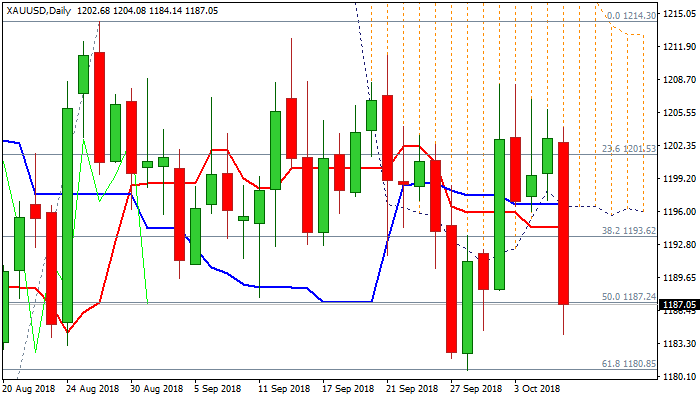
Spot Gold fell 1.3% on Monday on renewed risk appetite as traders increased dollar positions on strong hopes on further US interest rate rises. Fall of Chinese stocks and yuan, as well extension of negative tone into European and US stock markets, boosted the greenback. Gold price returned below thick daily cloud after trading the whole last week within the cloud, generating negative signal. Fresh weakness after repeated failures to regain key barrier at $1214 (28 Aug recovery high) dipped below the mid-point of $1160/$1214 recovery leg, turning near-term focus towards key support at $1180 (Fibo 61.8% of $1160/$1214/28 Sep low), loss of which would risk full retracement of $1160/$1214 recovery). Daily Ichimoku studies turned to full bearish setup, with rising bearish momentum, keeping near-term outlook negative. Broken daily cloud base ($1196) is expected to cap upticks and maintain bearish bias, established after today's fall.
Res: 1194; 1196; 1201; 1208
Sup: 1184; 1180; 1172; 1160
USDJPY Declined On Sell Off, Eyes 112.86 Level
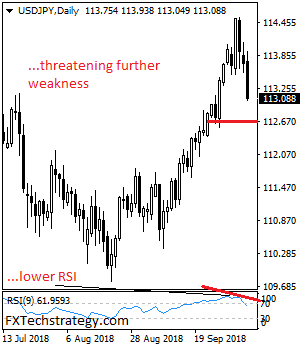
USDJPY declined on sell off during Monday trading session. It now eyes more weakness towards the 113.00/112.86 zone. On the downside, support lies at the 112.50 level where a break will aim at the 112.00 level. A cut through here will turn focus to the 111.50 level and lower towards the 111.00 level. Resistance comes in at 113.50 level. Above here opens the door for more strength towards the 114.00 level. Further out, we envisage a possible move towards the 114.50 level. Further out, resistance resides at the 115.00 level with a turn above here aiming at the 115.50 level. On the whole, USDJPY faces further downside pressure on sell off.
The USD Is Breaking Forward
EURUSD continues retreating. The major currency pair slowed down its decline a little bit last Friday due to rather complicated statistics from the USA, but resumed trading downwards on Monday morning.
So, the USA reported on the labor market in September. The numbers were quite mixed, but there was an objective reason for this: it looks like September slowly becomes a traditional “hurricane month” in the USA, when manufacturing sector or the consumption suffers. Or both.
Last month, the Non-Farm Employment Change in the USA was 134K against the expected reading of 185K. The report says that the tertiary industry was hurt by hurricanes most of all: the employment in restaurants and cafes, hotels, and shops. At the same time, the employment in the manufacturing sector improved. It seems like the bad weather prevented people from going out and making use of the service industry. Remember that the ADP report showed 230K and that’s a terrific number, which was way much better than market expectations.
The Unemployment Rate in the USA decreased from 3.7% in August to 3.9% in September.
The Average Hourly Earnings, the indicator which has recently become speculative due to its volatility, added 0.3% m/m in September, the same as the month before. On YoY, the indicator expanded only by 2.8% after adding 2.9% in August.
Investors weren’t too positive in their response to the numbers: the USD was corrected against the Euro and retreated a bit, but on Monday morning the American currency resumed its attack.
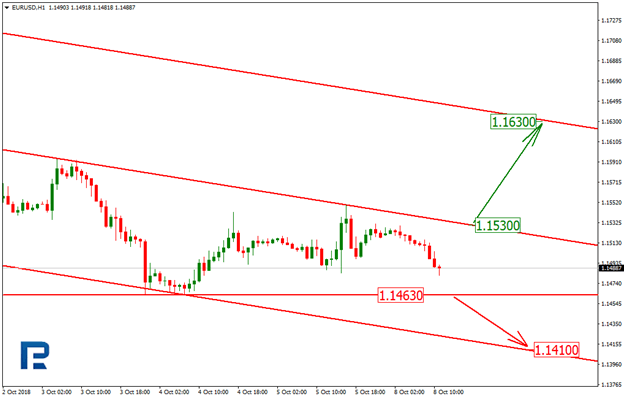
The H1 chart of EURUSD shows that after rebounding from the current channel’s resistance line the pair started a new descending impulse. The closest downside target is the support lien and 1.1410. However, the price may reach this level only after breaking the fractal at 1.1463. At the same time, one should exclude a possibility of a new correctional uptrend, which may start if the instrument breaks the resistance line at 1.1530. The short-term target of this correction may be the resistance level at 1.1630.
Sunset Market Commentary
Markets
With US Treasury markets closed today, the focus was on Europe. Last week’s risk-off sentiment continued with first Asian equity markets and later European equity markets losing ground. China underperformed, returning after a week long holiday. Italy dominated the news again with a hard stance on its budget proposal, causing Italian bonds to plunge. Deputy PM Salvini, alongside French nationalist Marine Le Pen, sneered at the EU for its bureaucracy that pushes budget restrictions and open borders. The EU continues to repeat its intentions to reject the Italian budget proposal. It looks like both Italy and the EU are not backing down, causing serious agitation in financial markets. The Italian 10 year yield prints a multi-year record high (3.58%) and the spread over the German Bund widens back above 300 bps. Safe haven movements were in play. Core bond markets gained ground. The German Bund rallied higher but stabilized around noon. German yields dropped with changes ranging between -2.3 bps (2-yr) and -3.5 bps (10-yr), with the belly outperforming the wings. 10-yr yield spread changes vs Germany widen strongly in the peripheral countries with Italy (+20 bps) and Greece (+18bps) underperforming. Spain (+6bps) and Portugal (+6bps) share the bronze medal.
There was no meaningful data to steer currency trading today. The dollar traded with a positive bias, enjoying a steady flight to safety and brushing aside any of the very soft comments from Fed’s dove Bullard. The China led negative sentiment on Asian markets this morning pushed the yuan lower, before extending losses dramatically even after Chinese closing hours (USD/CNH currently at 6.93). That risk off climate produced some spillover effects to its European counterparts and the euro. Italy’s Salvini’s provoking comments towards the EU and “its enemies – Juncker and Moscovici” and the “speculative” financial markets were no help for the common currency either. Salvini even called upon European voters and said EU elections in May 2019 are a chance to “save” Europe. EUR/USD edged lower throughout the day and is hovering near intraday lows at 1.1465. The yen flourishes in current market conditions, trading at 113.30 USD/JPY.
Apart from some insignificant intraday volatility, the pound’s trajectory was rather uninspiring. After closing below the 0.88 area on Friday following a new squeeze of sterling shorts, EUR/GBP again tested the 0.88 figure in today’s mostly technical driven trade session. If anything, some sobering comments from the UK after last week’s upbeat assessment by EU diplomats of the brexit negotiations might have pushed sterling (temporarily) lower. The next few days will be important for brexit as talks enter into a key phase. Investors probably stay sidelined, hence today’s subdued pound movements. EUR/GBP is changing hands at 0.878, virtually unchanged from Friday’s close. Cable is losing ground as the dollar profits from the current risk off mood. The pair is trading at 1.305.
News Headlines
During an interview Bullard said little to alter its dovish reputation. The Fed governor doesn’t see much inflationary pressure for the US economy. He thinks wage growth is where it should be, downplaying the historical unemployment data, saying they “can’t take as much signal from it as in the past”. In his view, the policy rate doesn’t need to get a lot higher as its already close to neutral.
France’s PM Philippe will present the government’s resignation tomorrow morning. As is the custom in France, a new government will also be led by Philippe and should be appointed by tomorrow evening. President Macron opts for a clean start after Minister Collomb’s resignation last week.
EUR/JPY Mid-Day Outlook
Daily Pivots: (S1) 130.61; (P) 131.01; (R1) 131.43; More....
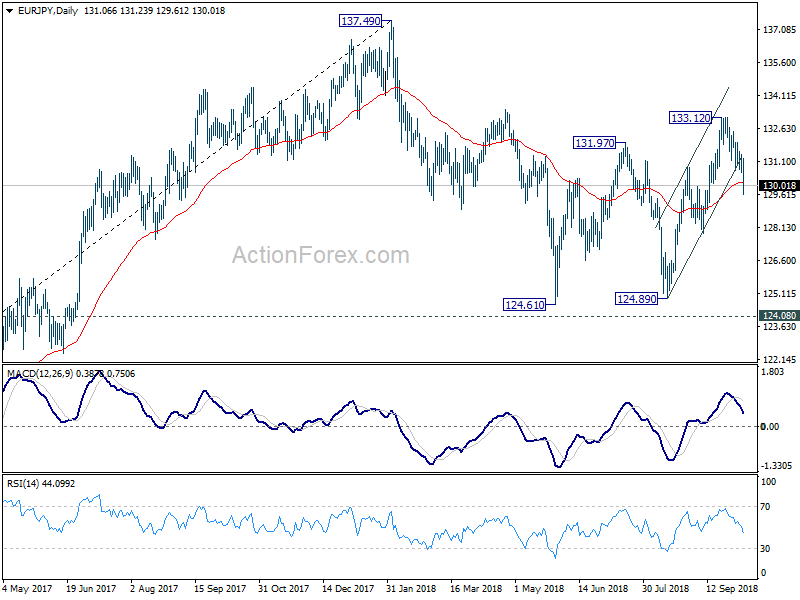
EUR/JPY's decline from 133.12 extends further today and reaches as low as 129.61 so far. The break of 55 day EMA affirms the view that rise from 124.89 has completed. Intraday bias stays on the downside for 127.85 support first. Break will target 124.89 again. On the upside, though, above 131.23 minor resistance will turn bias back to the upside for 133.12 instead.
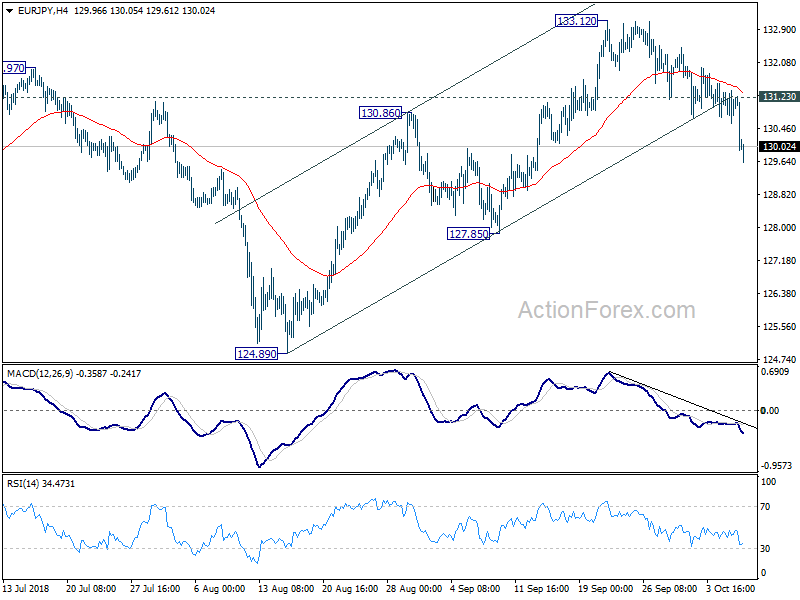
In the bigger picture, current development suggests that EUR/JPY could have defended key support level of 124.08 key resistance turned support. And, the larger up trend from 109.03 (2016 low) is still in progress. Firm break of 137.49 structural resistance will target 141.04/149.76 resistance zone next. This will now be the preferred case as long as 127.85 near term support holds.
USD/JPY Mid-Day Outlook
Daily Pivots: (S1) 113.49; (P) 113.79; (R1) 114.03; More...
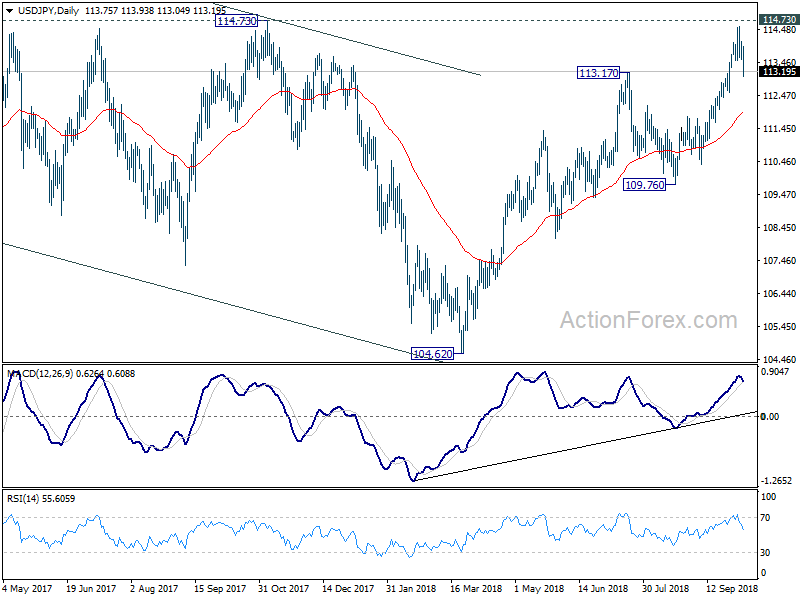
USD/JPY's pull back from 114.54 short term top extended lower and intraday bias is mildly on the downside for 38.2% retracement of 110.37 to 114.54 at 112.94. We'd expect strong support from there to contain downside and bring rebound. On the upside, above 113.55 minor resistance will bring retest on 114.54 and 114.73 key resistance first. However, break of 112.94 will bring deeper fall to 61.8% retracement at 111.96.
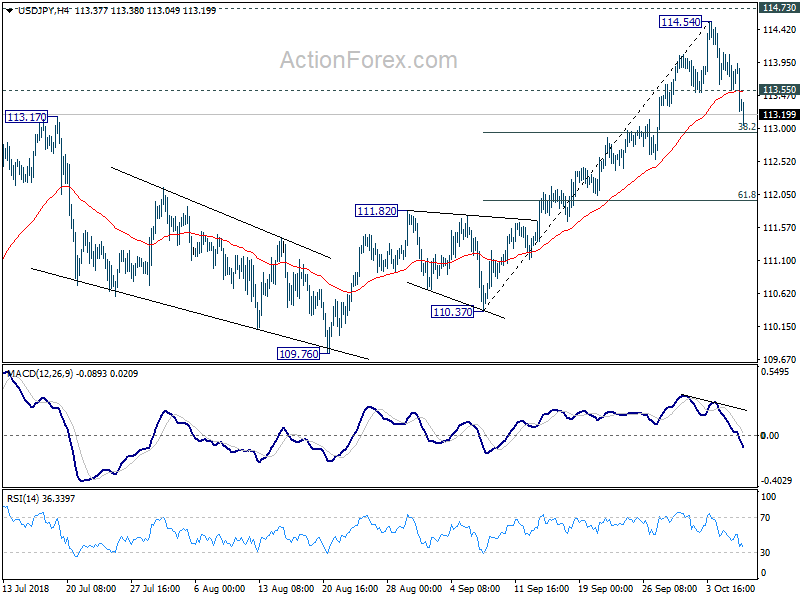
In the bigger picture, corrective fall from 118.65 (2016 high) should have completed with three waves down to 104.62. Decisive break of 114.73 resistance will likely resume whole rally from 98.97 (2016 low) to 100% projection of 98.97 to 118.65 from 104.62 at 124.30, which is reasonably close to 125.85 (2015 high). This will stay as the preferred case as long as 109.76 support holds.
USD/CHF Mid-Day Outlook
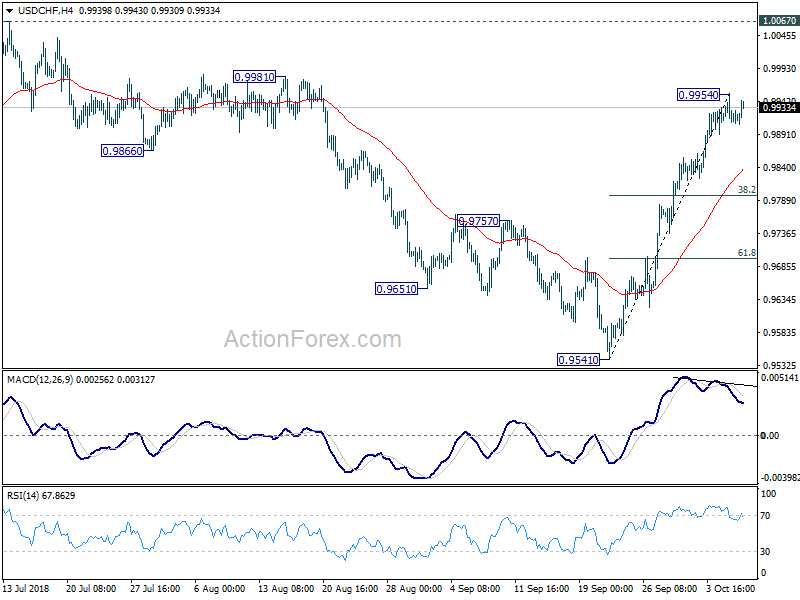
Daily Pivots: (S1) 0.9902; (P) 0.9928; (R1) 0.9947; More...
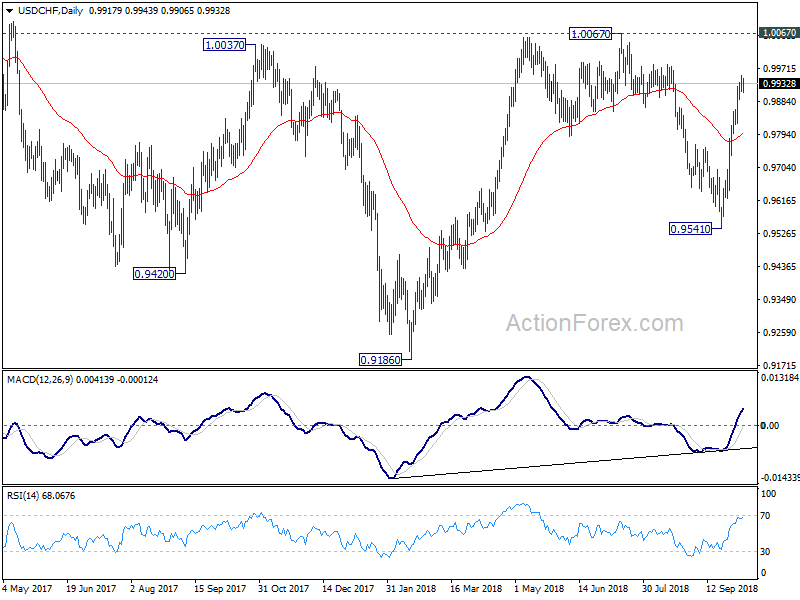
USD/CHF's consolidation from 0.9954 temporary top is in progress and intraday bias stays neutral first. Another fall cannot be ruled out. But downside should be contained by 38.2% retracement of 0.9541 to 0.9954 at 0.9796 to bring rise resumption. On the upside, break of 0.9954 will target 1.0067 resistance next.
In the bigger picture, the pullback from 1.0067 has completed at 0.9541 already. And rise from 0.9186 is likely resuming. Firm break of 1.0067 will pave the way to retest 1.0342 key resistance. We'd be cautious on strong resistance from there to limit upside to bring another medium term fall to extend long term range trading.
GBP/USD Mid-Day Outlook
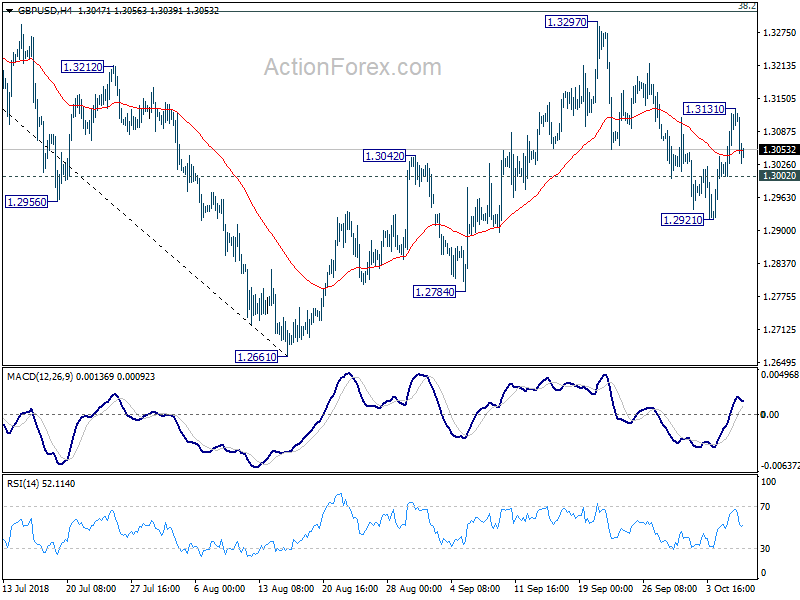
Daily Pivots: (S1) 1.3039; (P) 1.3080; (R1) 1.3157; More...
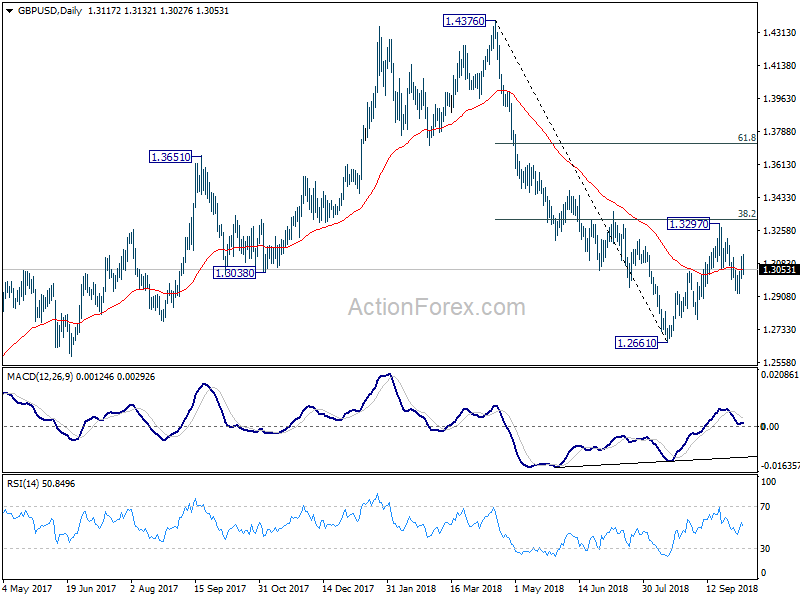
Intraday bias in GBP/USD is turned neutral with today's sharp retreat. Further rise is in favor with 1.3002 minor support intact. Above 1.3131 will target a test on 1.3297 resistance. For now, we'd expect strong resistance from 1.3316 key fibonacci level to limit upside to bring down trend resumption. On the downside, below 1.3002 minor support will turn bias back to the downside for 1.2921 first.
In the bigger picture, whole medium term rebound from 1.1946 (2016 low) should have completed at 1.4376 already, after rejection from 55 month EMA (now at 1.4062). The structure and momentum of the fall from 1.4376 argues that it's resuming long term down trend. And this will be the preferred case as long as 38.2% retracement of 1.4376 to 1.2661 at 1.3316 holds. However, firm break of 1.3316 would bring stronger rebound to 61.8% retracement at 1.3721. And, the eventual depth of the fall from 1.4376, and the chance of hitting 1.1946 low, will depend on the strength of the interim corrective rebound from 1.2661.