Sample Category Title
Italy And China Drag Markets Lower
- Markets lower as we head towards quiet US session;
- China takes a hit after week holiday;
- Italian fiscal concerns drag on Europe.
A bank holiday in the US and Canada on Monday should ensure we see thin trade at the start of the week, with news flow and economic releases from that side of the pond also likely being fairly muted.
Of course we can never account for the Presidents Twitter account which has the ability to cause a wobble all on its own but broadly speaking things are expected to be very quiet. US markets are open but trade is expected to be very thin, while futures are pointing lower again as the recent rise in bond yields weigh on riskier investments.
I don't expect this sell-off to last too long and think it's more a symptom of the aggressiveness of the yield rises, as opposed to real concerns about the prospect for stocks and the economy in a higher interest rate environment. The rise in US yields which has prompted a similar increase in the US dollar – which continues to push higher this morning – was initially triggered by a flurry of strong economic indicators and hawkish comments from Federal Reserve Chairman Jerome Powell and the move still appears to have some legs.
The decline in US futures this morning is also likely being aided by sell-offs in Asia and Europe at the start of the week. Chinese stocks have been shocked back to life after the week long holiday, with the Shanghai Composite ending its first day back almost 4% lower, on the back of last week's broad declines and despite the 100 basis point reserve requirement ratio (RRR) cut, intended to support the economy in the face of a trade war with the US.
The cut to the RRR will likely only draw increased criticism from the US, who has accused the country of manipulating its currency to keep it artificially weak. The cut though has not weakened the currency too much although it does continue to creep slowly towards the seven handle against the dollar that many traders view as being psychologically significant.
The sell-off in Asia may have been enough to weigh on risk appetite in Europe but as it turns out it doesn't need much help, with the coalition Italian government's determination to collide with Brussels over its budget plans causing more than enough of a stir in the region. Italian 10-year yields have spiked again today with the spread between it and Germany's surging above 300 basis points and to the highest in five years.
This is also taking its toll on Italian equity markets which are clearly leading the losses today, with banks taking a bit hit in the process due to the still close links between the two. Italy hasn't been the only casualty though, with the rest of Europe being caught up in the losses and Greece in particular being drawn into the firing line, with it seen as being among the most vulnerable to renewed aversion to European debt markets.
Risk-Off As Italian Budget Crisis Prevails
Italy is back under the spotlight
The Italian budget situation took centre stage on Monday morning as traders return from the weekend. The FTSE MIB gave up another 1.80% to reach 19,962 points, its lowest level since April 2017. In the bond market, the country’s sovereign yields accelerated Friday’s upward trend. The 2-year yields climbed 19bps to 1.54%, while the 10-year one added 20bps to 2.83%. Against suche a backdrop, the single currency erased 0.30% and returned below the 1.15 threshold, while the dollar rose across the board. As usual during risk-off reaction, safe haven currencies were the only one able to hold ground. USD/CHF consolidates around 0.9920, while USD/JPY holds ground around 113.70.
Italian Deputy Prime Minister Di Maio continues to ignore markets’ punishment and holds its ground as EU deadline approaches. In an interview with Corriere della Sera, Di Maio anticipated that EU citizens would express their dissatisfaction with the Union austerity plans as he declared “There will be such an earthquake in all countries against the austerity that the rules will change the day after the elections (i.e. EU 2019 parliamentary election).” The cost of insuring exposure to Italian debt were roughly unchanged on Monday, with the 5-year CDS stabilising at 221bps.
We believe that the downside is limited in EUR/USD. Indeed, Italy has made its point against austerity and we believe that the EU got it. Italy already showed that there is room for negotiation as Economy minister Tria said las week that Italy plans to cut budget deficit starting in 2020. Obviously, it will requires efforts from both sides but middle can be found. EUR/USD has erased Thursday’s gains and is currently heading towards the closest support that stands at 1.1464 (low from October 4).
USDJPY Outlook: Fresh Safe-Haven Demand Lifts Yen, Key 200WMA Support Under Pressure
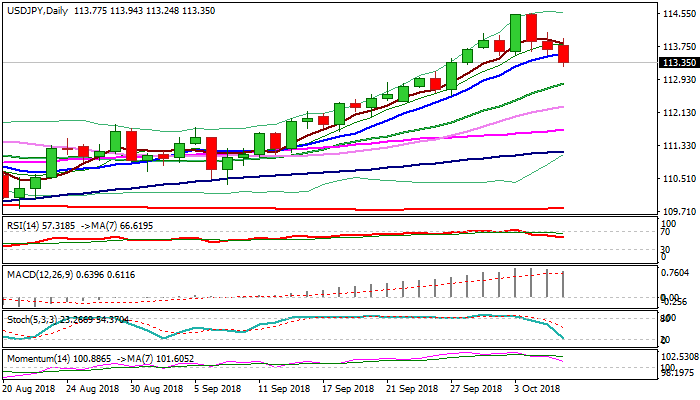
The dollar remains in red against yen and accelerated further down on Monday, extending losses of past two days after broader rally stalled at 114.54, where a double-top was left.
Today's fresh weakness broke below initial support at 113.52 (higher base, reinforced by rising 10SMA) and cracked broken Fibo resistance at 113.30 (61.8% of 118.66/104.63), pressuring key support at 113.15 (weekly 200SMA).
Renewed safe-haven demand on ongoing US/China trade conflict and negative global growth outlook could further pressure dollar.
Weakening momentum studies on daily chart support scenario, which needs close below 200WMA to generate bearish signal for deeper correction of 110.38/114.54 ascend and confirm top at 114.54.
Bears could extend towards next strong supports at 112.95/83 (Fibo 38.2% of 110.38/114.54 / rising 20SMA).
Res: 113.56, 114.10, 114.54, 114.73
Sup: 113.24, 113.15, 112.95, 112.83
The Analytical Overview Of The Main Currency Pairs
The EUR/USD currency pair
Technical indicators of the currency pair:
Prev Open: 1.15147
Open: 1.15225
% chg. over the last day: +0.08
Day's range: 1.14951 – 1.15049
52 wk range: 1.0571 – 1.2557
On Friday, there was a variety of trends on the EUR/USD currency pair. Mixed data on the US labor market for September were published. Thus, the number of people employed in the nonfarm sector slowed down to 134K, while investors expected a value of 185K. The growth of average hourly wages met market expectations and counted to 0.3% (m/m). Meanwhile, the unemployment rate fell from 3.9% to 3.7%. At the moment, the key support and resistance levels are: 1.14800 and 1.15200, respectively. Positions should be opened from these marks.
The news feed on the economy of the Eurozone and the US is calm.
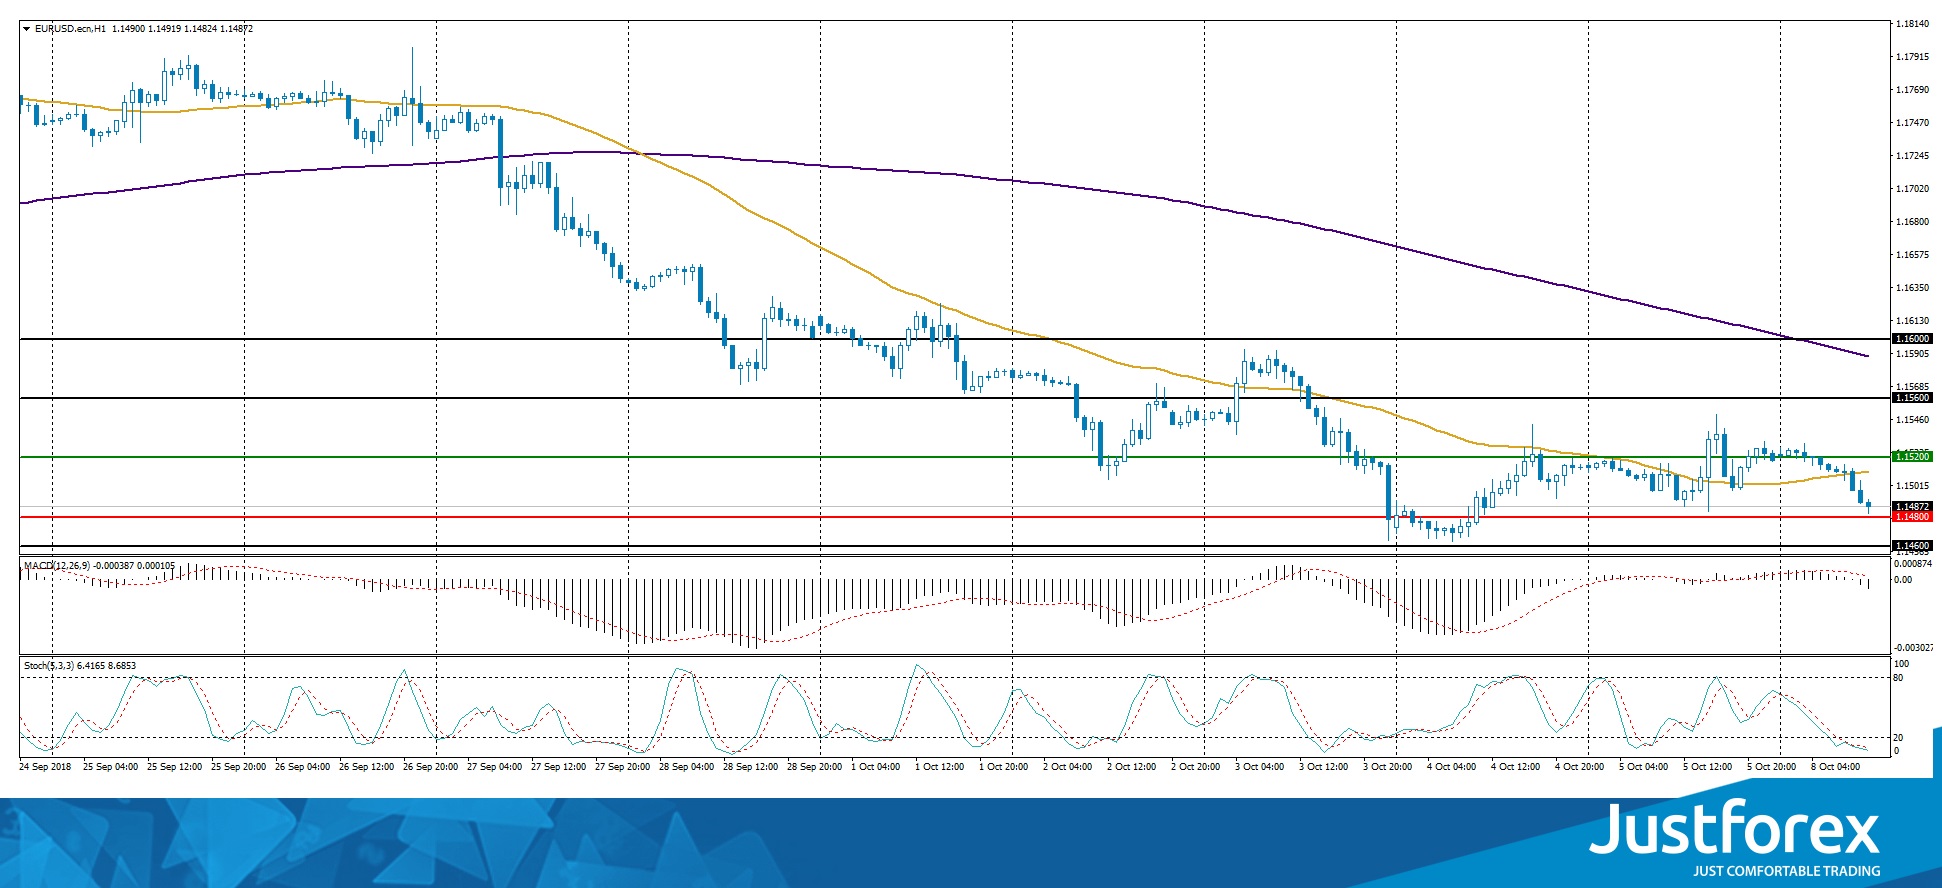
The price has fixed below 50 MA and 200 MA, which indicates the power of sellers.
The MACD histogram has moved into the negative zone, which signals the bearish sentiment.
The Stochastic Oscillator is in the oversold zone, the %K line is crossing the %D line. There are no accurate signals.
Trading recommendations
Support levels: 1.14800, 1.14400
Resistance levels: 1.15200, 1.15600, 1.16000
If the price fixes above the resistance level of 1.15200, the EUR/USD quotes are expected to grow. The movement is tending to 1.15600-1.16000.
An alternative may be a further decrease in the EUR/USD currency pair to the level of 1.14400-1.14200.
The GBP/USD currency pair
Technical indicators of the currency pair:
Prev Open: 1.30190
Open: 1.31169
% chg. over the last day: +0.79
Day's range: 1.30677 – 1.30843
52 wk range: 1.2361 – 1.4345
On Friday, aggressive purchases were observed on the GBP/USD currency pair. The British pound strengthened against the US dollar after statements by the EU's chief negotiator, Michel Barnier, that they were ready to offer the UK a “unique” deal that was better and more beneficial than the previous one. At the moment, quotes are declining. The key support and resistance levels are: 1.30500 and 1.31000, respectively. Positions should be opened from these marks.
Today, the news feed on the UK economy is calm.
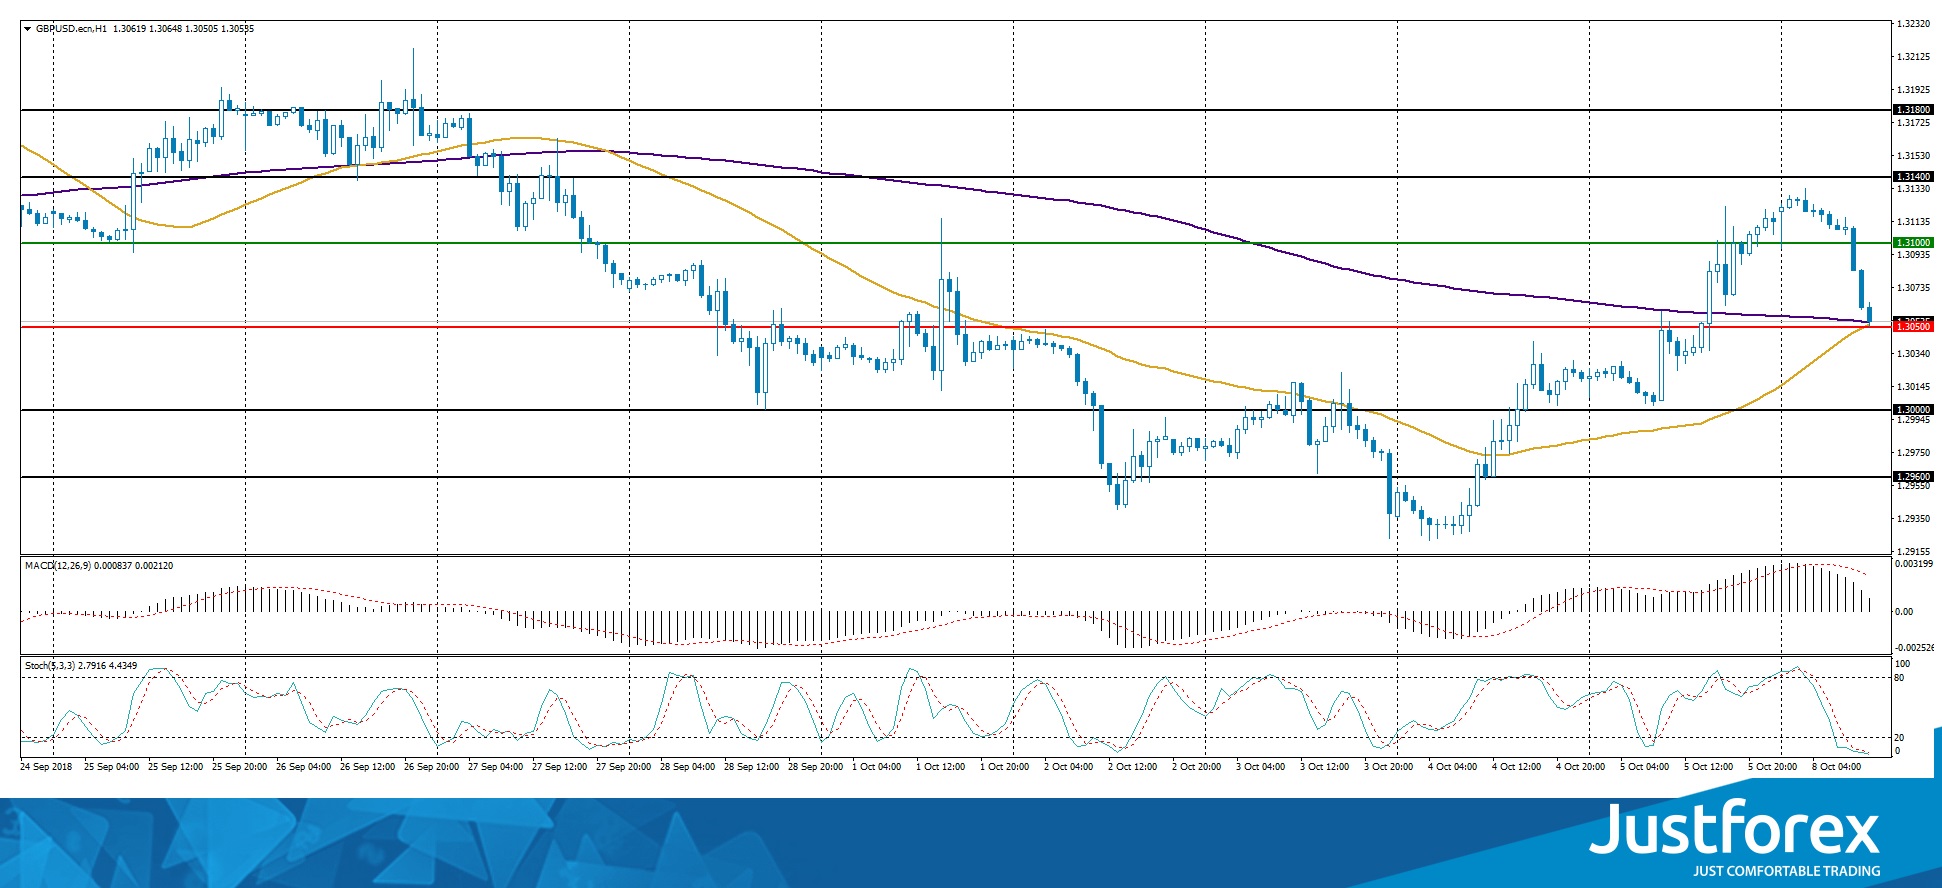
Indicators do not send accurate signals: 50 MA has crossed 200 MA.
The MACD histogram is in the positive zone, but below the signal line, which gives a weak signal to buy GBP/USD.
The Stochastic Oscillator is in the oversold zone, the %K line is crossing the %D line. There are no accurate signals.
Trading recommendations
Support levels: 1.30500, 1.30000, 1.29600
Resistance levels: 1.31000, 1.31400, 1.31800
If the price fixes below the “mirror” support of 1.30500, it is necessary to consider sales of GBP/USD. The movement is tending to the round level of 1.30000.
An alternative may be the growth of the GBP/USD currency pair to the level of 1.31000-1.31300.
The USD/CAD currency pair
Technical indicators of the currency pair:
Prev Open: 1.29207
Open: 1.29441
% chg. over the last day: +0.09
Day's range: 1.29905 – 1.29910
52 wk range: 1.2059 – 1.3795
The USD/CAD currency pair continues to show positive dynamics. During Friday’s and today's trading, the growth of quotes have counted to more than 80 points. At the moment, the trading instrument is testing the round level of 1.30000. The key support is the 1.29600 mark. Positions should be opened from these marks. The USD/CAD currency pair has the potential for further growth.
The news feed on the economy of Canada is calm.
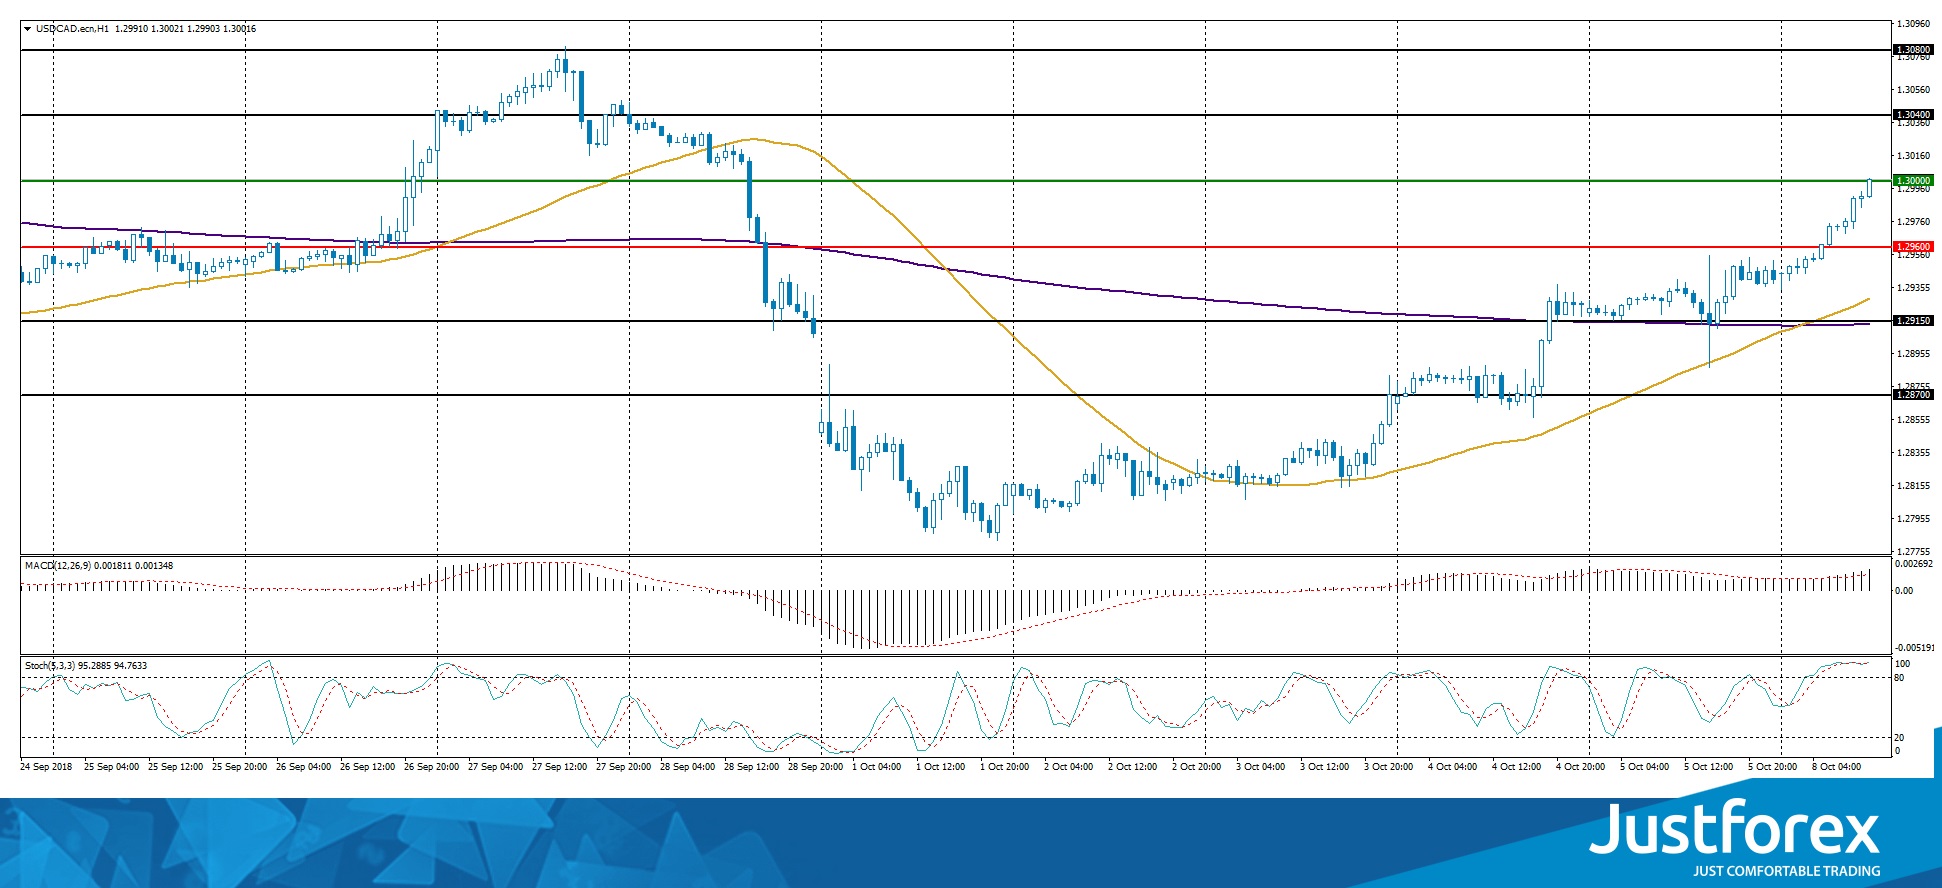
The price has fixed above 50 MA and 200 MA, which indicates the power of buyers.
The MACD histogram is in the positive zone, above the signal line, which gives a strong signal to buy USD/CAD.
The Stochastic Oscillator is in the overbought zone, the %K line is crossing the %D line. There are no accurate signals.
Trading recommendations
Support levels: 1.29600, 1.29150, 1.28700
Resistance levels: 1.30000, 1.30400, 1.30800
If the price fixes above the resistance level of 1.30000, further growth of the USD/CAD currency pair is expected. The movement is tending to 1.30400-1.30600.
Alternative option. If the price fixes below 1.29600, it is necessary to consider sales of USD/CAD. The movement is tending to 1.29200-1.29000.
The USD/JPY currency pair
Technical indicators of the currency pair:
Prev Open: 113.868
Open: 113.780
% chg. over the last day: -0.18
Day's range: 113.703– 113.746
52 wk range: 104.56 – 114.74
There is a variety of trends on the USD/JPY currency pair. Investors expect additional drivers. At the moment, the trading instrument is moving in flat. Local support and resistance levels are: 113.600 and 113.900, respectively. Positions should be opened from these marks. In the near future, technical correction of the USD/JPY quotes after a prolonged rally is not excluded.
The news feed on the economy of Japan is quite calm.
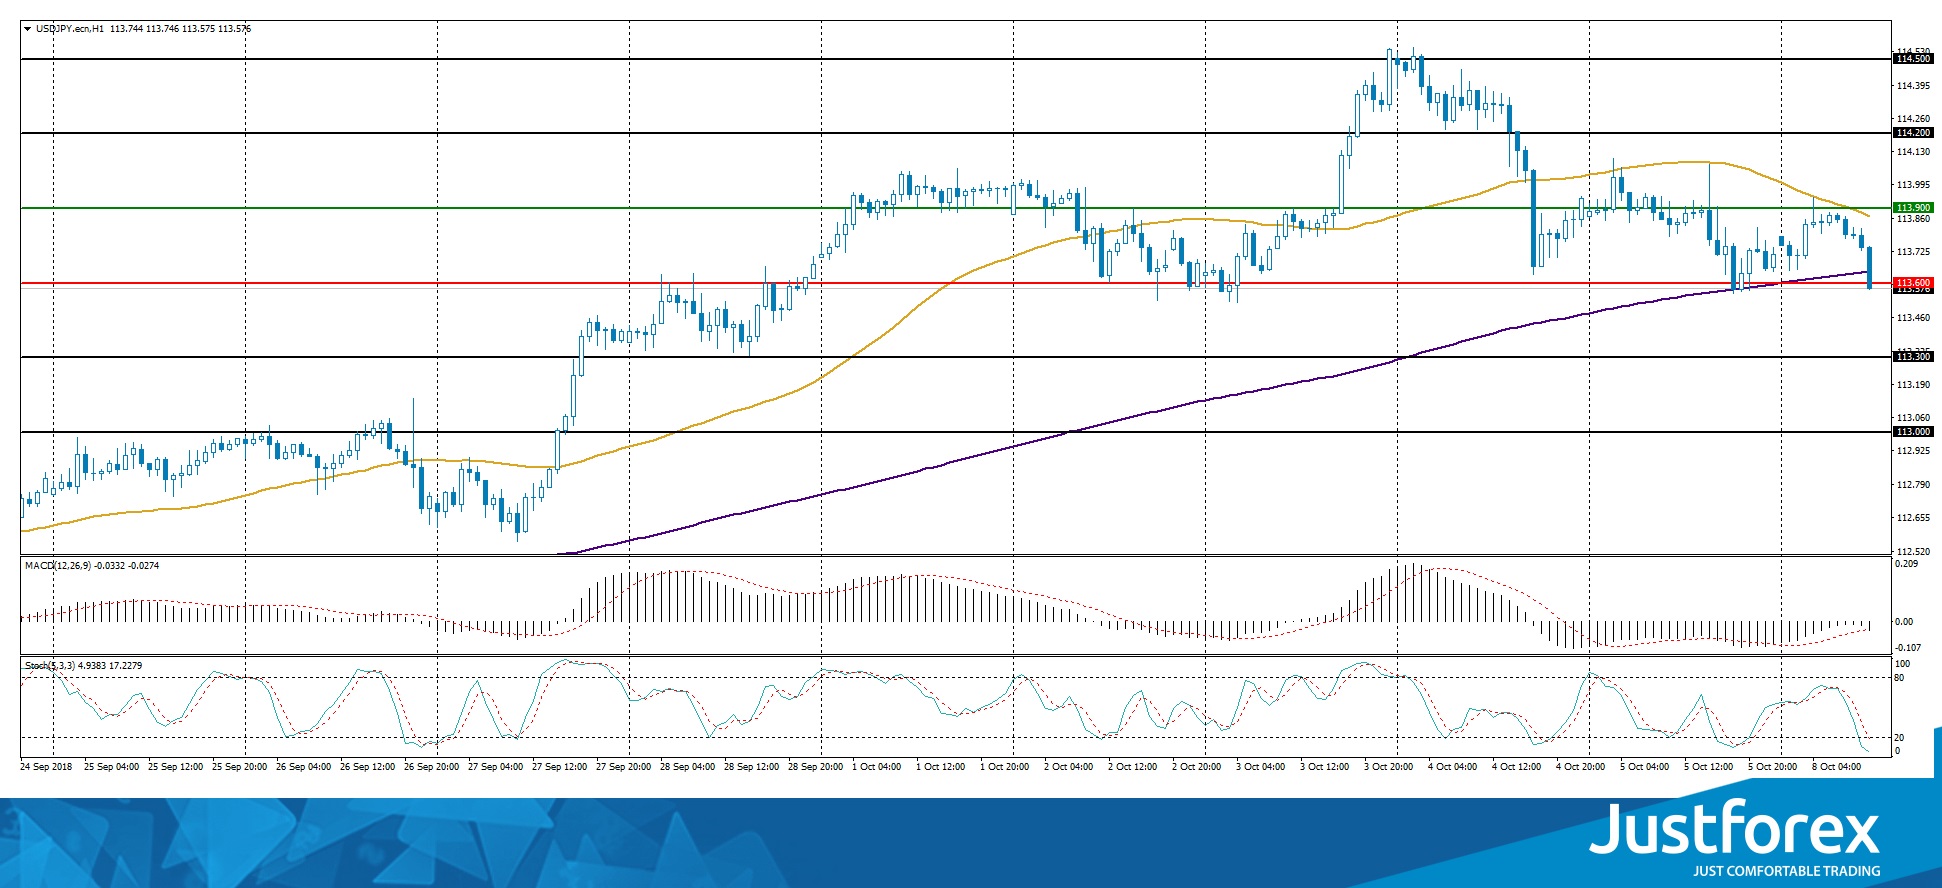
Indicators do not give accurate signals. Price has crossed 200 MA.
The MACD histogram is in the negative zone and continues to decline, which indicates the bearish sentiment.
Stochastic Oscillator is in the oversold zone, the %K line is below the %D line, which gives a weak signal to sell USD/JPY.
Trading recommendations
Support levels: 113.600, 113.300, 113.000
Resistance levels: 113.900, 114.200, 114.500
If the price fixes below the support level of 113.600, the USD/JPY currency pair is expected to decline. The movement is tending to 113.300-113.000.
An alternative may be the growth of the USD/JPY quotes to the level of 114.000-114.200.
Dollar Unimpressed By Jobs Data, Yuan Softens As China Opens Stimulus Taps
Here are the latest developments in global markets:
FOREX: The dollar is higher by 0.18% against a basket of six major currencies on Monday, recovering the modest losses it recorded in the previous session. The British pound posted notable gains after media reports suggested the EU is ready to offer the UK a “super charged” free trade deal. In China, the PBOC eased policy by cutting its reserve requirement ratios (RRR), triggering a tumble in the yuan.
STOCKS: US markets were a sea of red on Friday, as yields on US bonds remained in elevated territory, offering an attractive alternative to stocks. The losses were led by the tech sector, with Netflix (-3.38%) and Apple (-1.62%) being notable underperformers. Accordingly, the tech-heavy Nasdaq Composite (-1.16%) declined by more than the S&P 500 (-0.55%) and Dow Jones (-0.68%). The Dow, S&P, and Nasdaq 100 were all set to open lower today as well, according to futures. Turning to Asia, almost all indices were lower on Monday, despite China easing its monetary policy (see below). China’s CSI 300 fell by an astonishing 4.30%, the Hang Seng in Hong Kong tumbled by 1.27%, and South Korea’s Kospi 200 inched down by 0.47%. Likewise in Europe, all the major indices are due to open lower today, futures suggest.
COMMODITIES: WTI traded 0.7% down at $73.83 per barrel. News of the US saying it may grant some countries a waiver to sanctions against Iran’s oil exports, as well Saudi Arabia appearing to make up for any shortfalls stemming from Iran acted as the catalyst for the move down. Meanwhile, there are worries on the demand side that are negative for prices too; the Sino-US confrontation could weigh on global growth and thus on demand for the precious liquid. Elsewhere, Brent crude was down by roughly the same proportion as WTI, trading at $83.57/barrel. In precious metals, dollar-denominated gold was down by nearly 0.6% at $1,295.58 per ounce, losing ground as the greenback strengthened but remaining within the relatively narrow range between $1,214.28 and $1,180.34 established from late August onwards.
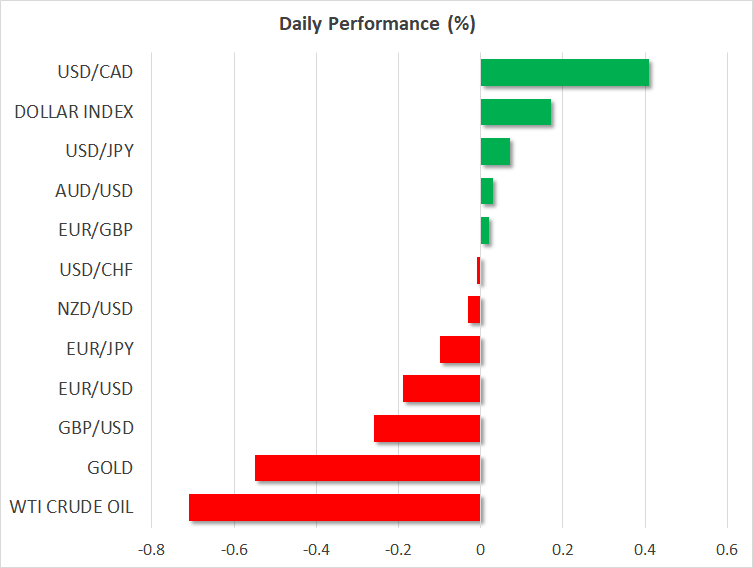
Major movers: China opens stimulus taps; dollar unimpressed by US jobs data
The People’s Bank of China (PBOC) eased its policy over the weekend, cutting the amount that commercial banks have to hold as reserves by 1 percentage point. The move is aimed at freeing up liquidity in the banking system and propping up the economy at a time when the raging trade conflict with the US threatens to slow down growth. Separately, China’s Finance Minister Liu Kun said a few hours later the government is ready to adopt a “more proactive” fiscal policy to “minimize the impact” of trade tensions, effectively hinting at fiscal stimulus in the pipeline too.
Paradoxically, while easier monetary policy and promises of greater fiscal spending are theoretically a tailwind for stocks, Chinese markets plunged when they reopened today after a week of holidays. Specifically, the CSI 300 dropped by 4.30%, with investors seemingly signaling that stimulus alone will be inadequate to shelter the economy in case trade tensions escalate much further. More importantly, the fact China is taking stimulus measures which will take a long time to filter into the real economy was probably seen as another signal the authorities expect the trade battle to be a prolonged one, and possibly worsen even further from here.
In the US, the employment data on Friday were somewhat mixed and hence left the dollar little changed in the aftermath. Nonfarm payrolls disappointed, clocking in at just 134k instead of the anticipated 185k. Average hourly earnings came at 2.8% in yearly terms, as expected, while the unemployment rate declined by more than projected, to 3.7% – a low last seen in 1969. In general, these figures pointed to a vibrant economy, but not one that is “on fire”, as survey-based measures like the ISM PMIs would have led one to believe. The dollar ended Friday’s session lower against most of its major peers, albeit only slightly so.
In the UK, sterling ripped higher after reports the EU is ready to offer Britain an unprecedented “super-charged” free trade agreement in an attempt to wrap up a deal by mid-November. While the offer would fall short of what PM May requested, for instance rejecting “frictionless trade”, it would still be a gigantic leap in the right direction. Optimism surrounding a deal seems to be on the rise, and considering that speculative positioning on the pound is still heavily net-short according to CFTC data, the currency likely has lots of room to run higher in case investors begin to unwind more of their prior short bets.
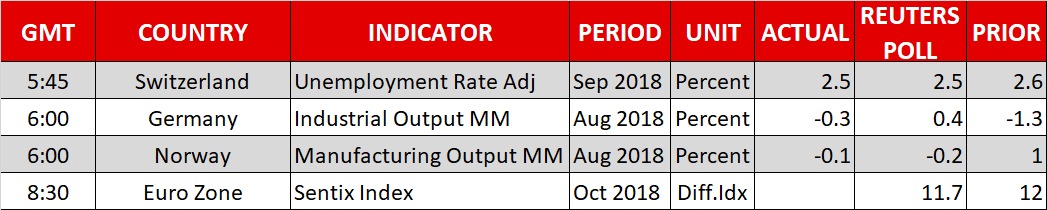
Day ahead: Eurozone’s Sentix due; Italian politics and Brexit generating attention
Barring the Sentix index out of the eurozone, which generally does not act as a major market mover, Monday’s calendar is empty of important releases.
The Sentix index that gauges investors’ sentiment in the eurozone is slated for release at 0830 GMT. The measure is projected to stand at 11.8 in October, its lowest since June. Emerging market angst, worries over political developments in Europe, and trade uncertainty stemming from President Trump’s tariff action acted as a drag on investor morale in the past, and they may well continue doing so moving forward.
Of more importance for the euro’s direction will be any developments in Italy. The country announced its budget plans last week. Worries seem to have eased a bit, though the window remains open for a clash between Italian and EU officials, something which will act as a drag on the common currency.
There have been some positive comments late last week suggesting a Brexit deal could materialize within the next few weeks. It is hoped that a deal could be struck on the major sticking point relating to the Irish border before a relevant summit on October 17. Any headlines pointing to a breakthrough are expected to be met with long sterling positions.
St. Louis Fed President Bullard (non-voting FOMC member in 2018) will be talking on US monetary policy, the interest rate outlook and the wider economic implications of fiscal policy at 0930 GMT.
Elsewhere, US Secretary of State Mike Pompeo visiting China will be generating interest, especially in light of the confrontational rhetoric between the two superpowers heating up recently.
US equity markets will be open today, despite the US bond market being closed for the Columbus Day holiday; stock markets are bracing for earnings season, with Citigroup, JPMorgan Chase and Wells Fargo releasing quarterly results on Friday.
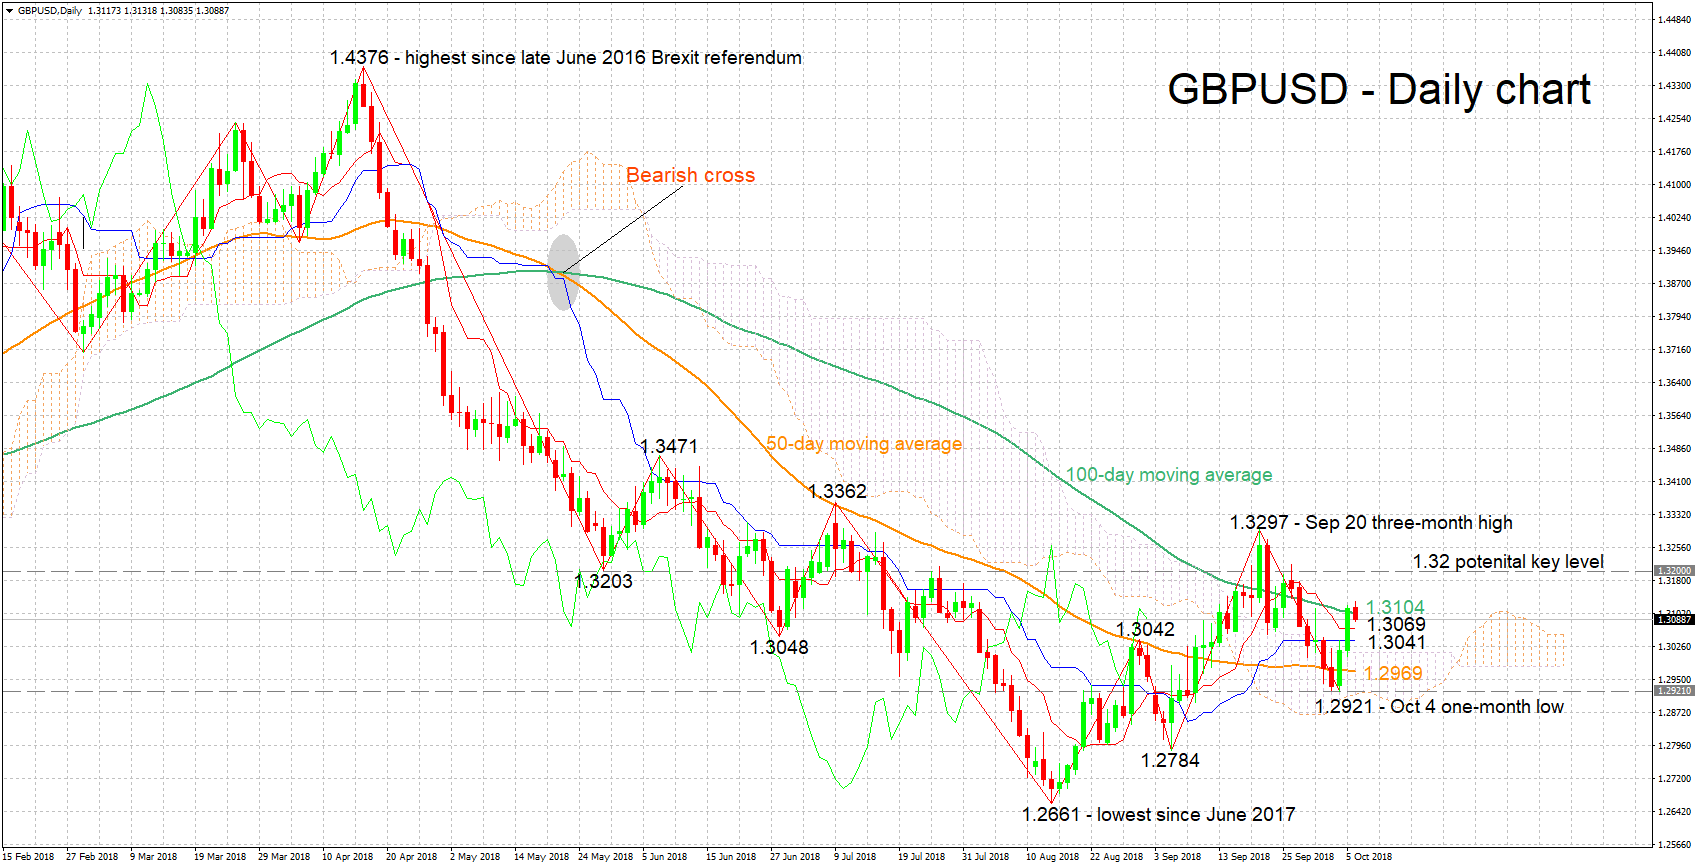
Technical Analysis: GBPUSD looking mostly neutral in the short-term
GBPUSD has gained some ground after touching a one-month low of 1.2921 last week. The Tenkan- and Kijun-sen lines are positively aligned though they have both flatlined, overall projecting a mostly neutral picture in the short-term.
Positive momentum for a Brexit deal is expected to boost the pair. Given a move above 1.3104, the current level of the 100-day moving average, resistance may come around the 1.32 handle; the area around this was congested between late June to mid-July. Further above, the three-month high of 1.3297 from September 20 would be eyed.
Conversely, disagreements rendering a no-deal Brexit more likely are anticipated to weigh on GBPUSD. Immediate support to a declining pair could occur around the current levels of the Tenkan- and Kijun-sen lines at 1.3069 and 1.3041 respectively. Not far below lies the Ichimoku cloud top at 1.3011 and then the 50-day MA at 1.2969. Steeper losses would shift the attention to October 4’s one-month low of 1.2921.
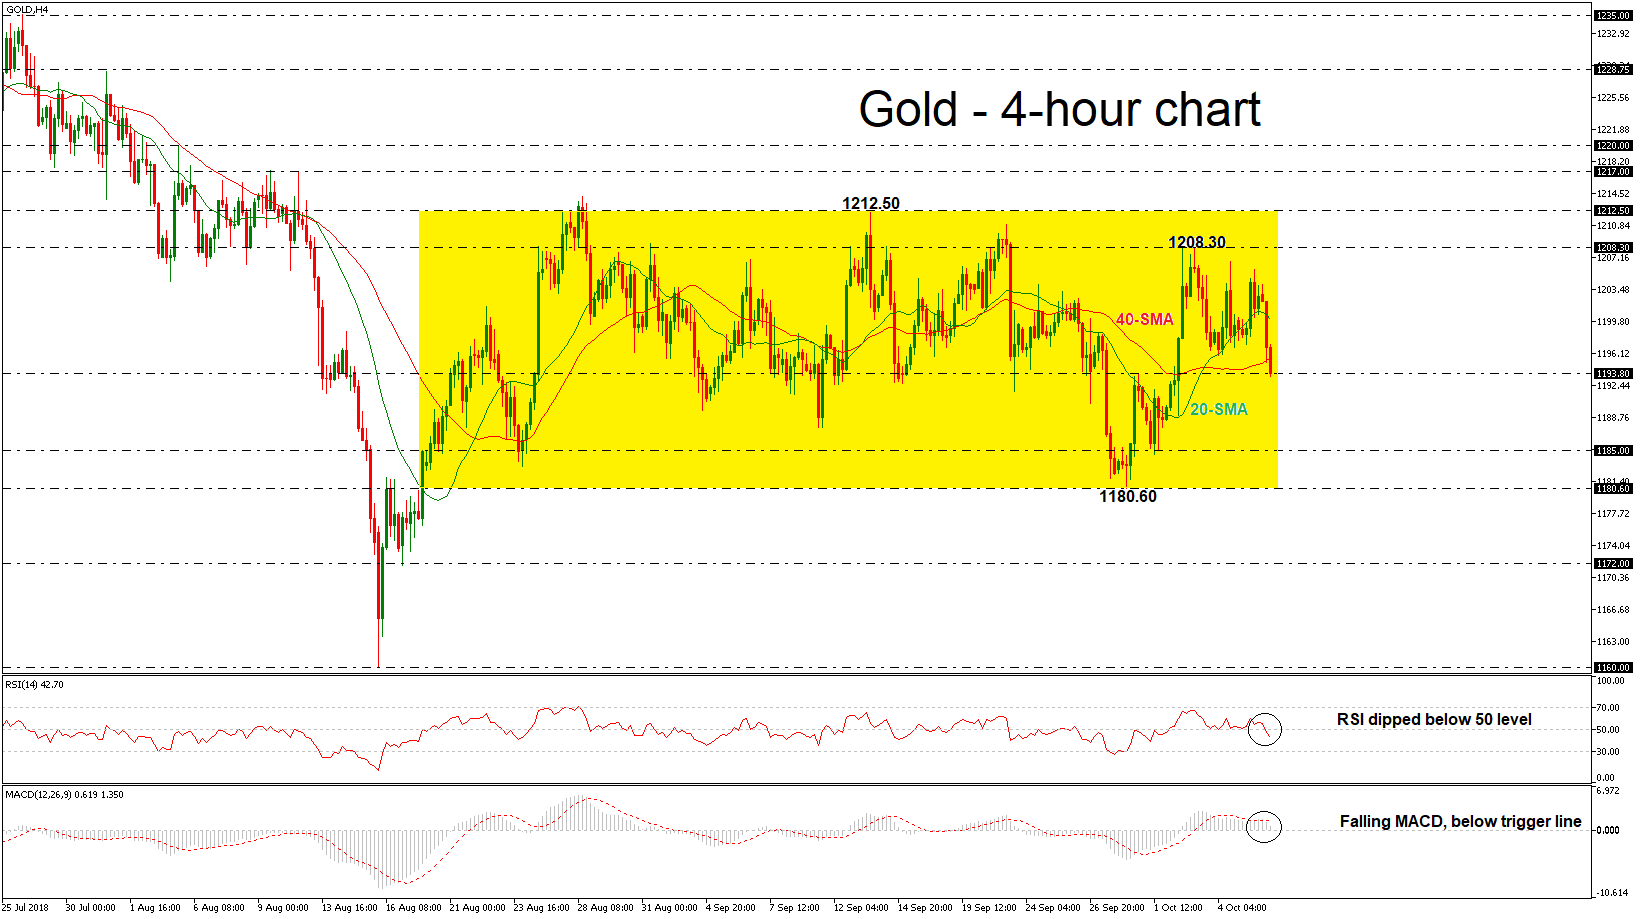
Gold Records Significant Losses In Trading Range
Gold is still holding within a short-term trading range over the last two months with strong resistance boundary the 1212.50 level and support boundary the 1180.60 level. Notice that currently, the price is moving below the 20- and 40-simple moving averages (SMAs) in the 4-hour chart. The bearish pressure in the channel has been confirmed by the technical indicators. The RSI indicator dropped below the 50 threshold, while the MACD oscillator is losing momentum in the positive territory.
If the precious metal dips below the 1193.80 hurdle again, then the focus would shift towards the 1185.00 support. If this level is breached too, it would increase negative view and may bring the price until the 1180.60 barrier, identified by the September 28 low.
In case of an upside movement and a climb above the SMAs, there is scope to retest the 1208.30 resistance level and clearing this key level could see additional gains towards the upper boundary of 1212.50. If the price successfully penetrates the trading range, it would challenge the 1217 – 1220 resistance zone, identified by the peaks in early August.
Having a look at the short-term timeframe, gold lost its momentum over the last couple of months, while in the medium-term the price has been developing in bearish mode since the pullback on the 1365 resistance barrier.
The Dollar Index Has Become Stable. Demand For The US Currency Is Still High
At the end of last week, the US dollar weakened slightly against the basket of major currencies. On Friday, mixed data on the US labor market for September were published. Thus, the number of people employed in the nonfarm sector slowed down to 134K, while investors expected a value of 185K. The growth of average hourly wages met market expectations and counted to 0.3% (m/m). Meanwhile, the unemployment rate fell from 3.9% to 3.7%. The US dollar index (#DX) closed in the negative zone (-0.10%). In general, the demand for the US currency is still high.
The British pound strengthened against the US dollar after statements by the EU's chief negotiator, Michel Barnier, that they were ready to offer the UK a “unique” deal that was better and more beneficial than the previous one. However, it is not yet known whether Theresa May agrees to the new conditions.
The "black gold" prices have been declining. At the moment, futures for the WTI crude oil are testing a mark of $73.75 per barrel.
Market Indicators
On Friday, aggressive sales were observed in the US stock market: #SPY (-0.56%), #DIA (-0.72%), #QQQ (-1.22%).
At the moment, the 10-year US government bonds yield is at the level of 3.23-3.24%.
The news feed on 2018.10.08:
Today, the publication of important economic news is not expected.
Forex Technical Analysis: EUR/USD, USD/JPY, GBP/USD
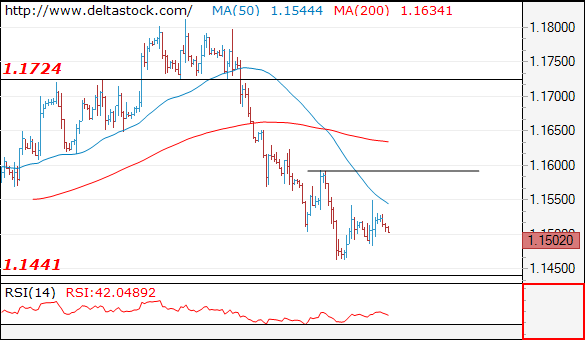
EUR/USD
Current level - 1.1502
The rebound after 114.60 is pretty pale, but the outlook remains rather positive, for a test of 1.1590 hurdle. Key support lies at 1.1440.
| Resistance | Support | ||
| intraday | intraweek | intraday | intraweek |
| 1.1590 | 1.1835 | 1.1440 | 1.1300 |
| 1.1720 | 1.2010 | 1.1440 | 1.1100 |
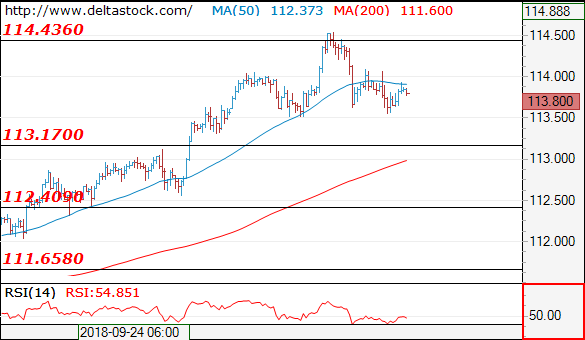
USD/JPY
Current level - 113.80
Still bearish, for a break through 113.50, towards 112.40 zone. Initial Resistance is projected at 114.20.
| Resistance | Support | ||
| intraday | intraweek | intraday | intraweek |
| 114.20 | 114.40 | 113.50 | 111.65 |
| 114.40 | 114.40 | 112.40 | 110.40 |
GBP/USD
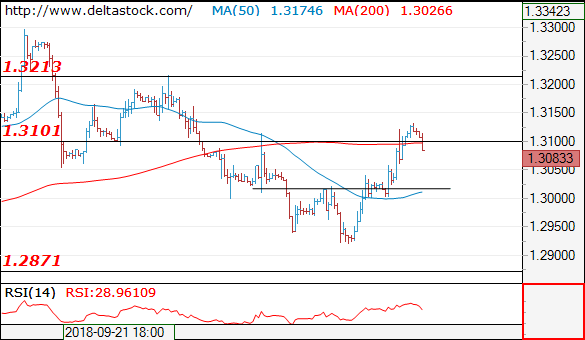
Current level - 1.3083
My outlook is positive above 1.3050, for another leg upwards, to 1.3210 zone. Crucial on the downside is 1.3020 area.
| Resistance | Support | ||
| intraday | intraweek | intraday | intraweek |
| 1.3140 | 1.3440 | 1.3020 | 1.2570 |
| 1.3210 | 1.3440 | 1.2870 | 1.2570 |
Crude Oil Under Pressure
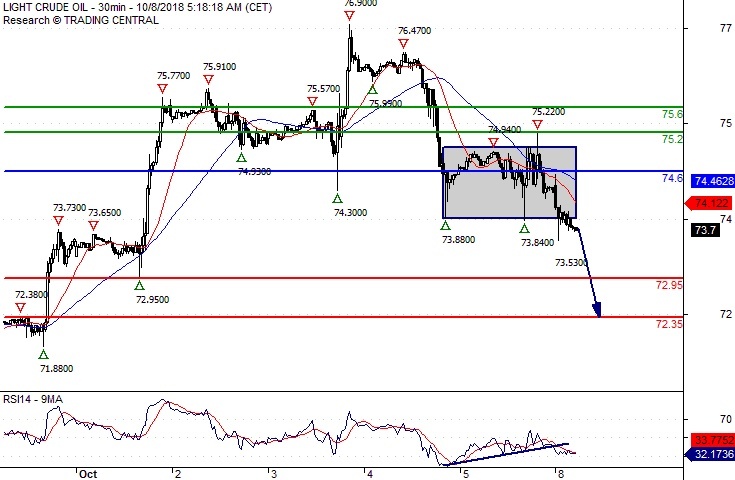
Pivot (invalidation): 74.60
Our preference Short positions below 74.60 with targets at 72.95 & 72.35 in extension.
Alternative scenario Above 74.60 look for further upside with 75.20 & 75.60 as targets.
Comment The RSI broke below a rising trend line. Crude Oil broke below the consolidation zone.
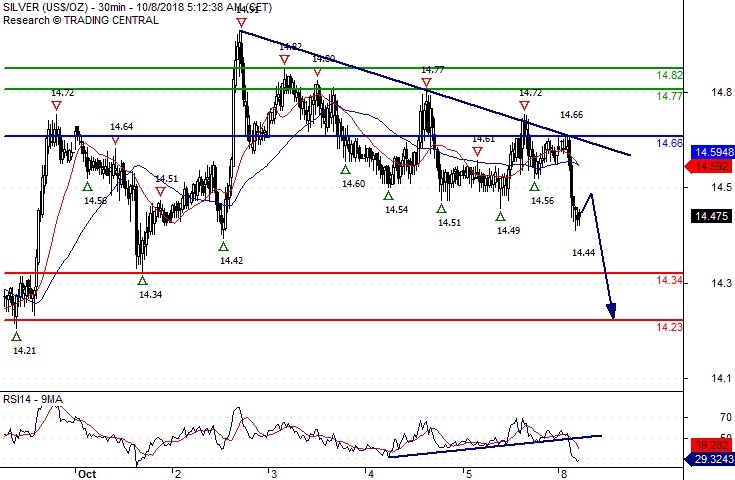
Silver Spot Turning Down
Pivot (invalidation): 14.6600
Our preference Short positions below 14.6600 with targets at 14.3400 & 14.2300 in extension.
Alternative scenario Above 14.6600 look for further upside with 14.7700 & 14.8200 as targets.
Comment The RSI broke below a rising trend line.