Sample Category Title
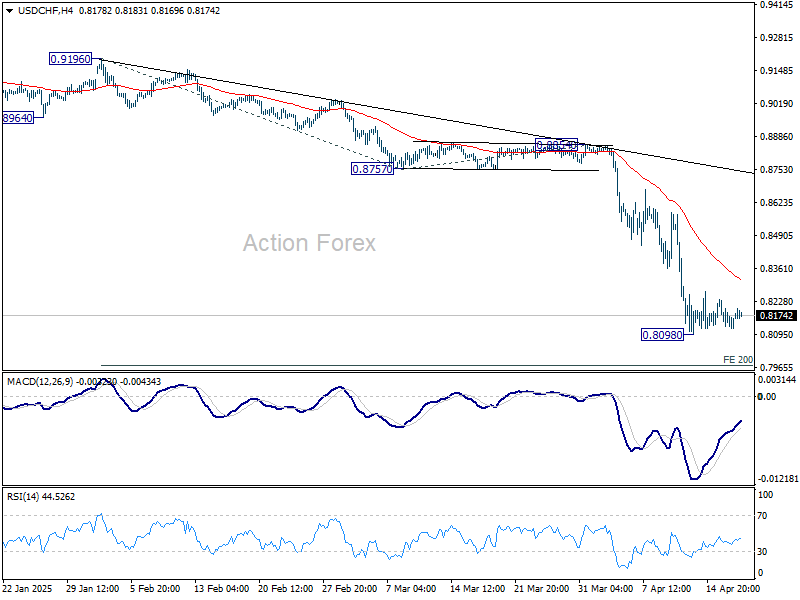
USD/CHF Mid-Day Outlook
Daily Pivots: (S1) 0.8092; (P) 0.8163; (R1) 0.8206; More…
Intraday bias in USD/CHF stays neutral for consolidations above 0.8098. While stronger recovery might be seen, upside should be limited by 55 4H EMA (now at 0.8313) to bring another fall. On the downside, break of 0.8098 will resume recent down trend to 200% projection of 0.9196 to 0.8757 from 0.8854 at 0.7976 next. Nevertheless, sustained break of 55 4H EMA will confirm short term bottoming, and turn bias back to the upside for stronger rebound.
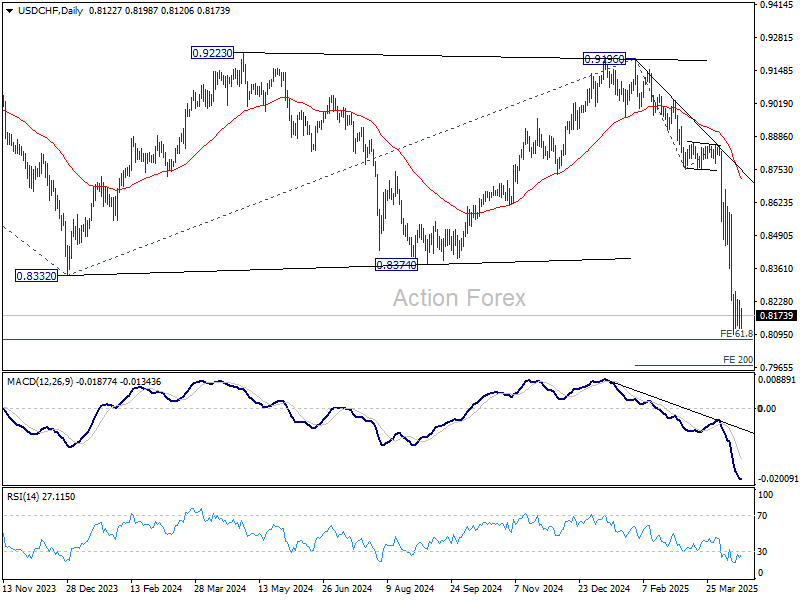
In the bigger picture, the break of 0.8332 (2023 low) confirms resumption of long term down trend from 1.0342 (2017 high). Next target is 61.8% projection of 1.0146 (2022 high) to 0.8332 from 0.9196 at 0.8075. Firm break there will target 100% projection at 0.7382. In any case, outlook will now stay bearish as long as 55 W EMA (now at 0.8821) holds.
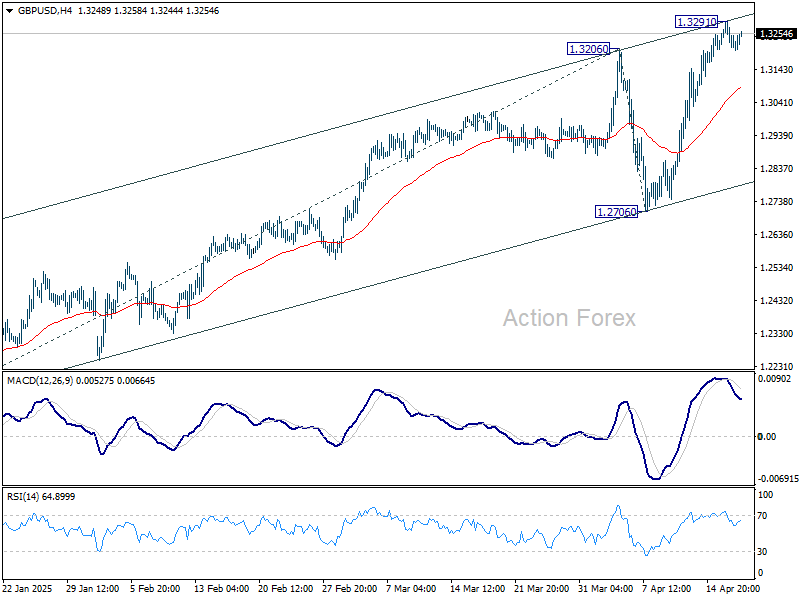
GBP/USD Mid-Day Outlook
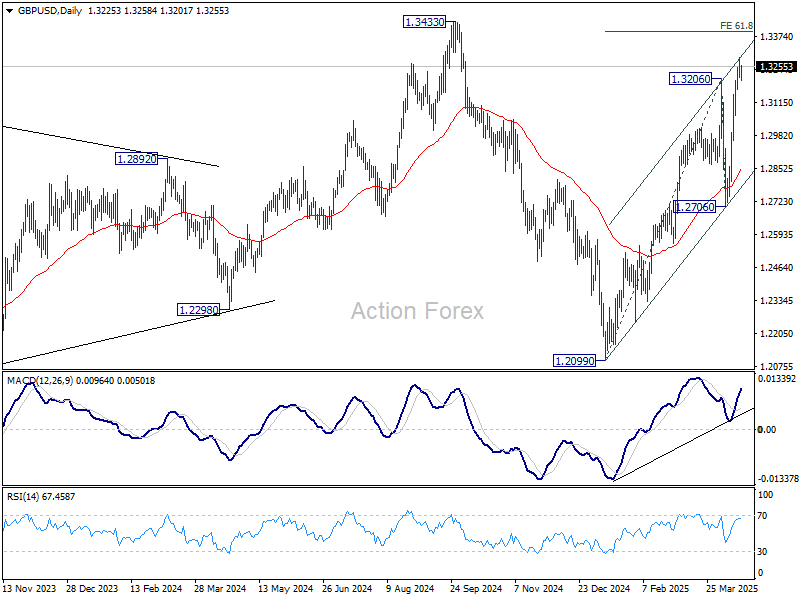
Daily Pivots: (S1) 1.3205; (P) 1.3249; (R1) 1.3285; More...
Intraday bias in GBP/USD stays neutral for consolidations below 1.3291 temporary top. Further rally is expected as long as 55 4H EMA (now at 1.3085) holds. Above 1.3291 will resume the rise from 1.2099 to 61.8% projection of 1.2099 to 1.3206 from 1.2706 at 1.3390, and possibly further to 1.3433 high. However, sustained break of 55 4H EMA will turn bias back to the downside for deeper pullback.
In the bigger picture, price actions from 1.3433 are seen as a corrective pattern to the up trend from 1.3051 (2022 low). Rise from 1.2099 could be the second leg. Overall, GBP/USD should target 1.4248 key resistance (2021 high) on break of 1.3433 at a later stage.
No Reaction to ECB Cut as Markets Drift in Pre-Holiday Lull
Trading in the forex markets remain calm, with little reaction to ECB’s widely anticipated 25bps rate cut. The move to lower its deposit rate to 2.25% was fully priced in. The central bank acknowledged that Eurozone growth prospects have deteriorated due to escalating global trade tensions, but this has long been embedded in market expectations. The absence of any forward guidance or new policy direction helped reinforce the market’s muted tone.
Indeed, the primary focus for investors remains the intensifying US trade war and its ripple effects on global economic sentiment. As markets break for the Easter weekend, investors are bracing for trade policy to return to center stage next week. The lack of clarity surrounding tariff policy and broader US trade strategy is increasingly weighing on corporate confidence. U.S. firms, in particular, are becoming more hesitant to invest or expand amid the shifting policy environment.
A Reuters poll conducted between April 14–17 illustrates the rising unease. The probability of a US recession within the next 12 months surged to 45%, up sharply from 25% in March and marking the highest reading since December 2023. All 45 economists who responded to a related question said that tariffs have negatively affected business sentiment, with nearly half describing the impact as “very negative.”
At the same time, economists are scaling up their inflation forecasts. Expectations for headline CPI, core CPI, PCE, and core PCE have all been revised higher, with all measures now projected to remain above Fed’s 2% target through at least 2027. A majority of economists—62 out of 101 surveyed—expect the Fed to hold its benchmark interest rate steady at 4.25%-4.50% until at least July.
In terms of currency performance, Kiwi continues to lead the pack this week while Aussie and Sterling follow. At the other end, Swiss Franc is the weakest, trailed by the Euro and Loonie. Dollar and Yen are trading in the middle of the pack.
In Europe at the time of writing, FTSE is down -0.38%. DAX is down -0.44%. CAC is down -0.74%. UK 10-year yield is down -0.03 at 4.579. Germany 10-year yield is down -0.03 at 2.482. Earlier in Asia, Nikkei rose 1.35%. Hong Kong HSI rose 1.61%. China Shanghai SSE rose 0.13%. Singapore Strait Times rose 1.58%. Japan 10-year JGB yield rose 0.015 to 1.312.
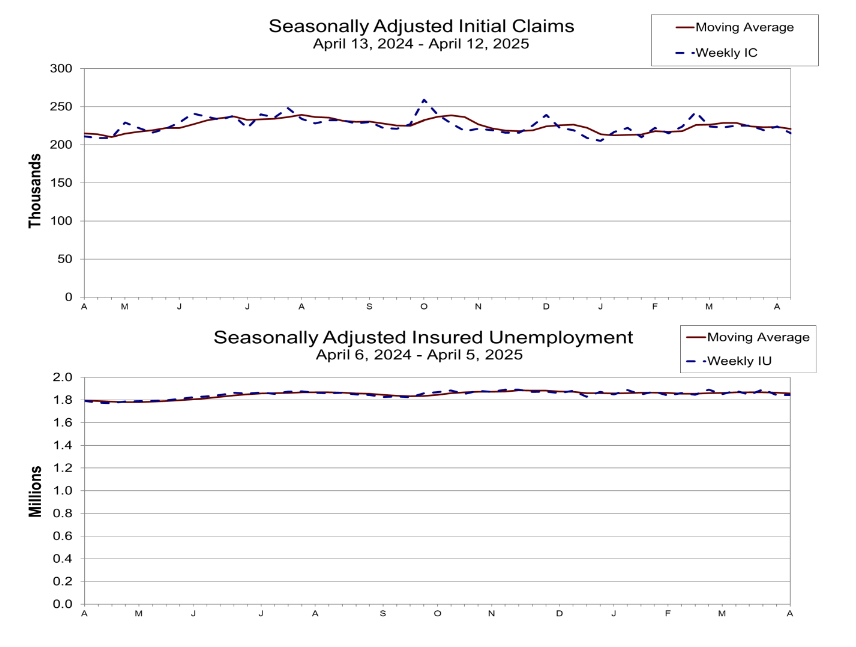
US initial jobless claims fall to 215k, vs exp 224k
US initial jobless claims fell -9k to 215k in the week ending April 12, below expectation of 224k. Four-week moving average of initial claims fell -2.5k to 221k.
Continuing claims rose 41k to 1885k in the week ending April 5. Four-week moving average of continuing claims rose 1k to 1867k.
ECB cuts rates to 2.25%, drops “restrictive” language amid mounting uncertainty
ECB cut its deposit rate by 25 bps points to 2.25% as widely expected, but the more notable shift came in the tone of its accompanying statement. ECB completely removed the reference to its policy stance being “restrictive,” a phrase that had previously signaled a bias toward further monetary easing.
This change suggests policymakers believe the easing campaign has brought rates closer to neutral territory. The central bank emphasized that it will maintain a data-dependent, meeting-by-meeting approach and is "not pre-committing to a particular rate path" given the exceptional levels of uncertainty.
ECB noted that disinflation process remains “well on track,” with both headline and core inflation continuing to decline in line with forecasts. Importantly, services inflation—previously a key sticking point—has also “eased markedly” in recent months.
However, the central bank also highlighted growing downside risks to the economic outlook. ECB acknowledged that rising global trade tensions have begun to weigh on business and household confidence. The resulting volatility in financial markets is already tightening financing conditions and could further dampen activity in the Eurozone.
BoJ's Nakagawa and Ueda highlight US tariff risk, urge vigilance
BoJ board member Junko Nakagawa cited US trade policy as one of the most significant risks to Japan’s economic outlook. In a speech, she noted that higher US tariffs could directly damage Japanese corporate activity, pressuring exports, production, sales, capital expenditure, and profitability.
Nakagawa also noted the potential for broader spillover effects, including weakened business and consumer sentiment and volatility in commodity prices and financial markets.
Echoing these concerns, BoJ Governor Kazuo Ueda told the parliament that uncertainty surrounding US policy, especially tariffs, has “heightened sharply” in recent weeks. Ueda stressed that the central bank will assess trade-related developments at each policy meeting without any pre-conception.
While reaffirming BoJ’s intention to raise interest rates if economic and price conditions align with projections, Ueda emphasized, "we must be vigilant to the fact uncertainty surrounding each country's trade policy is heightening."
Japan's exports grow 3.9% yoy in March, imports up 2.0% yoy
Japan’s exports rose 3.9% yoy in March to JPY 9.85T, below the expected 4.5% yoy gain. Shipments to the US rose 3.1% yoy overall, boosted by strong gains in electronic parts (+35.8%), pharmaceuticals (+29.7%), and autos (+4.1%). However, this was offset by weakness in China, where exports fell -4.8% yoy.
On the import side, inbound shipments rose 2.0% yoy to JPY 9.30T , also falling short of the forecast 3.1% yoy. That resulted in trade surplus of JPY 544B.
In seasonally adjusted term, exports dropped -3.8% mom to JPY 9.31 trillion, while imports ticked up 0.6% mom, bringing the adjusted trade balance into a JPY -234B deficit.
Australia jobs rise 32.2k in March, misses expectations
Australia added 32.2k jobs in March, falling short of expectations for a 41.2k increase. The composition of gains was relatively balanced with 15k full-time and 17.2k part-time positions added.
Unemployment rate ticked up slightly to 4.1% from 4.0%, coming in better than the expected 4.2%. The modest rise in the jobless rate was largely due to a higher participation rate, which increased from 66.7 to 66.8%.
A potential sign of underlying weakness came from a -0.3% mom decline in total monthly hours worked, the second consecutive monthly drop. But that could be attributed partly to weather disruptions linked to ex-Tropical Cyclone Alfred.
NZ CPI surprises to the upside at 2.5% in Q1, domestic pressures driving
New Zealand’s consumer prices rose more than expected in the first quarter, with CPI climbing 0.9% qoq and accelerating from 2.2% yoy to 2.5% yoy, above forecasts of 0.7% qoq and 2.3% yoy.
Nevertheless, this still marks the third consecutive quarter that annual inflation has stayed within RBNZ’s 1–3% target band.
Tradeable inflation, reflecting imported price dynamics, rose 0.8% qoq and just 0.3% yoy, indicating limited external pricing pressure. In contrast, non-tradeable inflation, a proxy for domestic conditions, surged 1.1% qoq and 4.0% yoy.
The strength in non-tradeables points to robust local demand and ongoing cost pressures within the domestic economy.
EUR/USD Mid-Day Outlook
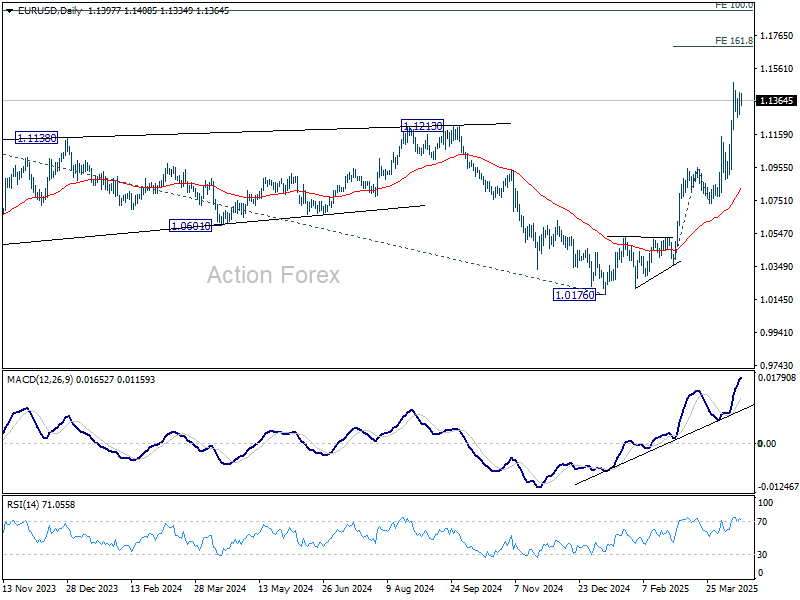
Daily Pivots: (S1) 1.1314; (P) 1.1363; (R1) 1.1449; More...
EUR/USD is still bounded in consolidation below 1.1472 and intraday bias remains neutral. Deeper retreat cannot be ruled out. But downside should be contained by 1.1145 resistance turned support to bring another rally. On the upside, break of 1.1472 will target 161.8% projection of 1.0358 to 1.0953 from 1.0731 at 1.1694.
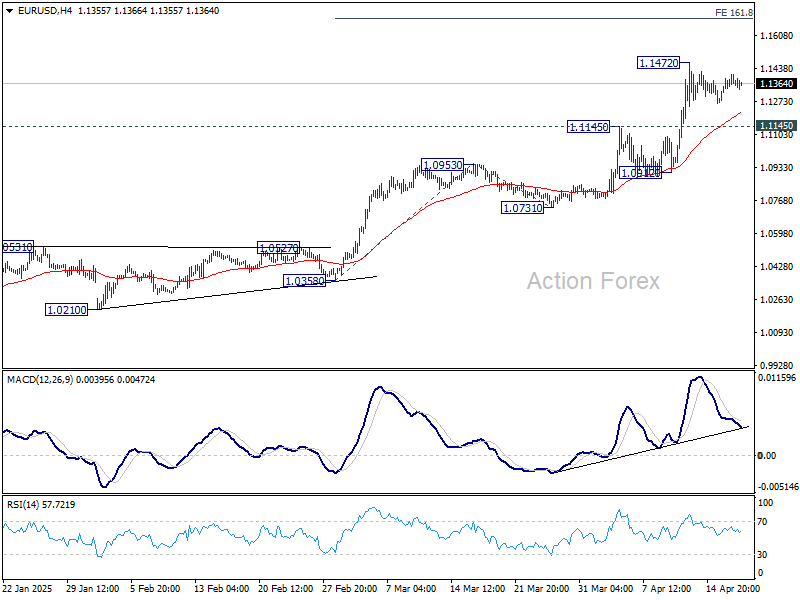
In the bigger picture, rise from 0.9534 long term bottom could be correcting the multi-decade downtrend or the start of a long term up trend. In either case, further rise should be seen to 100% projection of 0.9534 to 1.1274 from 1.0176 at 1.1916. This will now remain the favored case as long as 55 W EMA (now at 1.0745) holds.
EUR/USD Mid-Day Outlook
Daily Pivots: (S1) 1.1314; (P) 1.1363; (R1) 1.1449; More...
EUR/USD is still bounded in consolidation below 1.1472 and intraday bias remains neutral. Deeper retreat cannot be ruled out. But downside should be contained by 1.1145 resistance turned support to bring another rally. On the upside, break of 1.1472 will target 161.8% projection of 1.0358 to 1.0953 from 1.0731 at 1.1694.
In the bigger picture, rise from 0.9534 long term bottom could be correcting the multi-decade downtrend or the start of a long term up trend. In either case, further rise should be seen to 100% projection of 0.9534 to 1.1274 from 1.0176 at 1.1916. This will now remain the favored case as long as 55 W EMA (now at 1.0745) holds.
US initial jobless claims fall to 215k, vs exp 224k
US initial jobless claims fell -9k to 215k in the week ending April 12, below expectation of 224k. Four-week moving average of initial claims fell -2.5k to 221k.
Continuing claims rose 41k to 1885k in the week ending April 5. Four-week moving average of continuing claims rose 1k to 1867k.
ECB cuts rates to 2.25%, drops “restrictive” language amid mounting uncertainty
ECB cut its deposit rate by 25 bps points to 2.25% as widely expected, but the more notable shift came in the tone of its accompanying statement. ECB completely removed the reference to its policy stance being “restrictive,” a phrase that had previously signaled a bias toward further monetary easing.
This change suggests policymakers believe the easing campaign has brought rates closer to neutral territory. The central bank emphasized that it will maintain a data-dependent, meeting-by-meeting approach and is "not pre-committing to a particular rate path" given the exceptional levels of uncertainty.
ECB noted that disinflation process remains “well on track,” with both headline and core inflation continuing to decline in line with forecasts. Importantly, services inflation—previously a key sticking point—has also “eased markedly” in recent months.
However, the central bank also highlighted growing downside risks to the economic outlook. ECB acknowledged that rising global trade tensions have begun to weigh on business and household confidence. The resulting volatility in financial markets is already tightening financing conditions and could further dampen activity in the Eurozone.
(ECB) Monetary policy decisions
17 April 2025
The Governing Council today decided to lower the three key ECB interest rates by 25 basis points. In particular, the decision to lower the deposit facility rate – the rate through which the Governing Council steers the monetary policy stance – is based on its updated assessment of the inflation outlook, the dynamics of underlying inflation and the strength of monetary policy transmission.
The disinflation process is well on track. Inflation has continued to develop as staff expected, with both headline and core inflation declining in March. Services inflation has also eased markedly over recent months. Most measures of underlying inflation suggest that inflation will settle at around the Governing Council’s 2% medium-term target on a sustained basis. Wage growth is moderating, and profits are partially buffering the impact of still elevated wage growth on inflation. The euro area economy has been building up some resilience against global shocks, but the outlook for growth has deteriorated owing to rising trade tensions. Increased uncertainty is likely to reduce confidence among households and firms, and the adverse and volatile market response to the trade tensions is likely to have a tightening impact on financing conditions. These factors may further weigh on the economic outlook for the euro area.
The Governing Council is determined to ensure that inflation stabilises sustainably at its 2% medium-term target. Especially in current conditions of exceptional uncertainty, it will follow a data-dependent and meeting-by-meeting approach to determining the appropriate monetary policy stance. In particular, the Governing Council’s interest rate decisions will be based on its assessment of the inflation outlook in light of the incoming economic and financial data, the dynamics of underlying inflation and the strength of monetary policy transmission. The Governing Council is not pre-committing to a particular rate path.
Key ECB interest rates
The Governing Council today decided to lower the three key ECB interest rates by 25 basis points. Accordingly, the interest rates on the deposit facility, the main refinancing operations and the marginal lending facility will be decreased to 2.25%, 2.40% and 2.65% respectively, with effect from 23 April 2025.
Asset purchase programme (APP) and pandemic emergency purchase programme (PEPP)
The APP and PEPP portfolios are declining at a measured and predictable pace, as the Eurosystem no longer reinvests the principal payments from maturing securities.
***
The Governing Council stands ready to adjust all of its instruments within its mandate to ensure that inflation stabilises sustainably at its 2% target over the medium term and to preserve the smooth functioning of monetary policy transmission. Moreover, the Transmission Protection Instrument is available to counter unwarranted, disorderly market dynamics that pose a serious threat to the transmission of monetary policy across all euro area countries, thus allowing the Governing Council to more effectively deliver on its price stability mandate.
The President of the ECB will comment on the considerations underlying these decisions at a press conference starting at 14:45 CET today.
ECB April Meeting Preview: Expected Rate Cuts and Market Impact
- ECB expected to cut rates by 25bps amidst economic uncertainty.
- Focus on trade tensions and slowing inflation influencing ECB policy.
- Markets watching for clues on future rate cuts as forward guidance may not be forthcoming.
- EUR/USD hovers in overbought territory ahead of ECB meeting. More upside ahead or time for a retracement?
The European Central Bank's (ECB) April meeting is scheduled later today with markets all but expecting a 25bps rate cut. This will be a sixth consecutive 25bps rate cut and comes against a backdrop of significant economic challenges, ranging from trade-induced uncertainty to slowing inflation.
Let us explore the likely outcomes of the meeting, the expected rate changes, and their broader implications for the Eurozone economy and global markets.
Why the April Meeting Matters
Today's ECB meeting is crucial as the bank addresses an uncertain economy with uneven growth. Key issues include:
US Policy: New US tariffs on European exports have created mixed inflation effects in the Eurozone. Europe has paused retaliatory measures during trade talks, but the uncertainty is slowing investment and trade.
Inflation Trends: Core inflation is slowing, with Eurozone inflation at 2.2% in March, down from 2.3%. ECB officials are worried about falling prices, especially as energy and services inflation drops.
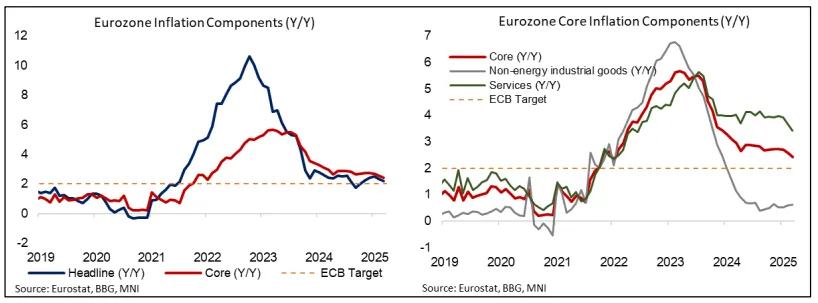
Source: Eurostat, MNI
Euro Strength: The Euro has recently hit multi-year highs against the US Dollar, adding pressure by reducing the competitiveness of European exports.
What to Expect from the ECB's Decision
Analysts widely expect the ECB to cut the deposit rate by 0.25% to 2.25%. This would put rates at the top of the ECB's expected neutral range (1.75–2.25%). Rising trade risks, stricter financial conditions, and slowing inflation make a rate cut more likely. However, markets are cautious, pricing in about 0.43% in cuts by June, showing uncertainty about how fast rates will be reduced.
At the March meeting, ECB President Christine Lagarde said monetary policy was getting less strict, showing a slow move away from tightening. Analysts think this view might shift further in April, with officials likely to say rates are close to neutral. However, the ECB is not expected to give clear future guidance or set a fixed rate plan, preferring to make decisions step by step based on data.
Such a move would be similar to what was seen by the Bank of Canada (BoC) yesterday. The BoC opted against forward guidance and projections citing the uncertainty of the current global economic climate.
For more information on the Bank of Canada decision, read Bank of Canada rate hold: USD/CAD slides, what's next?
Looking beyond the April meeting
The focus is once again on the ECB’s plans for the coming months. Markets expect the ECB to lower the deposit rate to 1.75% in the fourth quarter, with a small chance of even bigger cuts to make policy more supportive.
The ECB's Governing Council faces important decisions in the months ahead.
Key points to consider:
Rate Cuts: Analysts are split on whether more cuts will stop at neutral or go lower to boost growth. The June meeting is key, with some predicting rates could drop to 1.5% by September.
Quantitative Tightening (QT): Policymakers plan to slowly reduce bond holdings, but worsening trade disputes or financial instability might change these plans.
Uncertainty Management: The ECB’s guidance will depend on how trade tensions, geopolitics, and inflation unfold.
President Lagarde’s press conference will be closely watched for clues on balancing inflation, growth, and market risks.
Final Thoughts
The ECB might adjust its language to show its moving toward neutral policy but is unlikely to take a stronger stance due to ongoing uncertainty. The impact of tariffs on growth is clear, but their effect on inflation remains uncertain. A survey shows 26% of economists expect higher inflation soon. Future ECB actions will depend more on developments in the trade dispute than on Thursday's announcements.
Technical Analysis - EUR/USD
From a technical standpoint, the Euro has been the biggest beneficiary from the US-China trade war and tariff proposals by the US administration.
The US Dollar is under pressure as its safe haven appeal has largely dissipated in 2025.
There seems to be a noticeable pivot toward the EU assets at present and the Euro as well.
Given that markets have largely priced in a 25 bps cut, the decision today might have little impact on EUR/USD.
However, EUR/USD does remain in overbought territory and thus aretracement cannot be ruled as the pair tests significant resistance at the 1.1400 handle.
A break higher could lead to a retest of 1.1482 with the next key area of interest resting at the 1.1600 handle.
If we are to see a pullback in EUR/USD, immediate support rests at 1.1274 and 1.1200 respectively.
EUR/USD Daily Chart, April 17, 2025
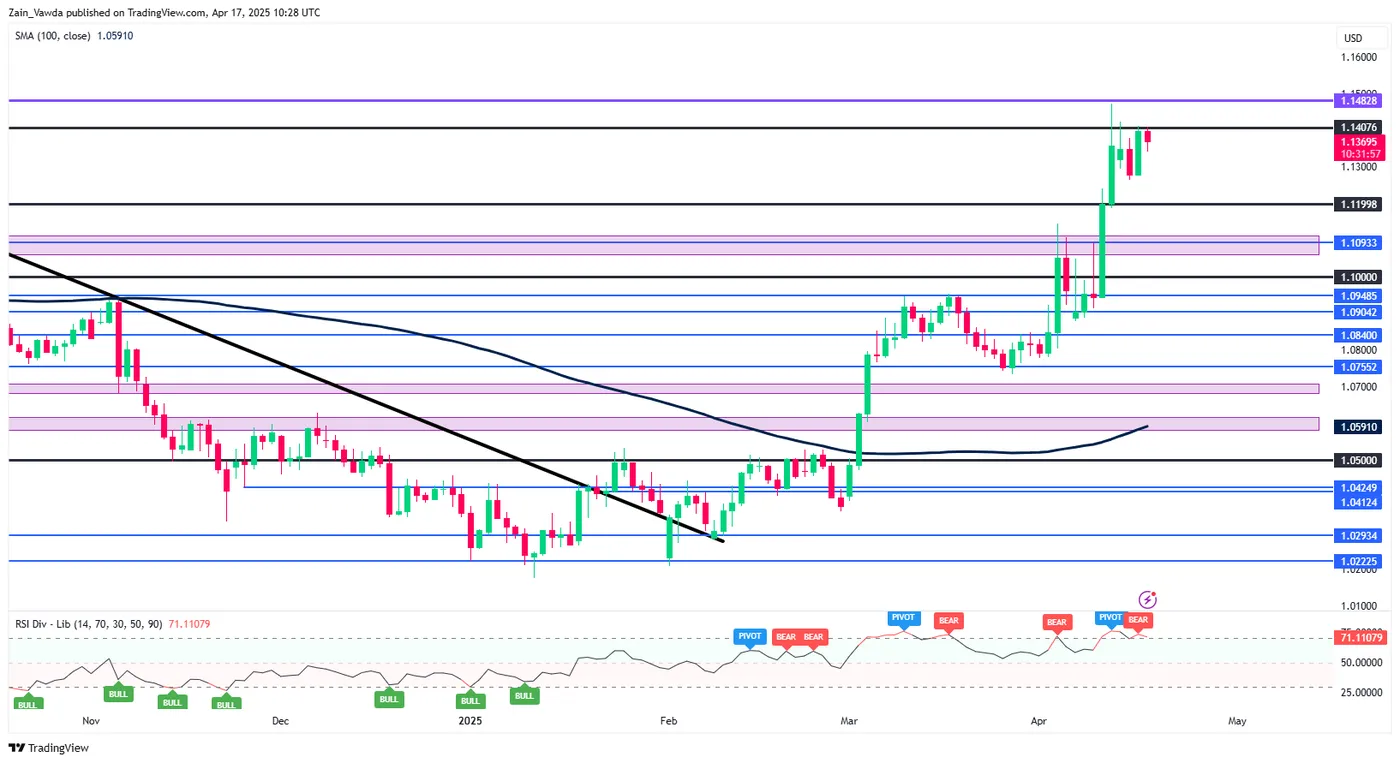
Source: TradingView (click to enlarge)
USD/JPY Outlook: Relief Bounce in US Dollar Before Yen Strength Resumes
- The multi-week decline of the USD/JPY from the 28 March high of 151.21 has stalled today, supported by US President Trump’s “big progress” in US-Japan trade talks.
- The US/Japan implied interest rate policy curve trajectory continues to narrow, which supports further yen strength.
- Watch the 147.30 key medium-term resistance on the USD/JPY.
This is a follow-up analysis of our prior report, “USD/JPY Outlook: The US dollar bounce against the yen may face headwinds soon,” dated 18 March 2025.
Since our last publication, the USD/JPY has staged the expected corrective rebound of 1.3% to print an intraday high of 151.21 on 28 March, just a whisker below the 151.50 medium-term pivotal resistance highlighted in our analysis.
Thereafter, it staged a multi-week bearish impulsive down move of 6.3% to print a 7-month low of 141.64 on Wednesday, 16 April, reinforced by the uncertainties on the implementation of different types of US trade tariffs, and heightened tensions between the US and China that sparked an increased risk of a global economic growth slow down, in turn, benefiting safe haven currencies such as the Japanese yen and Swiss franc.
US-Japan trade talks may not be smooth sailing under the surface
The recent Japanese yen strength has taken a backseat since the start of today’s 17 April Asian session, where the USD/JPY rebounded by 0.6% to print an intraday high of 143,08 at the time of writing.
The US dollar’s bounce has been supported by US President Trump’s positive rhetoric after the conclusion of the first session of the US-Japan trade negotiations dialogue yesterday, 16 April. He touted that “big progress” has been made via his social media account.
In contrast, the key Japanese official participating in the trade talks, Ryosei Akazawa, the Economic Revitalisation Minister was not so optimistic as he mentioned Japan will schedule the next consultation with the US to be held within this month, which suggests that there are still hurdles and frictions after yesterday's first round of trade negotiation.
US/Japan implied policy rate curve is supporting further yen strength
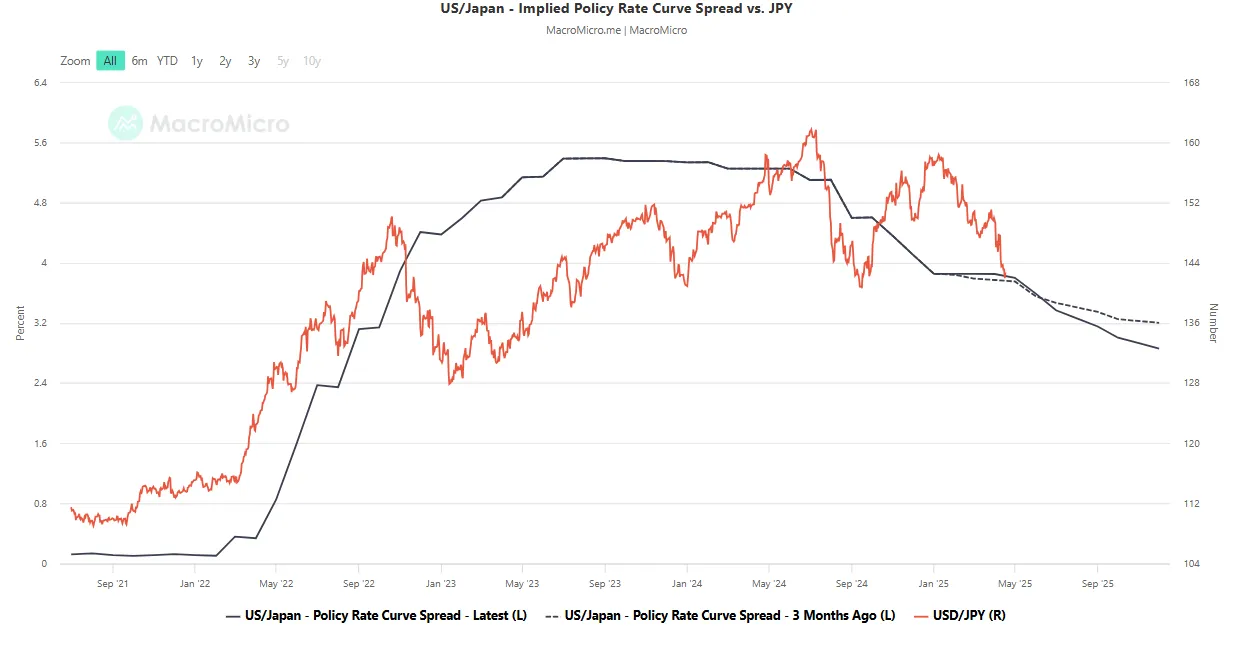
Fig 2: US/Japan implied policy rate projected to Dec 2025 as of 17 Apr 2025 (Source: MacroMicro)
The implied interest rate differential between US and Japan policy interest rates, projected to December 2025 via short-term rate futures, has narrowed to 2.86% from 3.20% three months ago.
This continued compression in the yield spread could exert further downward pressure on USD/JPY, in line with historical correlations (see Fig 1).
Japan’s March inflation data will be released on Friday, 18 April, with core and core-core inflation expected to edge up to 3.2% y/y (from 3.0%) and 2.7% y/y (from 2.6%), respectively. A stronger-than-expected reading would support the Bank of Japan’s gradual tightening stance and could further narrow the US-Japan implied interest rate differential.
No bearish exhaustion condition in the MACD trend indicator
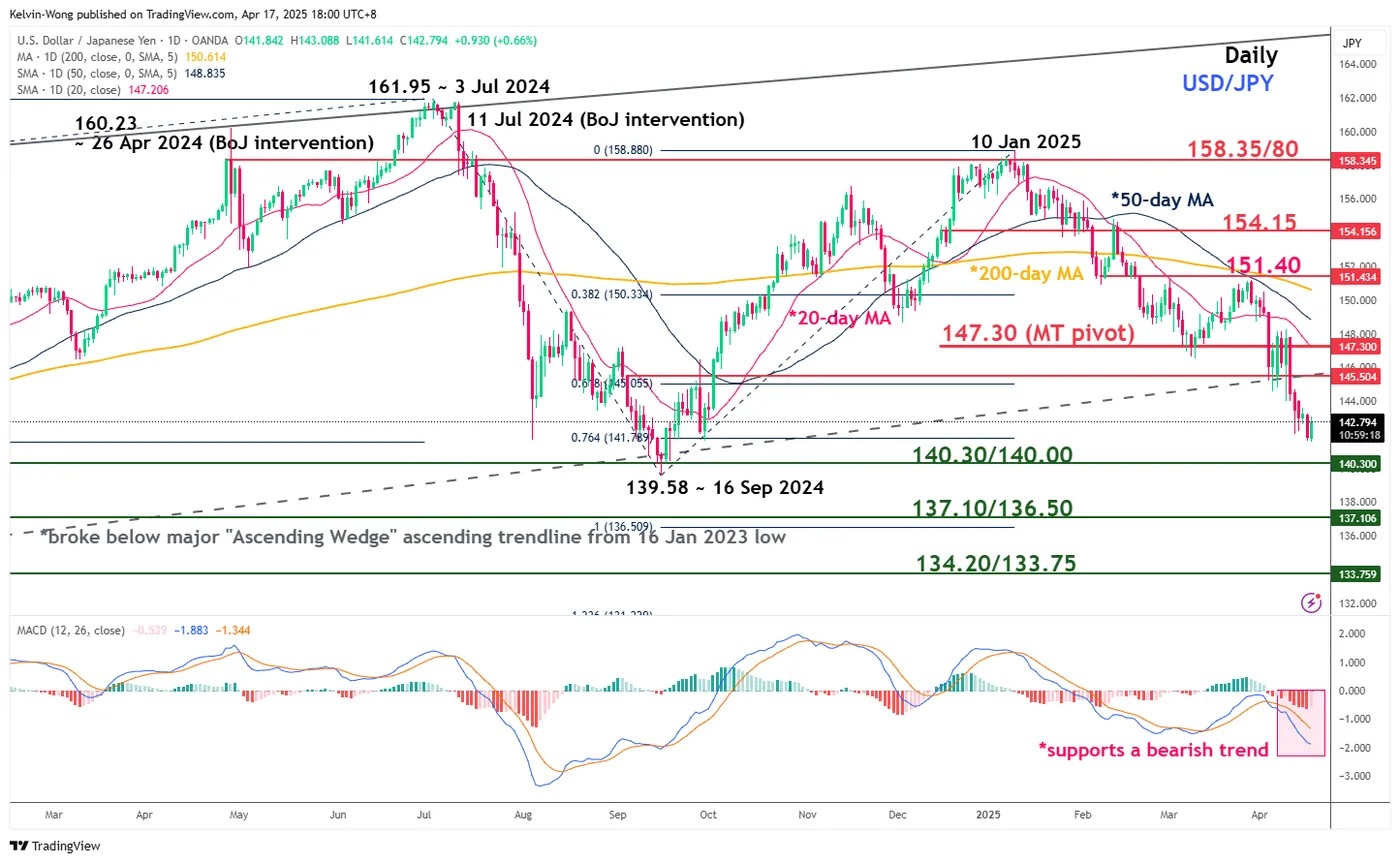
Fig 2: USD/JPY medium-term trend as of 17 Apr 2025 (Source: TradingView)
The spread of the daily MACD trend indicator and its signal line has continued to widen towards the downside (below the zero centreline), which supports the ongoing medium-term downtrend phase of the USD/JPY.
Watch the 147.30 key medium-term pivotal resistance, and a break below 140.30/140.00 intermediate support zone may trigger the continuation of the impulsive down move sequence to expose the next medium-term supports at 137.10/136.50 and 134.20/133.75 next.
However, a clearance above 147.30 invalidates the bearish tone for a corrective rebound towards the next medium-term resistances at 151.40 and 154.15.
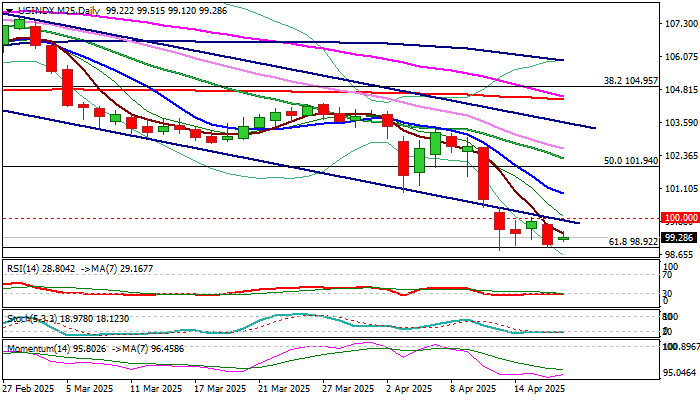
Dollar Index: Narrow Consolidation to Precede Fresh Push Lower While 100 Level Caps
The dollar index remains within a narrow consolidation above new multi-month low which extends into fifth consecutive day.
Larger bears are taking a breather after a sharp fall in past two weeks, when the dollar was deflated by imposed and subsequent delayed massive US import tariffs that dented investors’ confidence in US economic stability.
Technical pictures on daily and weekly charts show that bears hold grip firmly and remain ready to resume after a pause on extended Easter weekend.
Near-term price action continues to hold below broken 100 psychological support, which reverted to solid resistance and reinforced by broken lower trendline of larger bear-channel that keeps bearish bias and continues to pressure pivotal 99.00 support zone (Fibo 61.8% of 89.15/114.72 2021/2022 uptrend / recent lows) and 98.53 (100MMA).
Sustained break here to signal continuation of larger uptrend and expose target at 95.18 (Fibo 76.4%).
On the other hand, lift and close above 100 trigger would generate initial signal of stronger correction.
Res: 100.00; 100.42; 100.90; 101.23.
Sup: 98.90; 98.68; 98.14; 97.81.