Sample Category Title
Sunset Market Commentary
Markets
Global core bonds extend losses today with US Treasuries slightly underperforming German Bunds. The first downleg in the Bund resembled yesterday’s move: continued BTP strength lifted European yields and the euro. Italian bonds still thrive on optimism about the upcoming budget (in line with EU rules according to official), but they are losing momentum. Stronger-than-expected German ZEW investor sentiment caused no additional harm. US Treasuries started slipping away in US dealings ahead of tonight’s mid-month refinancing operation. The US NFIB small business optimism hit a new all-time high, but also didn’t impact trading. US yields increase by 2.1 bps (2-yr) to 2.9 bps (10-yr) with the belly of the curve underperforming the wings. German yields add 0.8 bps (2-yr) to 2.7 bps (10-yr). 10-yr yield spread changes vs Germany narrow up to 3 bps with Greece outperforming (-14 bps)
Today, trading in EUR/USD was again haunted by the swings in risk sentiment. This morning, it looked that the euro could enjoy additional support from an overall constructive risk sentiment and/or from easing market worries on Italy. EUR/USD filled offers north of 1.1640. However, European markets weren’t able to extend this positive trade as underlying uncertainty on global trade and on emerging markets persisted. European equities and the euro soon reversed a constructive start. ZEW German confidence improved, but it didn’t help sentiment on European markets. EUR/USD returned below the 1.16 big figure. Headlines on China calling for WTO sanctions against the US only added to global uncertainty. Global equities and the euro lost further ground awaiting next steps in the US trade policy. EUR/USD is trading in the 1.1580 area. USD/JPY also reversed part of this mornings’ gain and trades near 111.40.
Today, there was again plenty of UK headline news. However, this time it didn’t help to guide sterling trading. UK labour data (unemployment rate, job growth) were close to expectations, but weekly earnings ex bonuses printed at a stronger than expected 2.9 Y/Y. This indicates a further return to positive real wages. If this trend continues, at some point, it will become a factor for BoE policy. However, for now, it was enough to inspire further sterling gains. Later, the Chancellor of the Exchequer announced that BoE’s Carney will leave to BoE only at the end of January 2020, instead of June 2019. However, this bid for a continuation of policy throughout a key brexit era also didn’t impress sterling investors. EUR/GBP held a tight sideways range in the low 0.89 area. Cable lost slightly ground and is drifting below the 1.30 barrier.
News Headlines
UK labor market remains solid. Wages (excluding bonuses) did rise 2.9%Y/Y in the May/July period. Only 2.8% expected. In July alone, wages increased 3.1%, the fastest pace since 2015. The unemployment rate remains at a record low of 4%. On the other hand, job growth was disappointing.
Philip Hammond, UK chancellor, announced that Mark Carney will extend his mandate as governor of the Bank of England until the end of January 2020, which is seven months longer than normally foreseen. Carney has to provide continuity to the British economy in the months after March 2019, when it leaves the EU.
China will present a case next week to the World Trade Organization as it seeks to retaliate against the US for its non-compliance with a previous WTO ruling in 2017 over US dumping duties. The request is likely to lead to years of legal discord between the two nations whom are already fighting a trade war.
German economic sentiment rose for a second month in a row, with ZEW expectations index rising from -13.6 in August to -10.6 in September against a median estimate of -13.0. This small improvement occurs in a period of currency crises in Turkey and Argentina and remains still well below the long-term average of 22.9.
EU 50 Index Turns Bearish in Short-Term; Lacks Direction in Long-Term
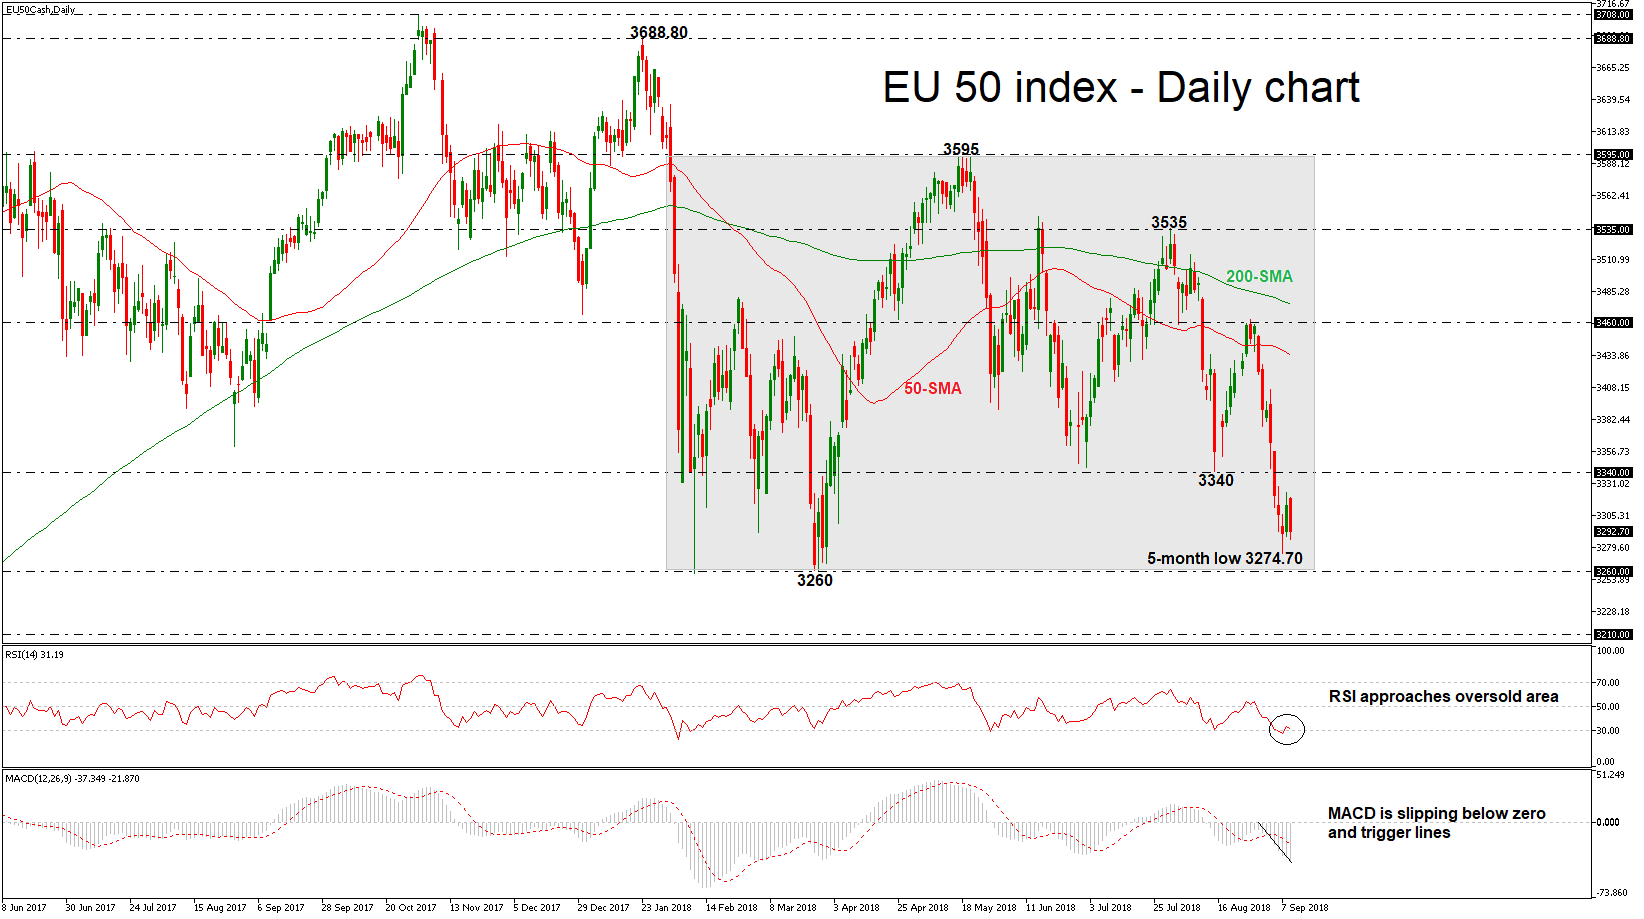
The EU 50 stock index has declined considerably after touching the 3460 resistance level, recording two straight bearish weeks. On Friday, the price posted a five-month low of 3274.70, while it is currently not far above that nadir. The momentum indicators are supportive of the bearish picture, with the RSI standing below the threshold of 50 and approaching the 30 oversold mark. Moreover, the MACD oscillator is falling sharply below the trigger and zero lines.
Immediate support is coming from the 3274.70 bottom, while an extension to the downside would increase the bearish pressure, hitting the 3210 hurdle, identified by the bottom on February 2017.
In the case of an upward attempt, the index could run towards the 3340 resistance barrier, taken from the troughs in the previous two months. A climb above this strong level would ease downside pressure in the short term and drive the price until the 50-day simple moving average (SMA) near 3434 at the time of writing. Slightly above this level, the 3460 resistance could act as a major obstacle for the bulls.
In the bigger picture, the index is neutral over the last seven months, but the risk is to the downside as it holds below the 50 and 200-day SMAs. The bulls would need to retake the 50-day SMA in order to regain the upper hand.
Canadian August Housing Starts Moderate
Highlights:
- August housing starts unexpectedly dropped 2.3% in the month to an annualized 201.0k from 205.8k in July. Market expectations had been a rebound in August starts to 216.3k largely premised on indications of still very robust housing permits data.
- August’s decline was largely split between urban single-detached units dropping 2.6% to 52.2k while the usually more volatile urban multiples dropped a marginally lesser 2.4% 132.7k. Rural starts averaged 16.1k little changed from July’s level.
Our Take:
August housing starts unexpectedly moderated to an annualized 201.0k which was down 2.3% from 205.8k in July. The slowing was in contrast to expectations going into the report for starts to bounce back to around 216k. These expectations were largely premised on building permits remaining very strong averaging 240k over the most recent three-month period ending in July. The strength in permits has been roughly consistent with housing starts averaging 222k over the first half of this year. However, this strength in both permits and starts has been surprising given the restraining effects of rising mortgage rates and tightening mortgage lending standards. These factors have had a noticeable dampening impact on housing resales which are down almost 20% over the first half of this year. Today’s report is indicative of these housing market headwinds starting to temper housing starts. Our expectation is these factors will keep starts close to 200k in the fourth quarter and further lowering the level of activity to 195k in 2019.
Canada Housing Starts Unexpectedly Drop in August
Canadian housing starts dipped to 201.0k (annualized) units in August, down 2.3% from July's 205.8k level. The pace disappointed forecasts calling for an increase to 216k. On a longer-term six month moving average basis, starts edged slightly lower to 215k.
Single-detached starts dropped 3% to 64k units. Meanwhile, multi-family construction fell 2% to 137k.
Urban starts fell in half of the provinces. Homebuilding pulled back notably in Quebec, with urban starts falling -6k to 28k units. Starts also fell in Ontario (-5k to 61k units) and three of four Atlantic Provinces (PEI providing the lone exception). Conversely, gains were recorded in Saskatchewan (+0.6k to 3k units), Alberta (+3k to 32k units) and B.C. (+4k to 46k units).
Starts dropped notably in Toronto (-11k to 29k units), Montreal (-6k to 12K units) and Vancouver (-0.5k to 25k units).
Key Implications
August's moderation in homebuilding, while surprising, is consistent with our view that starts will pull-back from their elevated first-half pace to a rate more in-line with underlying fundamentals. That said, homebuilding remains healthy when viewed on a trend basis, supported by robust population growth and firm economic conditions. Moreover, solid permit issuance points to homebuilding maintaining a healthy pace in the near-term.
For the third quarter, housing starts are averaging 203k, softer than the 218k pace averaged in the prior quarter. This suggests that the new housing construction component of residential investment will be somewhat softer in Q3. Still, residential investment overall is likely to add to growth, driven by rising resale activity.
BOE Preview- Upbeat about Recent Economic Developments, but Cautious over Brexit
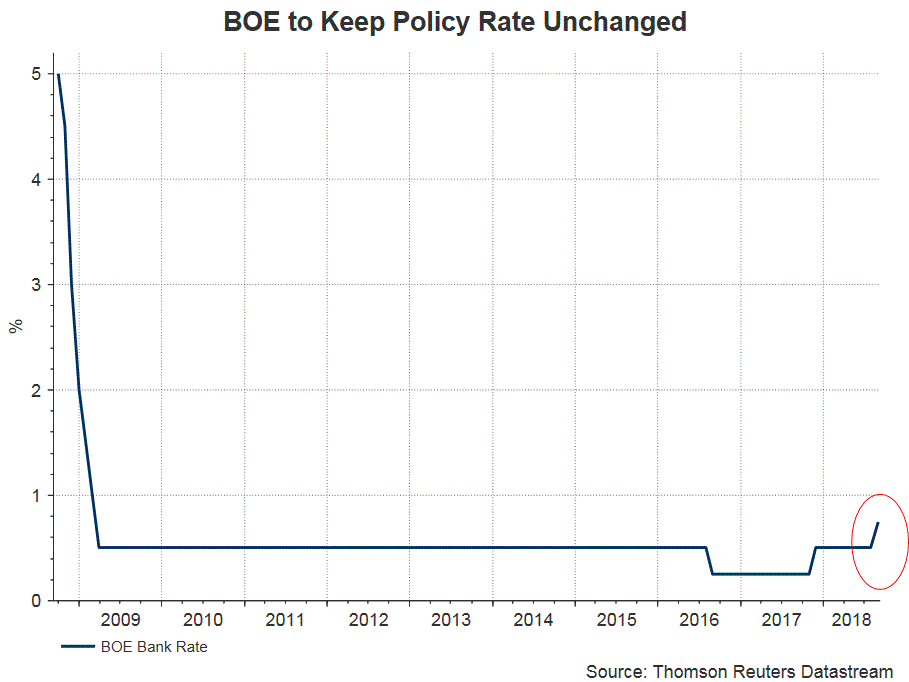
Following the August rate hike, BOE would likely keeps its powder dry at least until the Brexit Withdrawal deal is finalized. Macroeconomic indicators released since the last meeting contain both upside and downside surprises. Yet, the overall developments should keep BOE’s policy path, rate hike at “a gradual pace and to a limited extent”, intact. Meanwhile, we do not expect the meeting announcement would have much impact on the movement of British pound, which has been directed by Brexit headlines.
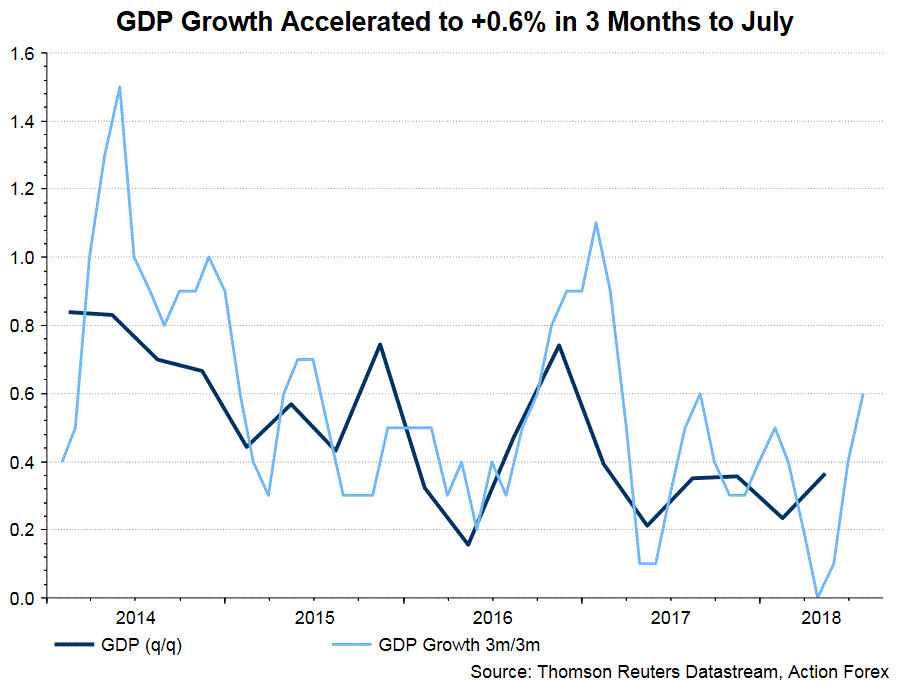
 GDP expanded +1.6% m/m in July, accelerating from +1.3% a month ago. This also beat consensus of +1.4% growth. From a 3m/3m basis, GDP growth accelerated to +0.6%, compared with +0.4% in 2Q18 and market expectations of +0.5%. Looking in the details, service sector output gained +0.3% m/m, driven by consumption related to World Cup. Meanwhile, construction activity soared +0.58% y/y. As noted in ONS’ accompanying statement, “growth in the economy picked up in the three months to July. Services grew particularly strongly, with retail sales performing well, boosted by warm weather and the World Cup. The construction sector also bounced back after a weak start to the year”. It also noted that “production fell back, with manufacturing again slipping a little while energy generation and supply fell due to reduced demand”.
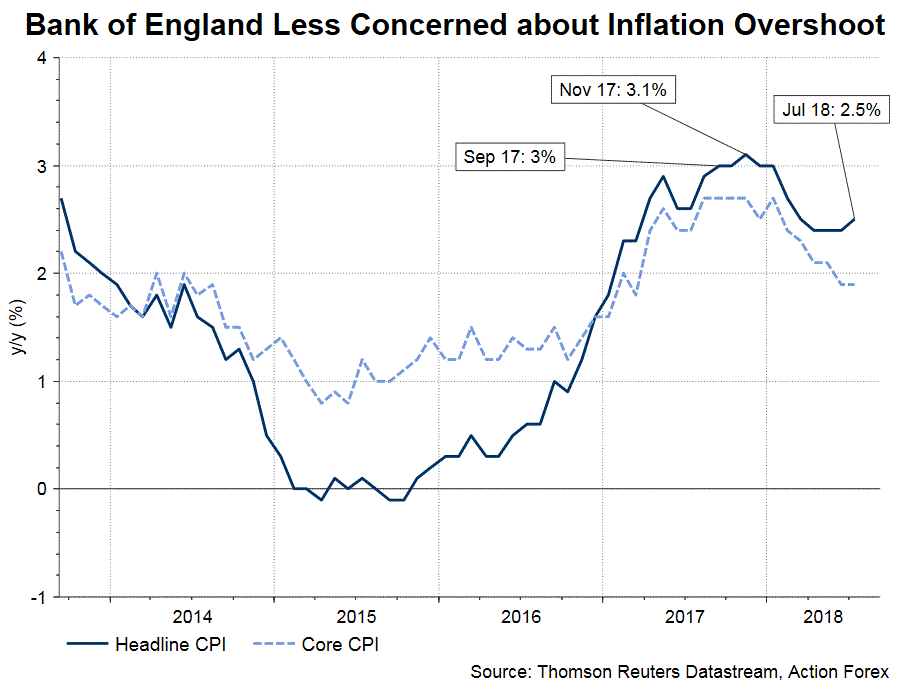
Headline CPI climbed higher to +2.5% y/y in July, up from +2.4% a month ago. Core CPI, excluding volatile food and fuel prices, steadied at +1.9%. It is the first time in 2018 that inflation has picked up. Like other central banks in advanced economies, BOE has set its inflation target at +2%. The central bank did raised the policy rate late last year so as to tame inflation which has peaked in +3.1% in November, mainly driven by higher import costs as a result of post-Brexit referendum selloff of British pound. The mild pick up in July inflation should not be a concern for BOE.
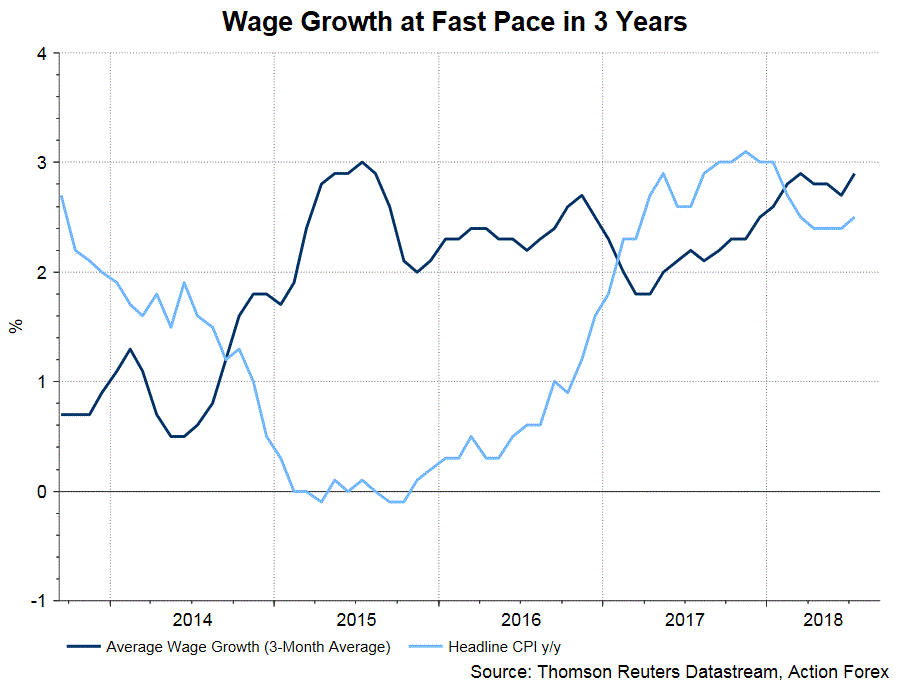
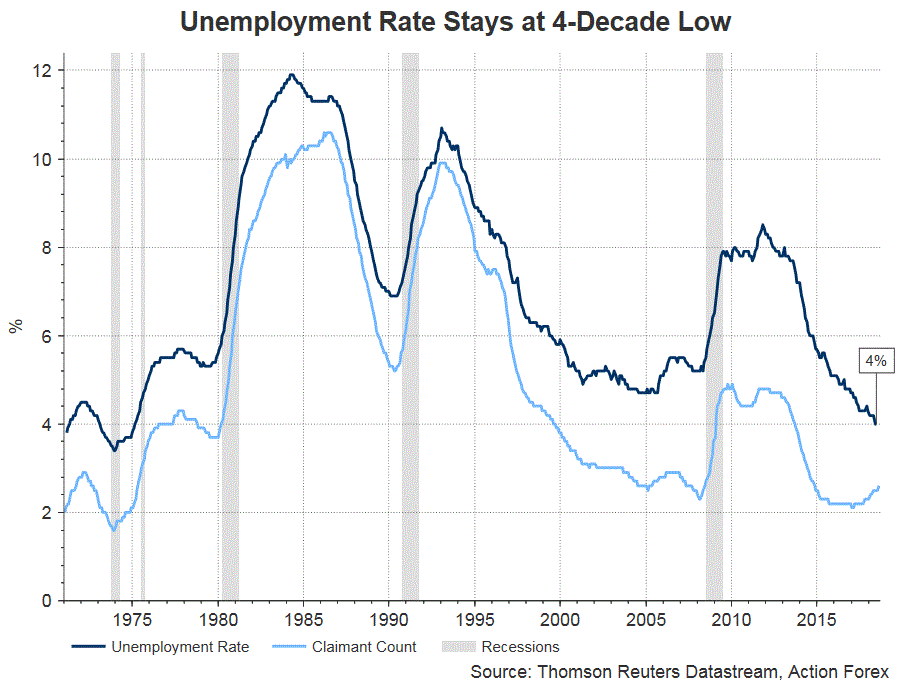
The employment situation remains resilient. The unemployment rate in the three months through July stayed at 4 decades' low of 4%. The biggest surprise came from wage growth. Average weekly earnings (excluding bonuses) in the three months to July jumped +2.9% y/y, up from +2.7% in June. This marks the strongest rate for three years.
However, business sentiment weakened further. Markit’s services PMI rose to 54.3 in August, up from 53.5 a month ago. However, business optimism fell to a 5- month low and “remained subdued in comparison to the long-run survey average”. As Markit suggested, “business expectations for the year ahead meanwhile sank markedly lower, down across all three sectors to one of the lowest levels seen since the EU referendum, largely reflecting increased anxiety over Brexit negotiations”. It added that “given the increasingly unbalanced nature of growth and the darkening business mood, risks to the immediate outlook seem tilted to the downside”.
Following the unanimous rate hike of +25 bps in August, the members would likely to stand on the sideline and reiterate that "any future increases in Bank Rate are likely to be at a gradual pace and to a limited extent”. While wage growth and GDP growth came in stronger than expected, these should not change the members' policy stance. They would prefer to wait for more details about the Brexit deal before another move.
GBP/USD Mid-Day Outlook
Daily Pivots: (S1) 1.2932; (P) 1.2992; (R1) 1.3087; More...
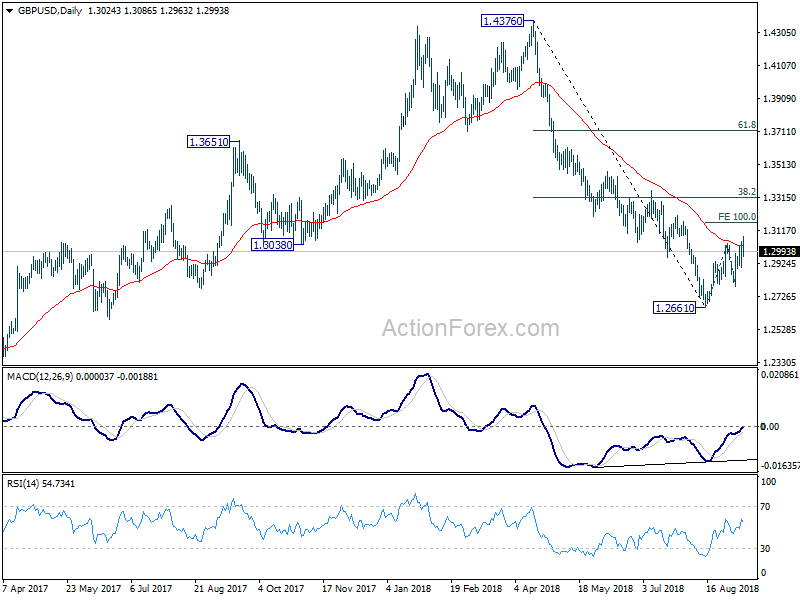
GBP/USD retreated after hitting 1.3086. But with 1.2896 minor support intact, further rally is expected to 100% projection of 1.2661 to 1.3042 from 1.2784 at 1.3165, and possibly above. However, we'd expect upside to be limited by 1.3316 key fibonacci level to complete the corrective rise and bring near term reversal. On the downside, break of 1.2896 minor support will now argue that rebound from 1.2661 has completed. In such case, intraday bias will be turned back to the downside for 1.2784 and then 1.2661.
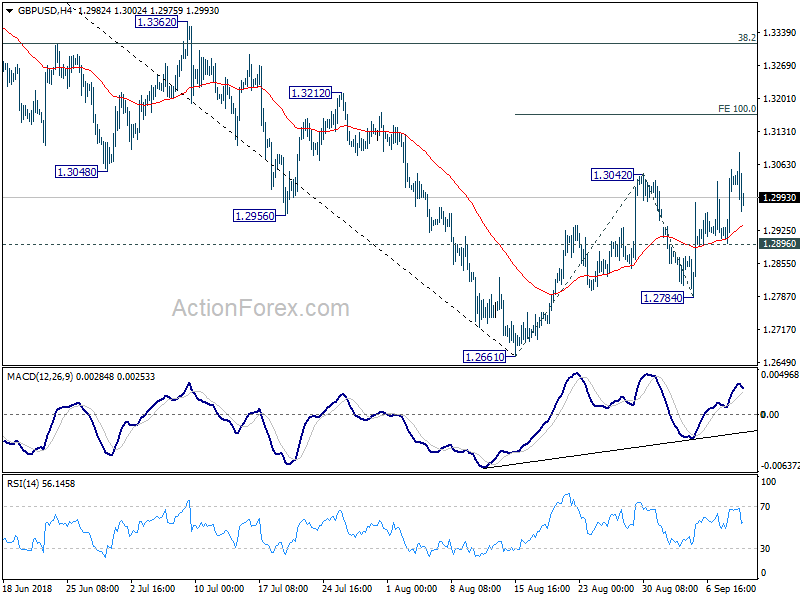
In the bigger picture, whole medium term rebound from 1.1946 (2016 low) should have completed at 1.4376 already, after rejection from 55 month EMA (now at 1.4099). The structure and momentum of the fall from 1.4376 argues that it's resuming long term down trend. And this will be the preferred case as long as 38.2% retracement of 1.4376 to 1.2661 at 1.3316 holds. However, firm break of 1.3316 would bring stronger rebound to 61.8% retracement at 1.3721. And, the eventual depth of the fall from 1.4376, and the chance of hitting 1.1946 low, will depend on the strength of the interim corrective rebound from 1.2661.
EUR/USD Mid-Day Outlook
Daily Pivots: (S1) 1.1542; (P) 1.1579; (R1) 1.1632; More.....
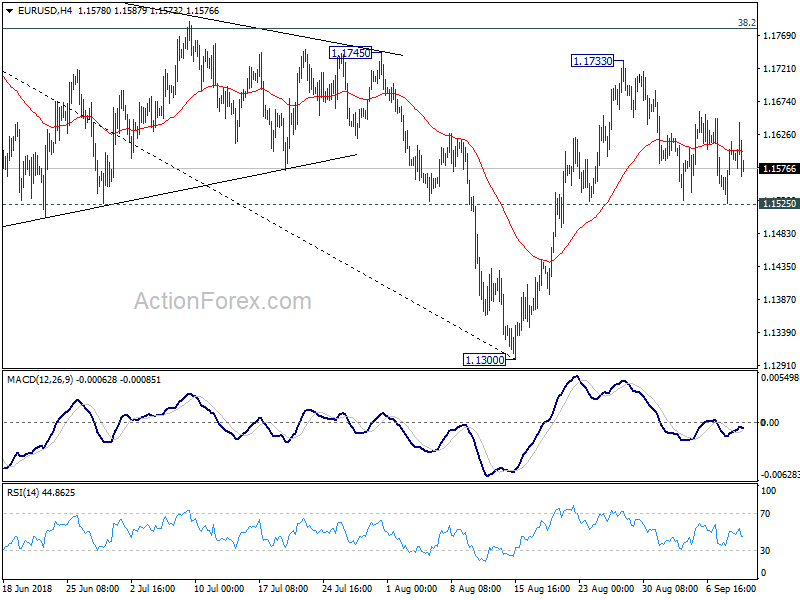
Range trading continues in EUR/USD and intraday bias remains neutral. Rebound from 1.1300 could extend with another rise. But upside should be limited by 38.2% retracement of 1.2555 to 1.1300 at 1.1779, at least on first attempt. On the downside, break of 1.1525 will indicate completion of the rebound and turn bias to the downside for retesting 1.1300 low. Overall, price actions from 1.1300 are forming a corrective pattern, that could extend for a while before completion.
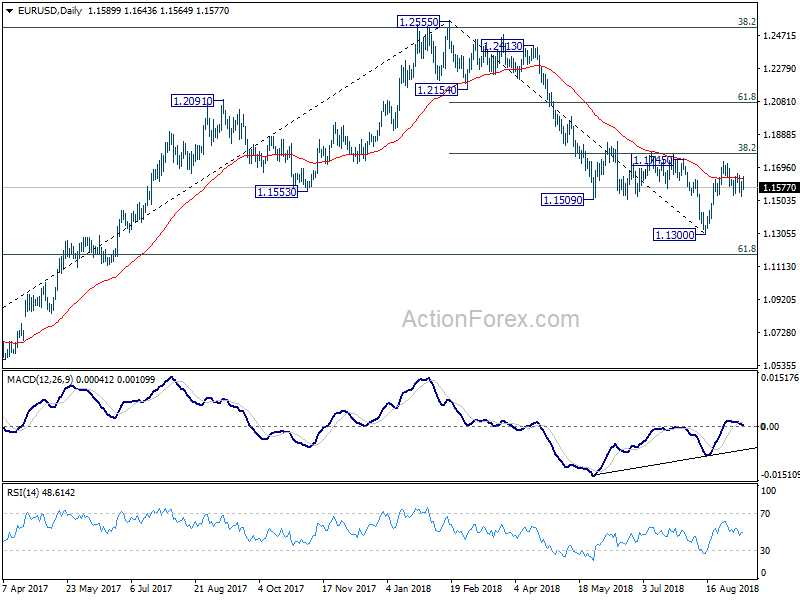
In the bigger picture, a medium term bottom should be in place at 1.1300, on bullish convergence condition in daily MACD and some consolidations would be seen. But still, note that EUR/USD was rejected by 38.2% retracement of 1.6039 (2008 high) to 1.0339 (2017 low) at 1.2516. That carries some long term bearish implications. Thus, we'd expect fall from 1.2555 high to resume after consolidation completes. Below 1.1300 should send EUR/USD through 61.8% retracement of 1.0339 to 1.2555 at 1.1186. And, in that case, EUR/USD would head to retest 1.0339 (2017 low).
USD/CHF Mid-Day Outlook
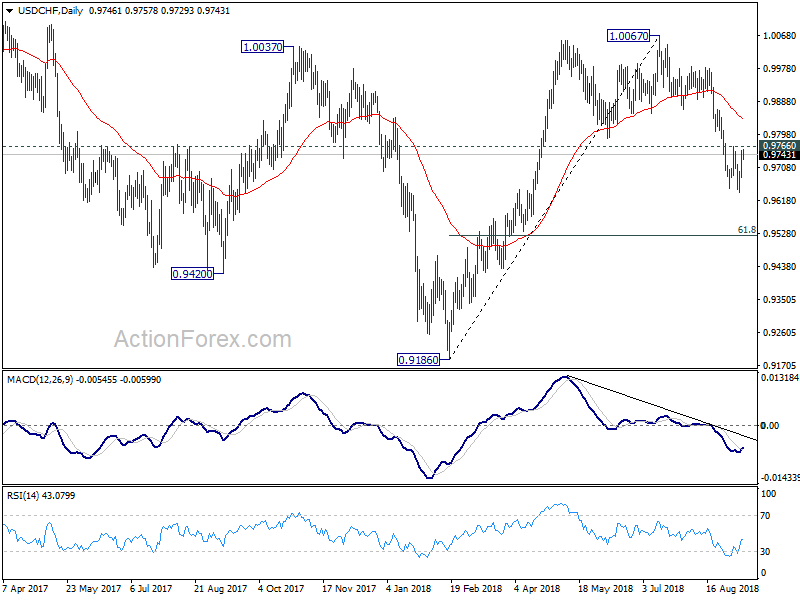
Daily Pivots: (S1) 0.9698; (P) 0.9727; (R1) 0.9778; More.....
USD/CHF continues to stay in range below 0.9766 resistance and intraday bias remains neutral. On the upside, firm break of 0.9766 will argue that the fall from 1.0067 is finished. Intraday bias should then be turned back to the upside for 0.9866 support turned resistance for confirmation. On the downside, however, break of 0.9640 will resume the decline from 1.0067 for 0.9523 fibonacci level next.
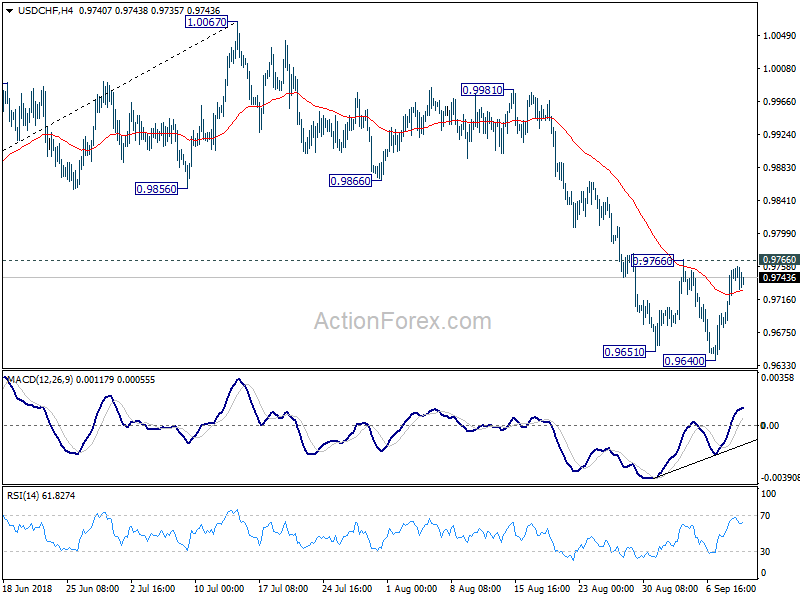
In the bigger picture, current development suggests that rise from 0.9186 low has completed at 1.0067, after failing to sustain above 1.0037 resistance. Fall from 1.0067 could extend to 61.8% retracement of 0.9816 to 1.0067 at 0.9523 and below. But for now, we don't expect a break of 0.9186 low. On the upside, firm break of 0.9866 support turned resistance will suggests that fall from 1.0067 has completed and rise from 0.9186 is resuming.
USD/JPY Mid-Day Outlook
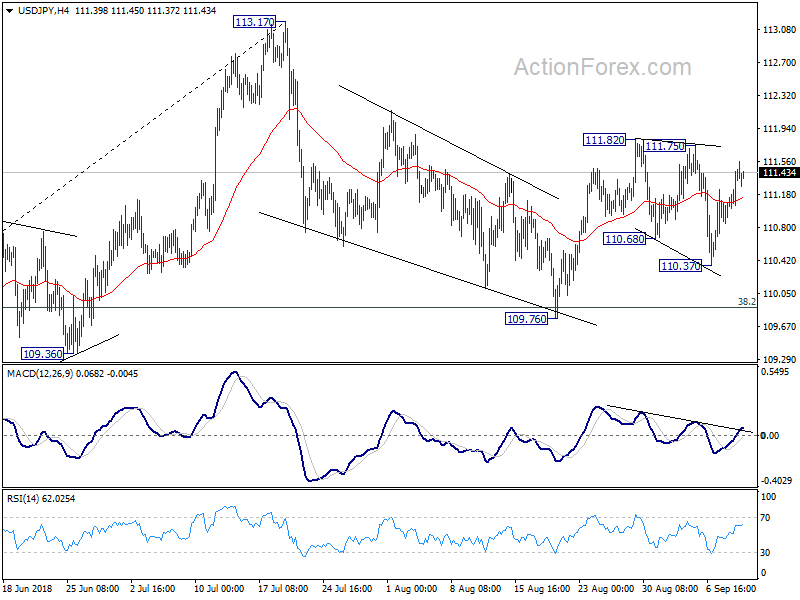
Daily Pivots: (S1) 110.90; (P) 111.07; (R1) 111.30; More...
USD/JPY is still staying in range of 110.37/111.82. Intraday bias remains neutral at this point. On the upside, break of 111.73 minor resistance will extend the rebound from 109.76. In that case, intraday bias will be turned back to the upside for retesting 113.17 high. Decisive break there will resume larger rally from 104.62. On the downside, below 110.37 will bring deeper fall. But strong support is expected from 38.2% retracement of 104.62 to 113.17 at 109.90 to contain downside and bring rebound.
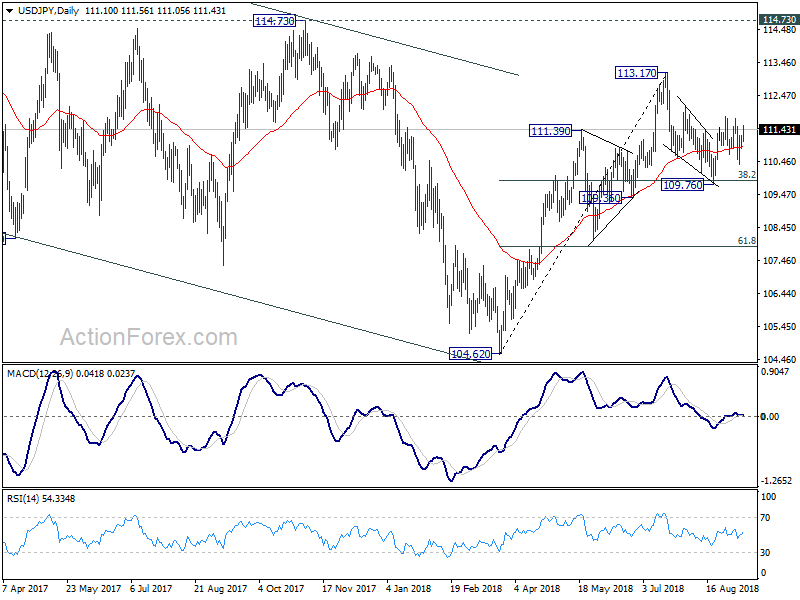
In the bigger picture, corrective fall from 118.65 (2016 high) should have completed with three waves down to 104.62. Decisive break of 114.73 resistance will likely resume whole rally from 98.97 (2016 low) to 100% projection of 98.97 to 118.65 from 104.62 at 124.30, which is reasonably close to 125.85 (2015 high). This will stay as the preferred case as long as 109.36 support holds. However, decisive break of 109.36 will mix up the outlook again. And deeper fall should be seen back to 61.8% retracement of 104.62 to 113.17 at 107.88 and below.
GBPUSD Outlook: Bad Execution and Fresh Risk Aversion Sour N/T Sentiment and Send Pound Lower
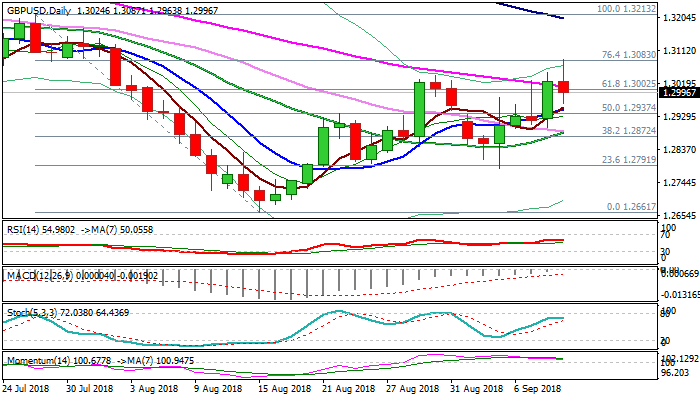
Cable entered American session on Tuesday in red after full figure dip from new five week high at 1.3087, caused by badly executed sell order, prompted investors to exit long positions. The pound was hit further by announcement that BoE Governor Carney will extend his term in the central bank for seven months. The pair extended weakness to new daily low at 1.2963 on soured near-term sentiment, despite better than expected UK jobs data (avg. earnings rose 2.6% in July vs 2.4% f/c while jobless claims fell below expectations in Aug (8.7K vs 10.0K f/c). Fresh weakness was also helped by renewed risk aversion on rising concerns about US-China trade conflict, as China responded to the recent action of the United States. The pair returned below broken falling 55SMA, with close below to neutralize initial positive signal and risk deeper pullback. South-heading 14-d momentum created bear-cross and moves towards negative territory, supporting the notion, as falling daily cloud is thickening and continues to weigh.
Res: 1.3087; 1.3104; 1.3162; 1.3196
Sup: 1.3043; 1.3014; 1.3000; 1.2970