Sample Category Title
USD/CAD Daily Outlook
Daily Pivots: (S1) 1.3014; (P) 1.3094; (R1) 1.3147; More...
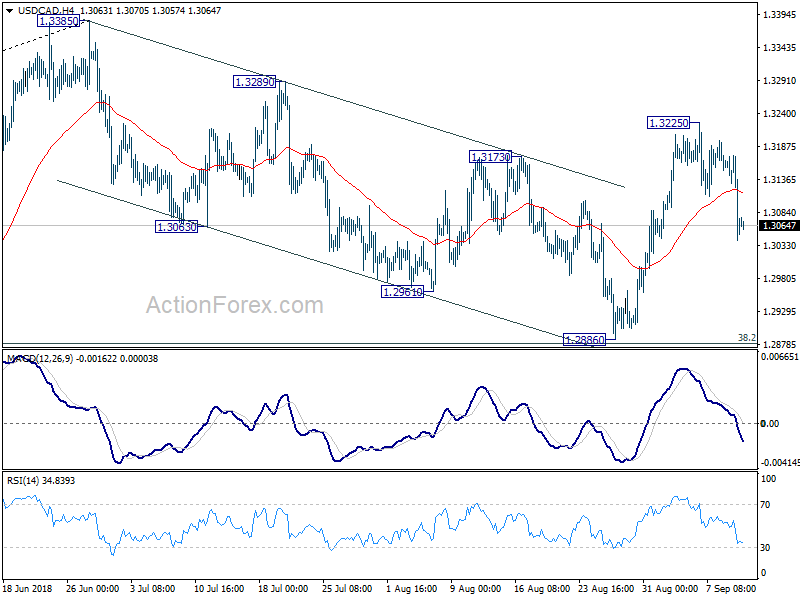
USD/CAD's pull back from 1.3325 extended lower but over outlook is unchanged. Downside should be contained well above 1.2886 to bring rally resumption. We're holding on to the view that corrective fall from 1.3385 has completed at 1.2886 already. Above 1.3225 will turn intraday bias back to the upside and bring retest of 1.3385 first.
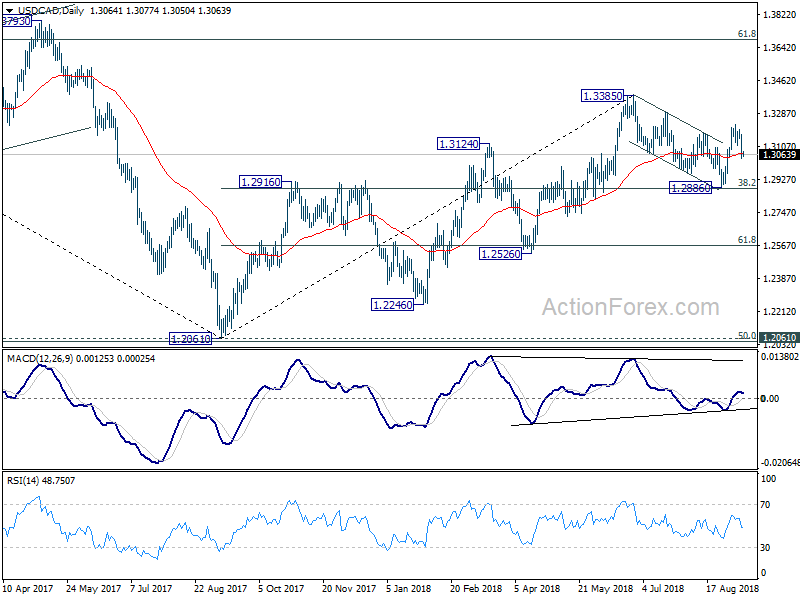
In the bigger picture, strong rebound ahead of 38.2% retracement of 1.2061 to 1.3385 at 1.2879 key fibonacci level retains medium term bullishness. That is, rise from 2017 low at 1.2061 is still in progress. Break of 1.3384 should target 61.8% retracement of 1.4689 (2015 high) to 1.2061 (2017 low) at 1.3685. On the downside, as long as 1.2886 support holds, outlook will now remain bullish.
AUD/USD Daily Outlook
Daily Pivots: (S1) 0.7094; (P) 0.7112; (R1) 0.7138; More...
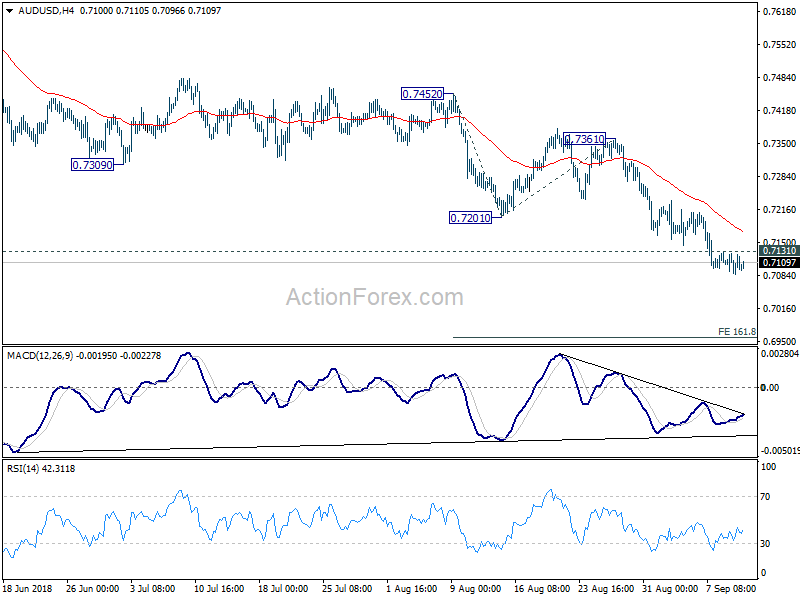
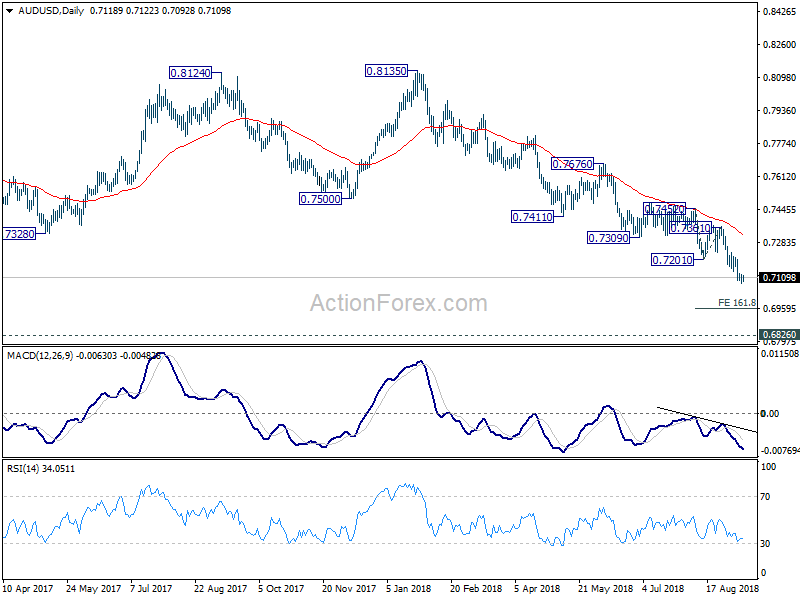
With 0.7131 minor resistance intact, intraday bias stays mildly on the downside. Current fall is part of the down trend from 0.8135. Next target is 161.8% projection of 0.7452 to 0.7201 from 0.7361 at 0.6955. Break will target key support level at 0.6826. On the upside, above 0.7131 minor resistance will turn intraday bias neutral and bring consolidations first, before staging another decline.
In the bigger picture, rebound from 0.6826 (2016 low) is seen as a corrective move that should be completed at 0.8135. Fall from there would extend to have a test on 0.6826. There is prospect of resuming long term down trend from 1.1079 (2011 high). Current downside momentum as seen in daily and weekly MACD support this bearish case. Firm break of 0.6826 will target 0.6008 key support next (2008 low). On the upside, break of 0.7361 resistance is needed to be the first sign of medium term bottoming. Otherwise, outlook will remain bearish even in case of strong rebound.
EUR/USD Daily Outlook
Daily Pivots: (S1) 1.1566; (P) 1.1605; (R1) 1.1644; More.....
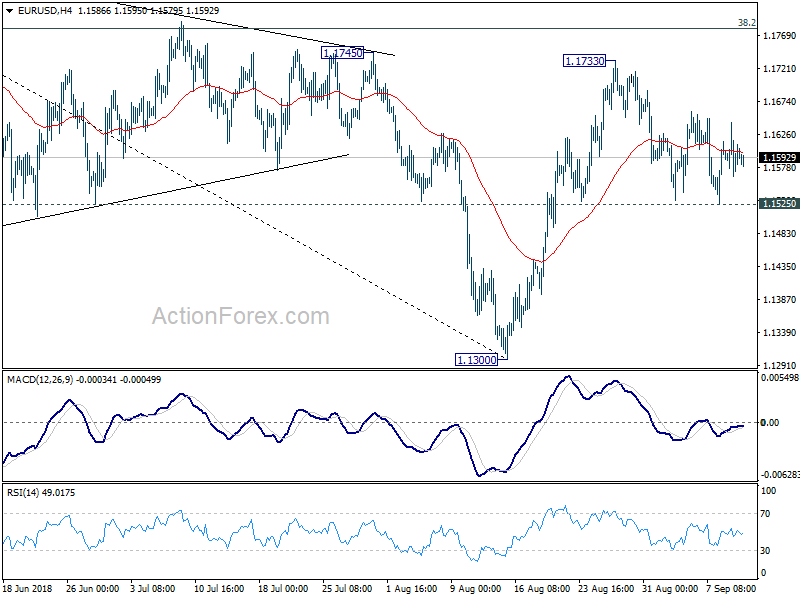
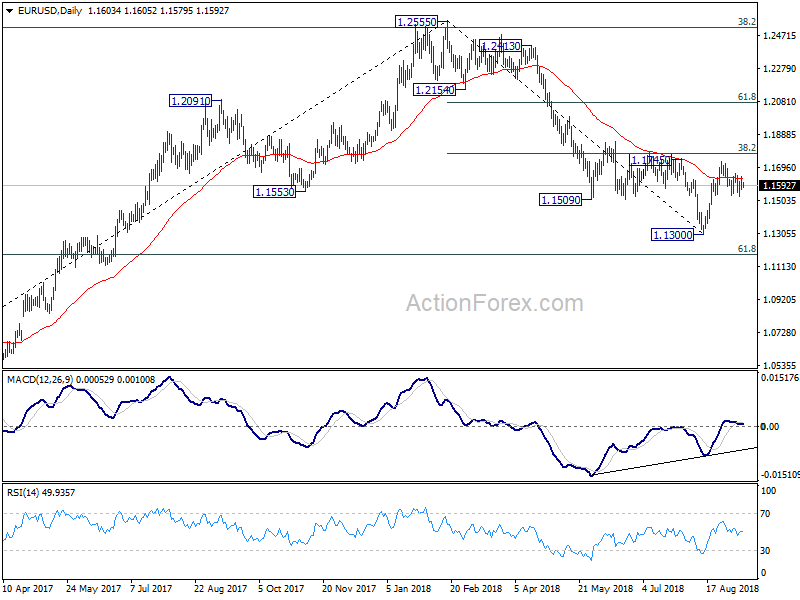
Intraday bias in EUR/USD remains neutral at this point and outlook is unchanged. Rebound from 1.1300 could extend with another rise. But upside should be limited by 38.2% retracement of 1.2555 to 1.1300 at 1.1779, at least on first attempt. On the downside, break of 1.1525 will indicate completion of the rebound and turn bias to the downside for retesting 1.1300 low. Overall, price actions from 1.1300 are forming a corrective pattern, that could extend for a while before completion.
In the bigger picture, a medium term bottom should be in place at 1.1300, on bullish convergence condition in daily MACD and some consolidations would be seen. But still, note that EUR/USD was rejected by 38.2% retracement of 1.6039 (2008 high) to 1.0339 (2017 low) at 1.2516. That carries some long term bearish implications. Thus, we'd expect fall from 1.2555 high to resume after consolidation completes. Below 1.1300 should send EUR/USD through 61.8% retracement of 1.0339 to 1.2555 at 1.1186. And, in that case, EUR/USD would head to retest 1.0339 (2017 low).
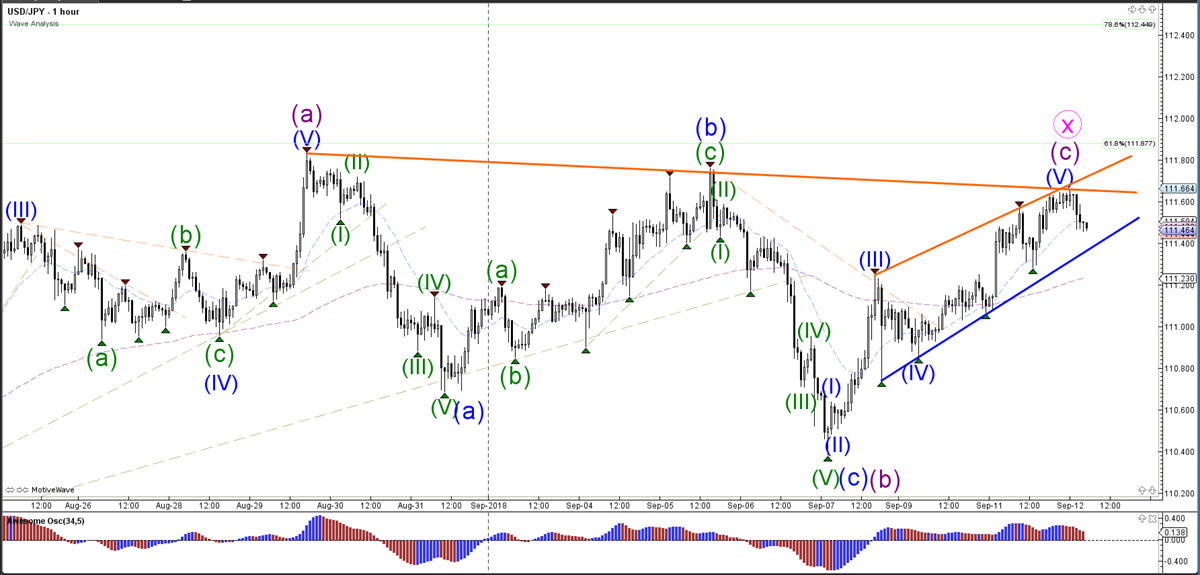
USD/JPY Trend Depends On Breakout Direction At Resistance
The USD/JPY bounced at the resistance trend line, but remains in the bullish channel. A break above the resistance could indicate a breakout towards the next 78.6% Fibonacci retracement level, whereas a break below the channel indicates a potential move down to the next support (blue) trend line. The price could be building a bullish wave C (purple) within a larger wave X (pink) correction.
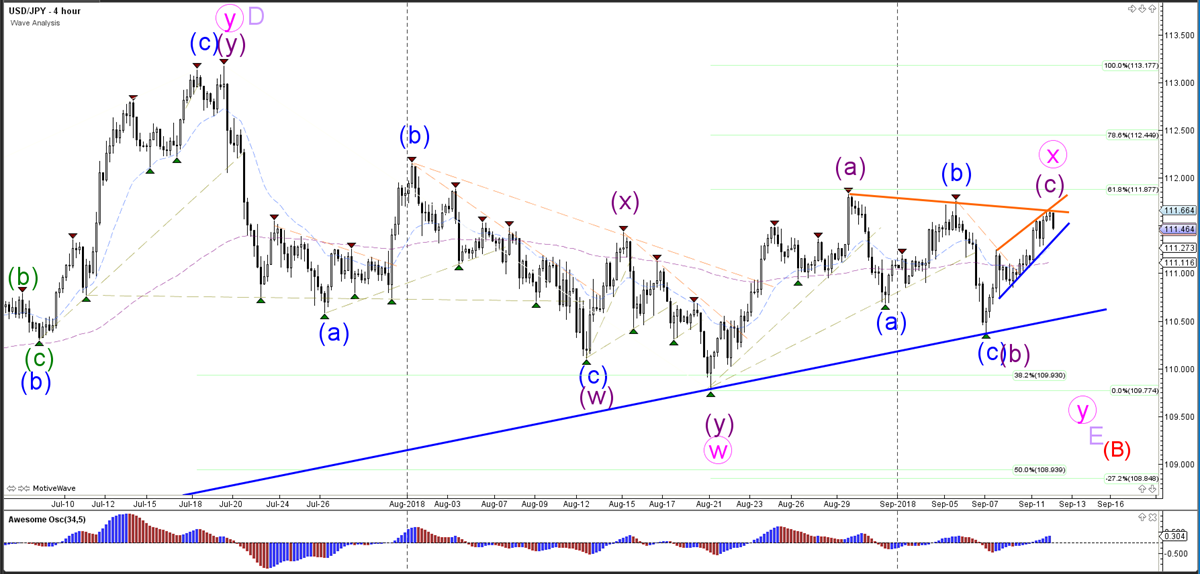
The USD/JPY seems to have completed a 5th wave (blue) at the resistance, although a bullish breakout could extend the wave 5. A bearish breakout could start the wave Y (pink) of the 4 hour chart.
GBP/USD Daily Outlook
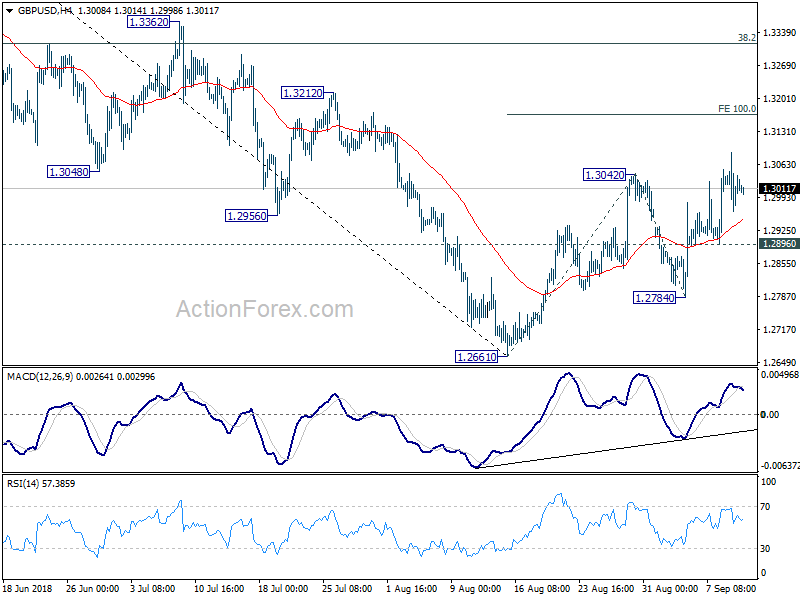
Daily Pivots: (S1) 1.2974; (P) 1.3031; (R1) 1.3089; More...
No change in GBP/USD's outlook. With 1.2896 minor support intact, further rally is expected to 100% projection of 1.2661 to 1.3042 from 1.2784 at 1.3165, and possibly above. However, we'd expect upside to be limited by 1.3316 key fibonacci level to complete the corrective rise and bring near term reversal. On the downside, break of 1.2896 minor support will now argue that rebound from 1.2661 has completed. In such case, intraday bias will be turned back to the downside for 1.2784 and then 1.2661.
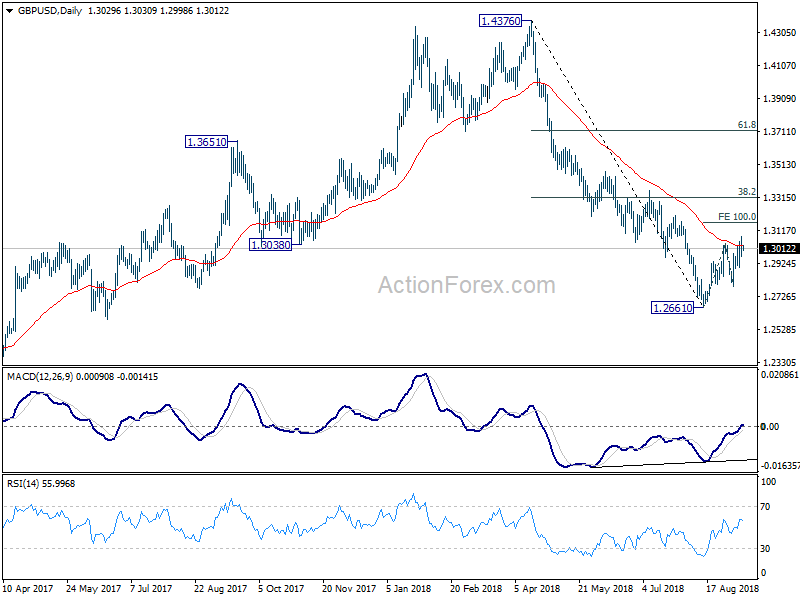
In the bigger picture, whole medium term rebound from 1.1946 (2016 low) should have completed at 1.4376 already, after rejection from 55 month EMA (now at 1.4099). The structure and momentum of the fall from 1.4376 argues that it's resuming long term down trend. And this will be the preferred case as long as 38.2% retracement of 1.4376 to 1.2661 at 1.3316 holds. However, firm break of 1.3316 would bring stronger rebound to 61.8% retracement at 1.3721. And, the eventual depth of the fall from 1.4376, and the chance of hitting 1.1946 low, will depend on the strength of the interim corrective rebound from 1.2661.
GBP/USD Bearish Pullback Bounces At 61.8% Fibonacci
The GBP/USD bullish breakout is showing volatile price action after pushing through the resistance trend line (dotted orange). Price will need to break a next trend line to confirm the direction.
The GBP/USD needs to push above the resistance trend line (red) for a bullish breakout and continuation towards the next 38.2% Fibonacci retracement level at 1.3250-1.33. A bearish breakout could change the likely wave patterns and the completion of waves Y at the recent high is possible.

The GBP/USD made a bearish retracement after completing a bullish wave 5 (orange). The pullback could be part of a wave B (green) and price indeed bounced at the 61.8% Fib. The next breakout however remains key.

USD/CHF Daily Outlook
Daily Pivots: (S1) 0.9709; (P) 0.9734; (R1) 0.9750; More.....
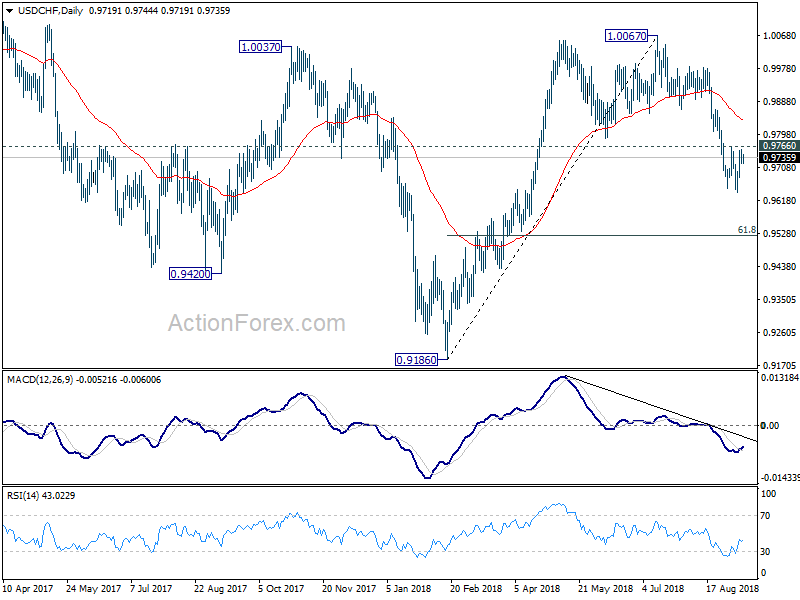
Intraday bias in USD/CHF remains neutral for the moment with focus on 0.9766 resistance. Decisive break there will argue that the fall from 1.0067 is finished. Intraday bias should then be turned back to the upside for 0.9866 support turned resistance for confirmation. On the downside, however, break of 0.9640 will resume the decline from 1.0067 for 0.9523 fibonacci level next.
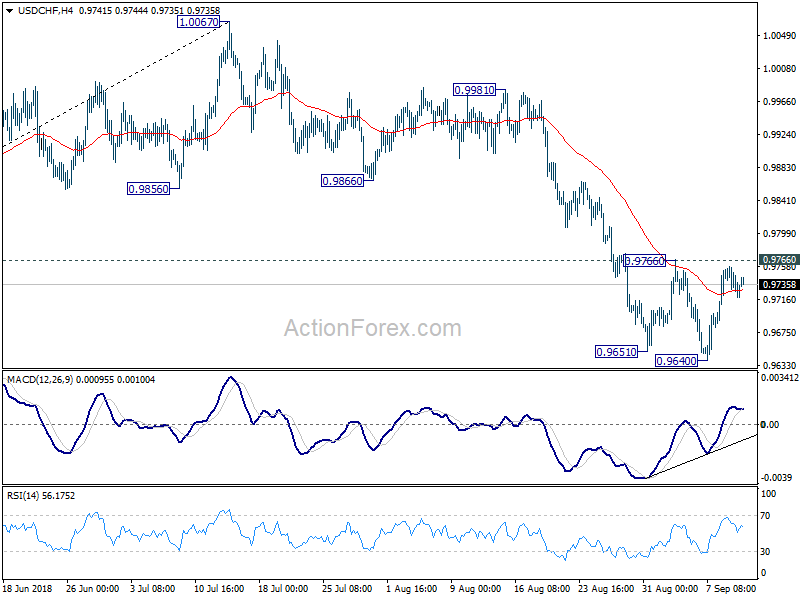
In the bigger picture, current development suggests that rise from 0.9186 low has completed at 1.0067, after failing to sustain above 1.0037 resistance. Fall from 1.0067 could extend to 61.8% retracement of 0.9816 to 1.0067 at 0.9523 and below. But for now, we don't expect a break of 0.9186 low. On the upside, firm break of 0.9866 support turned resistance will suggests that fall from 1.0067 has completed and rise from 0.9186 is resuming.
Euro Reverses Its Gains In The Morning Session
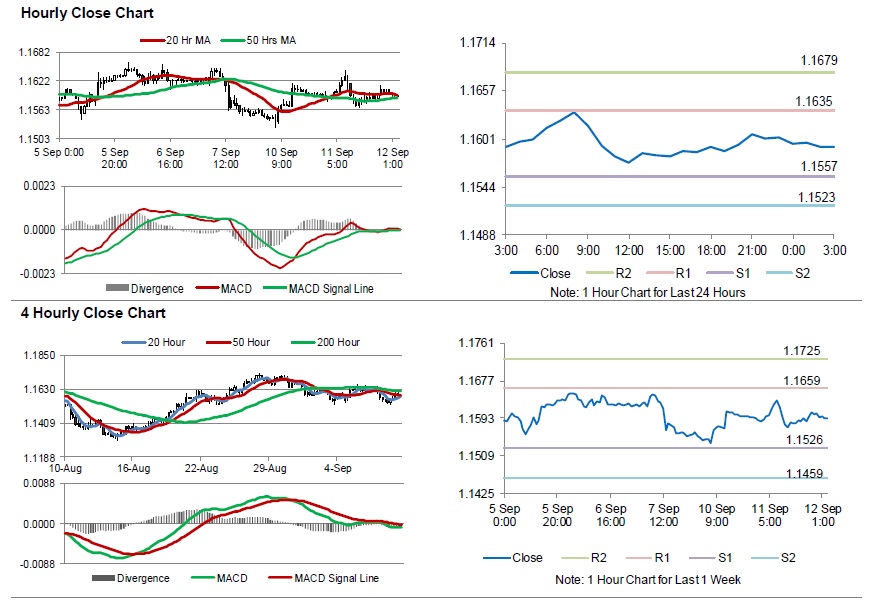
For the 24 hours to 23:00 GMT, the EUR rose 0.07% against the USD and closed at 1.1603.
On the macro front, the Euro-zone's ZEW economic sentiment index climbed to a level of -7.2 in September, following a reading of -11.1 in the prior month.
Meanwhile, in Germany, the ZEW economic sentiment index advanced to a 4-month high level of -10.6 in September, higher than market expectations for an advance to a level of -13.0. The index had registered a level of -13.7 in the previous month. However, the ZEW survey current situation index unexpectedly advanced to a level of 76.0 in September, compared to a reading of 72.6 in the prior month.
In the US, data showed that the NFIB small business optimism index jumped to a level of 108.8 in August, helped by President, Donald Trump's tax policies and notching its highest level in 45 years. The index had recorded a reading of 107.9 in the previous month, while market participants had anticipated for a rise to a level of 108.1.
In the Asian session, at GMT0300, the pair is trading at 1.1592, with the EUR trading 0.09% lower against the USD from yesterday's close.
The pair is expected to find support at 1.1557, and a fall through could take it to the next support level of 1.1523. The pair is expected to find its first resistance at 1.1635, and a rise through could take it to the next resistance level of 1.1679.
Moving forward, investors would closely monitor Euro-zone's industrial production for July, set to release in a few hours. Later in the day, the US producer price index for August and the Federal Reserve Beige Book report will keep traders on their toes.
The currency pair is showing convergence with its 20 Hr and 50 Hr moving averages.
Britain’s Jobless Rate Lowest Since 1975, Earnings Growth Exceeds Estimates
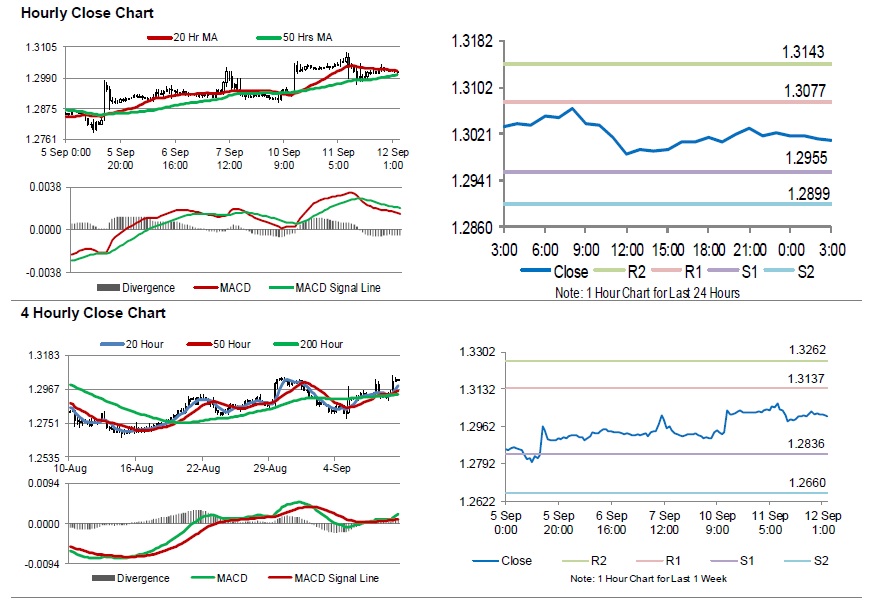
For the 24 hours to 23:00 GMT, the GBP slightly fell against the USD and closed at 1.3023, after UK's Chancellor, Philip Hammond stated that time was running out to secure a Brexit deal.
On the data front, UK's ILO unemployment rate remained steady at a rate of 4.0% in the three months period of May-July 2018 period, registering its lowest rate since February 1975 and in line with market expectations.
Meanwhile, the nation's average earnings including bonus climbed 2.6% on an annual basis in the May-July 2018 period, compared to an advance of 2.4% in April-June 2018. Markets participants had anticipated average earnings to rise 2.5%.
In the Asian session, at GMT0300, the pair is trading at 1.3011, with the GBP trading 0.09% lower against the USD from yesterday's close.
The pair is expected to find support at 1.2955, and a fall through could take it to the next support level of 1.2899. The pair is expected to find its first resistance at 1.3077, and a rise through could take it to the next resistance level of 1.3143.
With no macroeconomic releases in Britain today, investor sentiment would be governed by global macroeconomic events.
The currency pair is showing convergence with its 20 Hr and 50 Hr moving averages.
Japan’s Machine Tool Orders Advanced In August
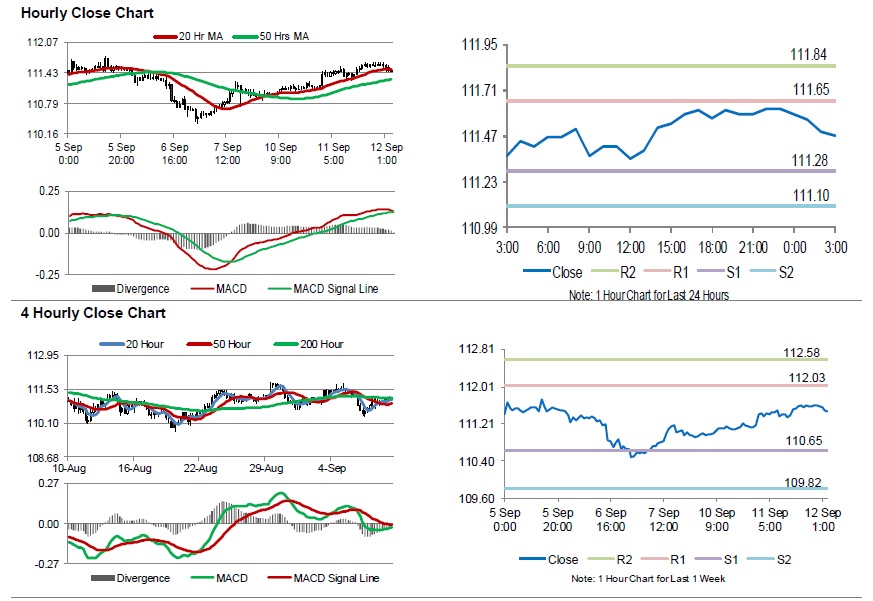
For the 24 hours to 23:00 GMT, the USD rose 0.42% against the JPY and closed at 111.61.
In economic news, Japan's flash machine tool orders rose 5.3% on a yearly basis in August, compared to a rise of 13.1% in the preceding month.
In the Asian session, at GMT0300, the pair is trading at 111.47, with the USD trading 0.13% lower against the JPY from yesterday's close.
The pair is expected to find support at 111.28, and a fall through could take it to the next support level of 111.10. The pair is expected to find its first resistance at 111.65, and a rise through could take it to the next resistance level of 111.84.
Looking forward, investors would focus on Japan's machinery orders for July, scheduled to release overnight.
The currency pair is showing convergence with its 20 Hr moving average and trading above its 50 Hr moving average.