Sample Category Title
GBP Jumps On Brexit Comments, GDP Rises More Than Expected
The UK's GDP data released yesterday showed that the monthly gross domestic product increased 0.3% on the month. The data beat estimates of a 0.2% increase and up from 0.1% previously. However, manufacturing production fell 0.2%. Construction output surprised, rising 0.5%. The data beat estimates of a 0.4% decline.
The British pound surged strongly on the day after reports of the EU Chief negotiator's Michel Barnier's comments about Brexit. The U.S. dollar eased back on the Brexit developments.
The EU trading session will start with the UK's jobs report. Economists polled expect the UK's unemployment rate to remain steady at 4.0%, unchanged from the previous month. Average earnings are forecast to rise 2.5% over the three months ending August.
In the Eurozone, the German ZEW economic sentiment is expected to show -13.4. The NY trading session is quiet with only the wholesale inventories report coming out. Canada will be releasing the housing starts data which is expected to rise 218k.
Dollar Strength Pushes Aussie To 29-Month Low
The GBP/USD pair jumped to above 1.3000 after chief EU negotiator, Michel Barnier, said that a Brexit deal with the UK looked realistic in a timeframe of 6 to 8 weeks. Just last week, it was reported that Germany and the UK had made key Brexit progress with such headlines being viewed as positive by traders who feared a hard Brexit. Today, the sterling will likely make more swings as the UK releases employment data for August.
Trade talks between the United States and Canada are set to resume today. This will be earlier than expected as the two countries try to find a middle ground on key issues. The Trump administration hopes that the deals with Mexico and Canada will be reconciled before the end of the month.
The euro will be a key currency to watch today as we receive the Zentrum für Europäische Wirtschaftsforschung (ZEW) confidence numbers for Germany and the EU. Traders expect that the confidence numbers for Germany will be minus 14.0, which will be worse than last month’s minus 13.7. This number turned negative in April this year and started to deteriorate, with many executives expressing their fears about the risk of losing the valuable US market. Data from the EU is expected to improve slightly from minus 11.1 to minus 10.9. Two weeks ago, the EU suggested that the US and the EU remove all tariffs on vehicles, a measure that the US president criticized for not being strong enough. Today’s data will tell us what the EU leaders think about the current state of affairs about trade.
EUR/USD
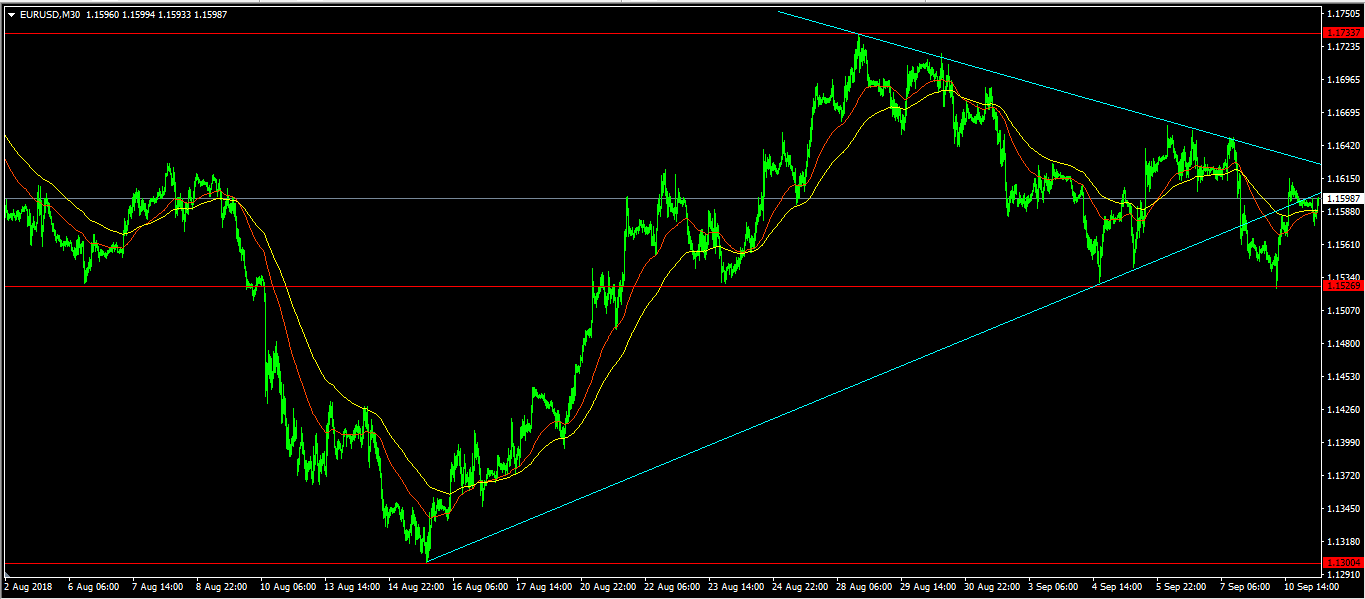
The EUR/USD pair is little moved in the Asia-Pacific session as traders wait for EU sentiment data. It is now trading at 1.1598, which is higher than yesterday’s intraday low of 1.1526. It is also slightly above the 61.8% Fibonacci Retracement level and along the important support level shown below. It is also slightly above the 50 and 100-day EMA. The pair is likely to move sideways as traders wait for EU economic data and the ECB interest rate decision on Thursday.
GBP/USD
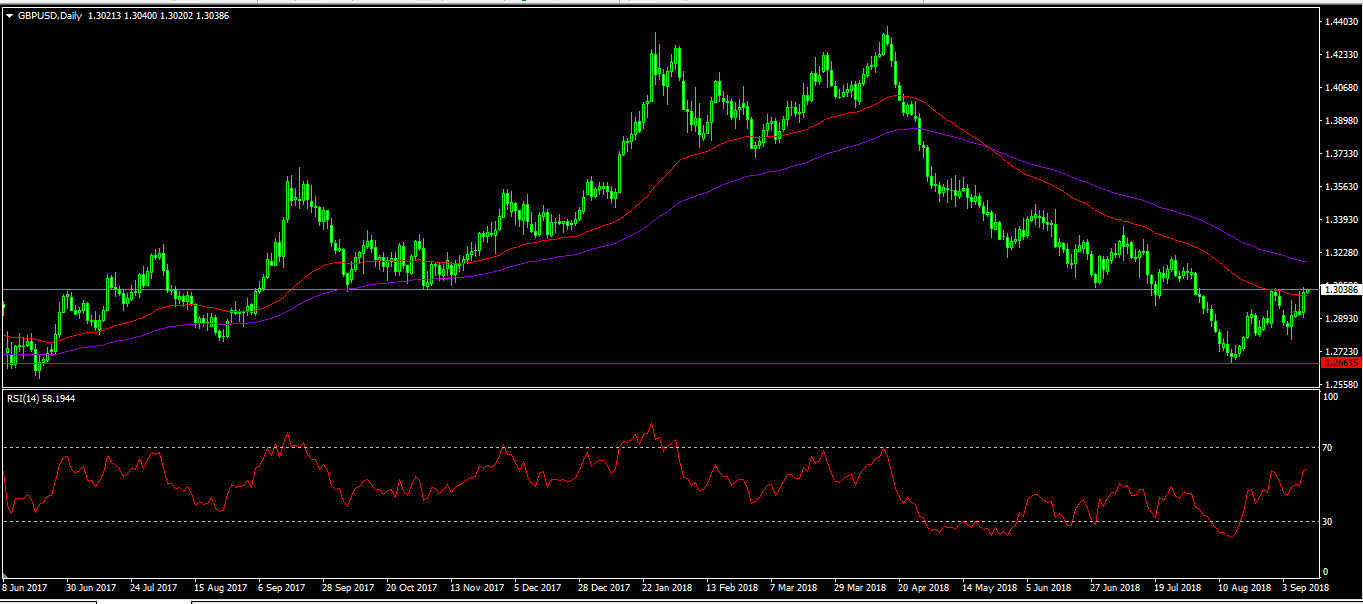
In early August, the GBP/USD pair reached a low of 1.2660. This was the lowest level since June 2017. Since then, the pair has been moving up and today, it reached an intraday high of 1.3053. This was the one-month high for the pair. The RSI for the pair on the daily chart is at 58 and heading higher. The shorter-term EMA (50) is attempting to cross the longer-term EMA (100). If the crossover happens, the pair is likely to continue moving higher.
AUD/USD
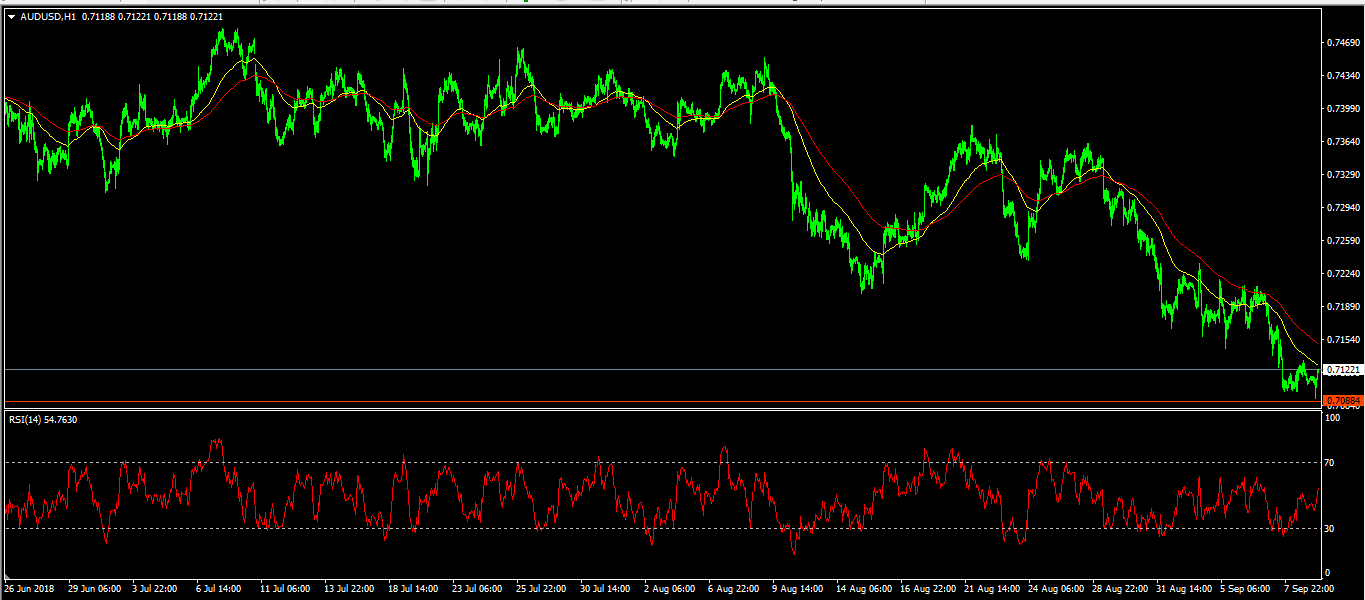
The AUD/USD pair declined to an intraday low of 0.7088. This was the lowest level in 29-months. The decline was associated largely with a stronger USD. It is now trading at 0.7121, which is lower than the 50 and 100-day EMA. The RSI on the hourly chart is at 53 and headed higher. The pair could continue the downward momentum and test the 0.7000 level.
GBPUSD Bearish Price Divergence Forming
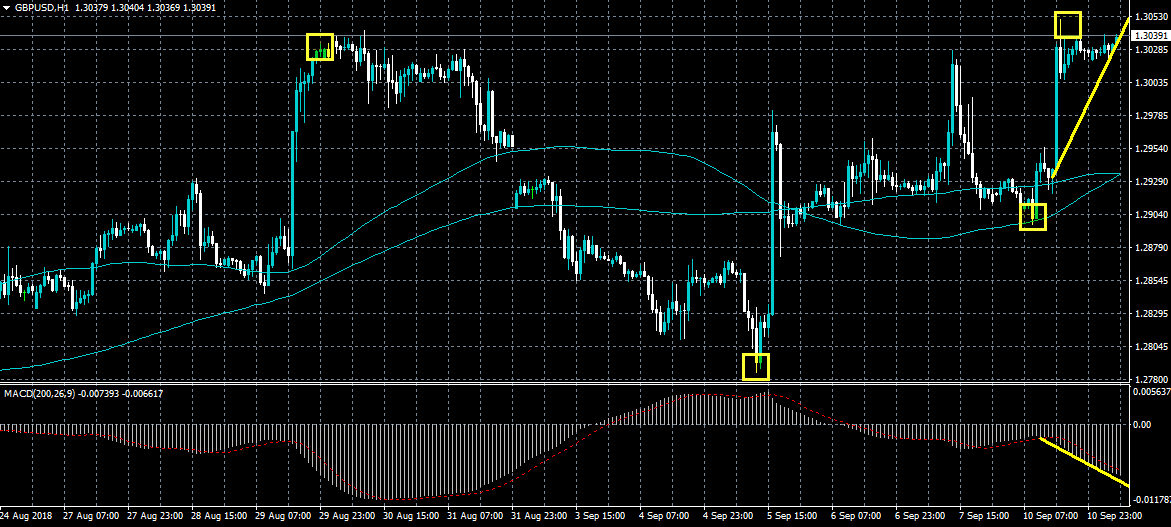
The British pound has moved sharply higher against the US dollar after EU Chief Negotiator Michel Barnier stated that a Brexit deal could be made within six to eight weeks. The GBP/USD pair has moved towards the 1.3040 level, forming a bullish inverted head and shoulders pattern. Caution is still warranted as the recent move higher has created bearish MACD price divergence across the lower time frames.
The GBPUSD pair is only bullish while trading above the 1.2985 level, key resistance is found at the 1.3040 and 1.3100 levels.
If the GBPUSD pair moves below the 1.2985 level, price could correct back towards the 1.2955 and 1.2900 support levels.
EURUSD Sellers Fail At Neckline Support
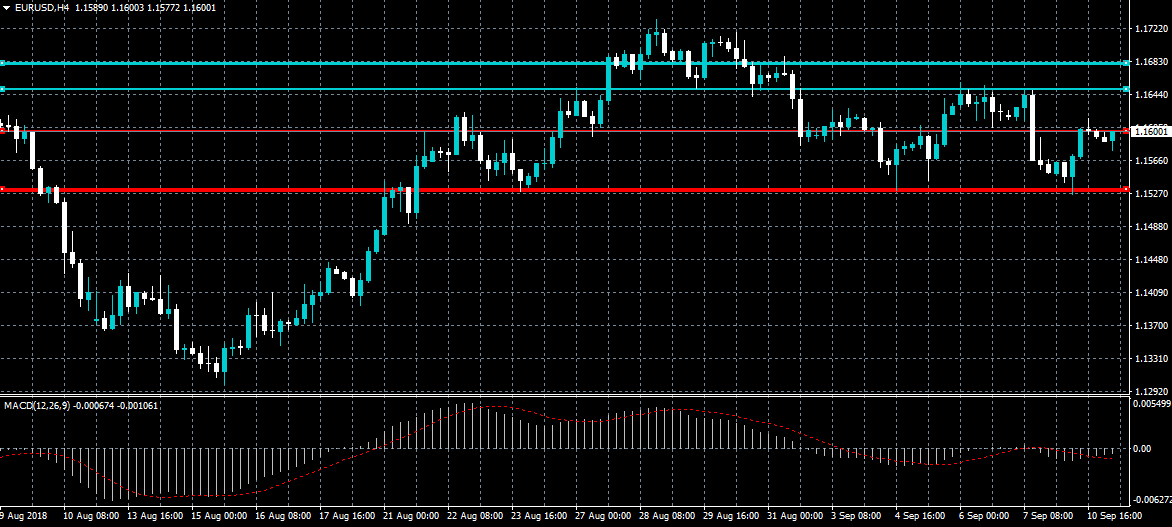
The euro has moved sharply higher against the US dollar after buyers failed to contain price below the neckline of a bearish head and shoulders pattern. The US dollar index has also weakened back towards the 95.00 level, prompting a technical correction in the EURUSD pair. Sellers need to bring price under the 1.1553 level once again, while buyers need to move the EURUSD pair above the 1.1650 level.
The EURUSD pair is only bearish while trading below the 1.1553 level, key support is found at the 1.1528 and 1.1500 levels.
If the EURUSD pair moves above the 1.1650 level, buyers are likely to test towards the 1.1681 and 1.1730 levels.
USD/JPY Bullish Zigzag Patterns Reaches Key Resistance Line
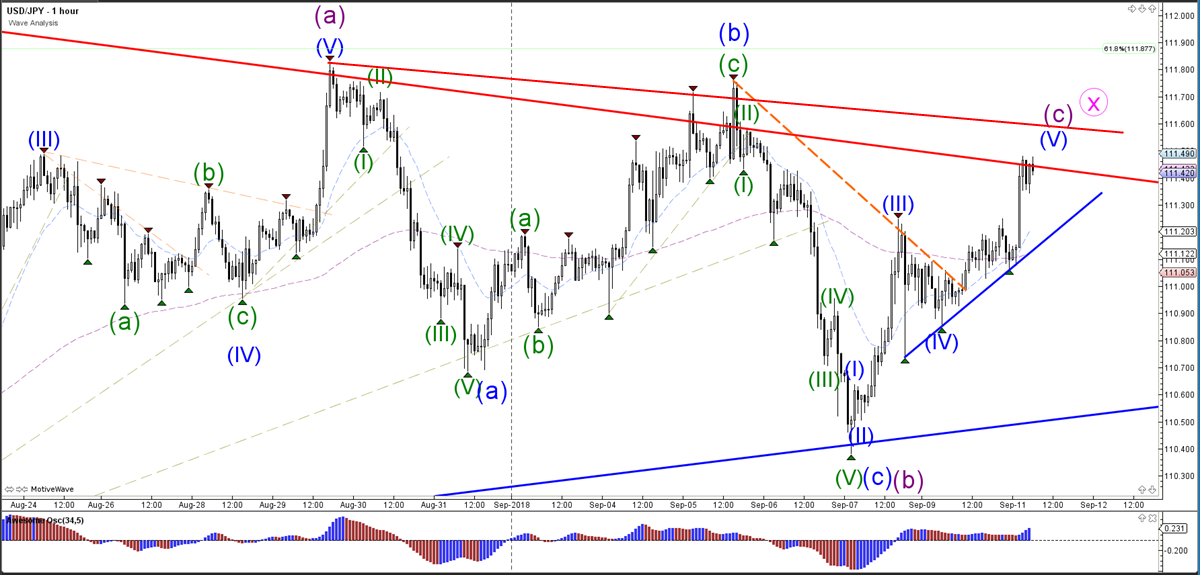
The USD/JPY is facing a new resistance trend line (red) after breaking a minor trend line (dotted orange) yesterday. The bullish breakout did however indicate that a bearish ABC pattern (blue) was probably completed at the recent low, and that the price could be building a bullish wave C (purple) within a larger wave X (pink) correction.
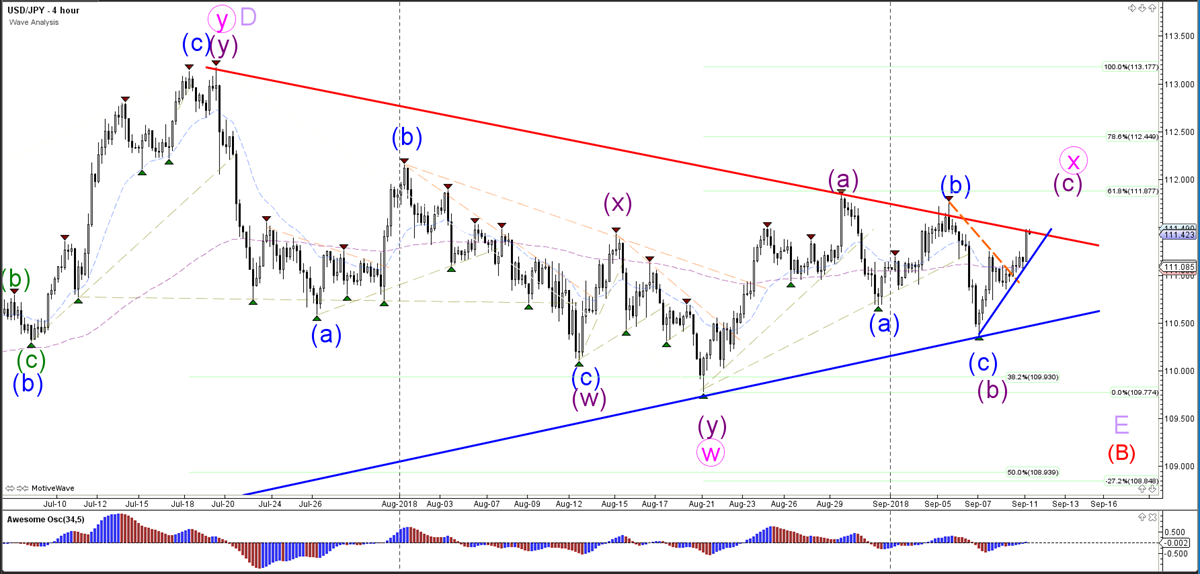
The USD/JPY is attempting to break above the resistance trend line (red), which could also cause a retracement. The price remains in a bullish trend environment as long as the price stays above the support trend line (blue), whereas a bearish breakout could indicate the end of the wave 5 of wave C.
USD/CAD Daily Outlook
Daily Pivots: (S1) 1.3143; (P) 1.3170; (R1) 1.3190; More...
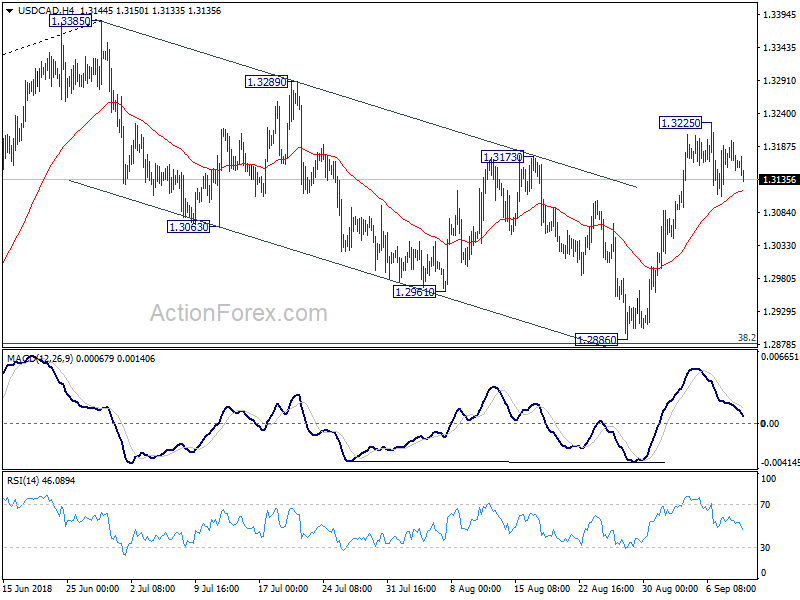
Intraday bias in USD/CAD remains neutral as consolidation from 1.3225 temporary top is extending. Deeper retreat could be seen but downside should be contained well above 1.2886 to bring rally resumption. We're holding on to the view that corrective fall from 1.3385 has completed at 1.2886 already. Above 1.3225 will turn intraday bias back to the upside and bring retest of 1.3385 first.
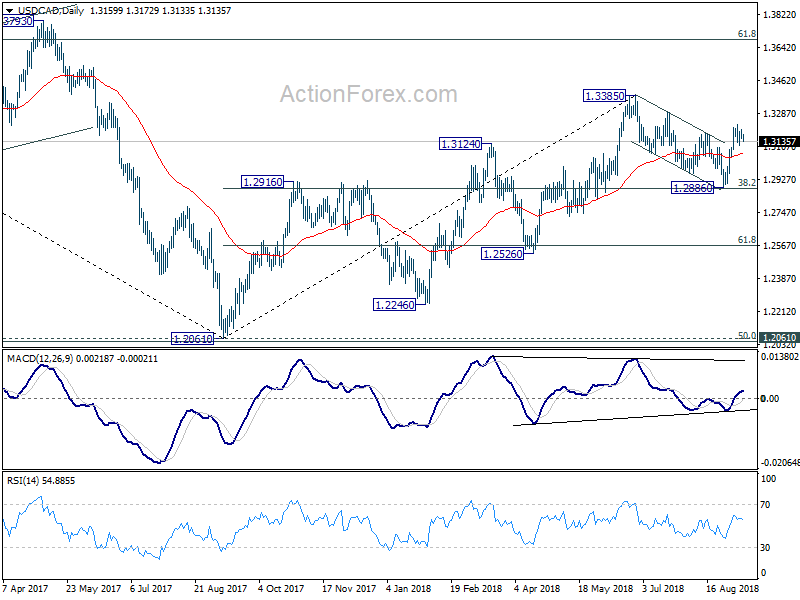
In the bigger picture, strong rebound ahead of 38.2% retracement of 1.2061 to 1.3385 at 1.2879 key fibonacci level retains medium term bullishness. That is, rise from 2017 low at 1.2061 is still in progress. Break of 1.3384 should target 61.8% retracement of 1.4689 (2015 high) to 1.2061 (2017 low) at 1.3685. On the downside, as long as 1.2886 support holds, outlook will now remain bullish.
EUR/USD Bullish Outlook After Reversal At 1.15 Support
The EUR/USD bounced at the support zone (green line) and 50% Fibonacci level near 1.15 which could indicate the end of the bearish WXY pattern and the start of a new bullish wave C.
The EUR/USD needs to break above the resistance trend line (red) to confirm the start of the wave C. The main targets are the Fibonacci levels of wave C vs A.

The EUR/USD seems to be building a wave 1-2 (blue) pattern as long as price stays above the 100% Fibonacci level. A bullish breakout above the resistance trend line (red) could start an impulsive wave 3 (blue) pattern.

AUD/USD Daily Outlook
Daily Pivots: (S1) 0.7097; (P) 0.7115; (R1) 0.7131; More...
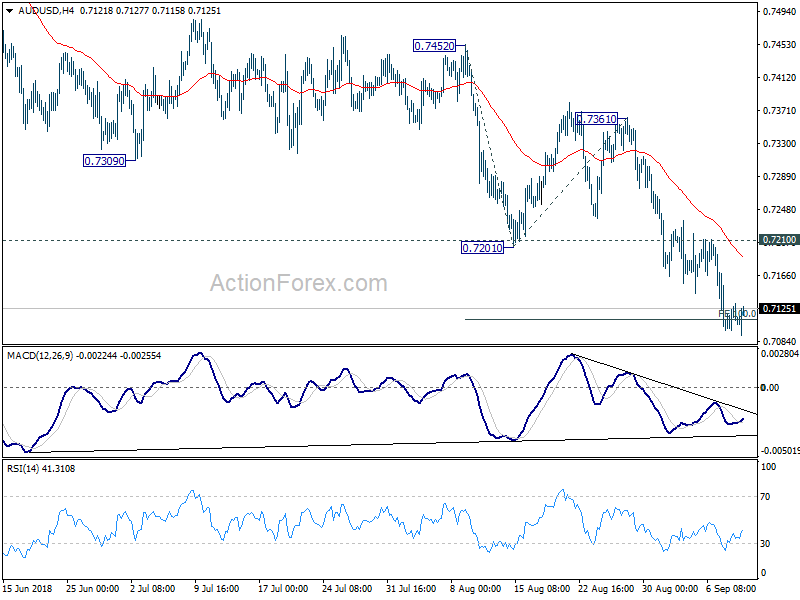
No change in AUD/USD's outlook. As long as 0.7210 resistance holds, deeper decline is expected. Current down trend from 0.8135 should extend to 161.8% projection of 0.7452 to 0.7201 from 0.7361 at 0.6955. Break will target key support level at 0.6826. On the upside, break of 0.7210 will indicate short term bottoming and bring lengthier consolidation before staging another fall.
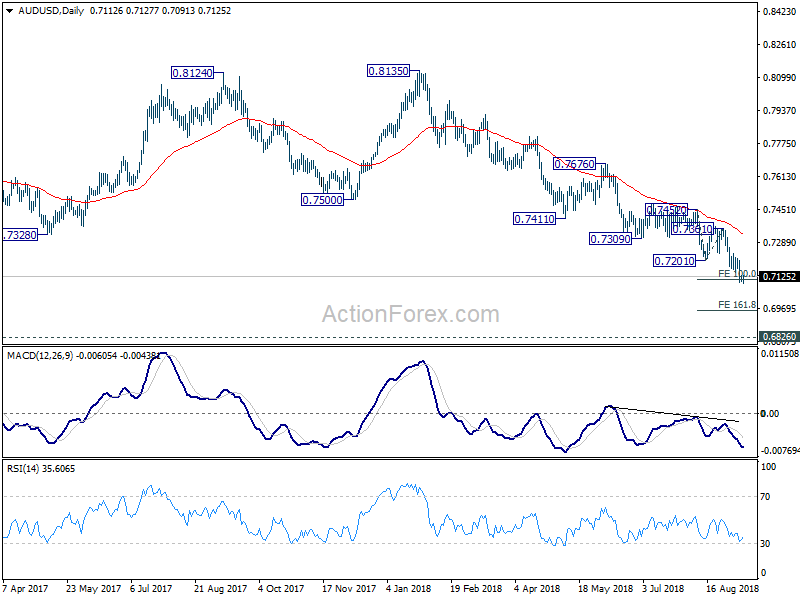
In the bigger picture, rebound from 0.6826 (2016 low) is seen as a corrective move that should be completed at 0.8135. Fall from there would extend to have a test on 0.6826. There is prospect of resuming long term down trend from 1.1079 (2011 high). Current downside momentum as seen in daily and weekly MACD support this bearish case. Firm break of 0.6826 will target 0.6008 key support next (2008 low). On the upside, break of 0.7361 resistance is needed to be the first sign of medium term bottoming. Otherwise, outlook will remain bearish even in case of strong rebound.
EUR/USD Daily Outlook
Daily Pivots: (S1) 1.1542; (P) 1.1579; (R1) 1.1632; More.....
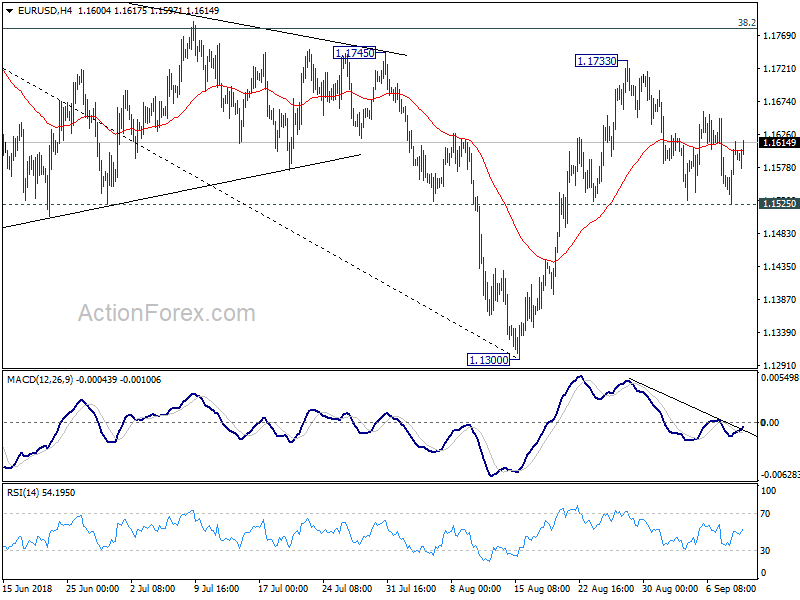
Intraday bias in EUR/USD remains neutral at this point. Rebound from 1.1300 could extend with another rise. But upside should be limited by 38.2% retracement of 1.2555 to 1.1300 at 1.1779, at least on first attempt. On the downside, break of 1.1525 will indicate completion of the rebound and turn bias to the downside for retesting 1.1300 low. Overall, price actions from 1.1300 are forming a corrective pattern, that could extend for a while before completion.
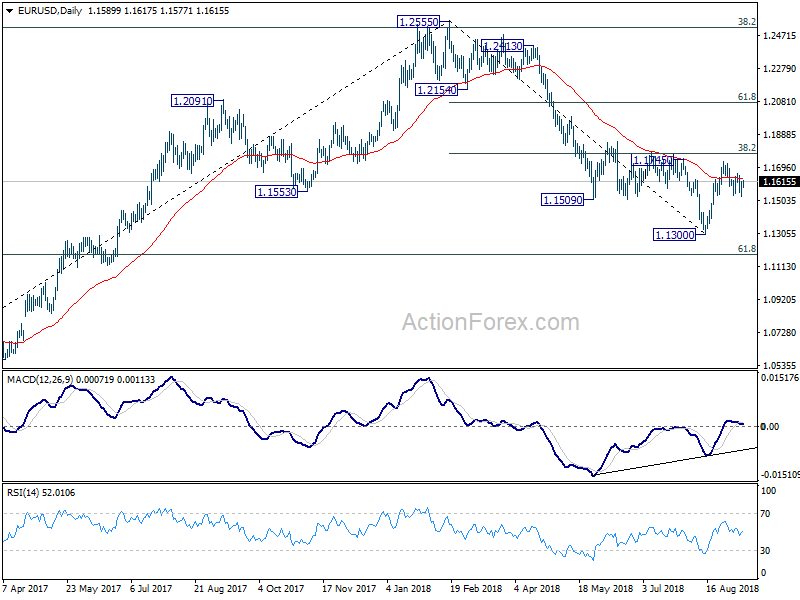
In the bigger picture, a medium term bottom should be in place at 1.1300, on bullish convergence condition in daily MACD and some consolidations would be seen. But still, note that EUR/USD was rejected by 38.2% retracement of 1.6039 (2008 high) to 1.0339 (2017 low) at 1.2516. That carries some long term bearish implications. Thus, we'd expect fall from 1.2555 high to resume after consolidation completes. Below 1.1300 should send EUR/USD through 61.8% retracement of 1.0339 to 1.2555 at 1.1186. And, in that case, EUR/USD would head to retest 1.0339 (2017 low).
Elliott Wave Analysis: GBPUSD Calling Further Upside
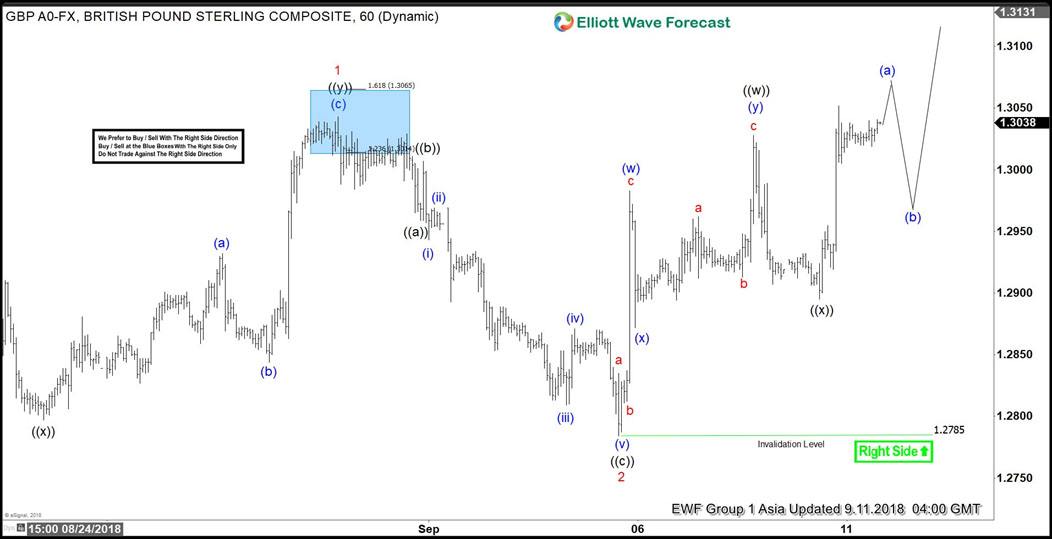
GBPUSD short-term Elliott Wave analysis suggests that the rally from 8/15/2018 low at 1.2660 to 1.3042 high ended Minor wave 1. The internals of that rally higher took place in 3 wave corrective sequence i.e double three thus suggesting that the pair can be doing a Leading diagonal structure. Up from 1.2660 low, the initial rally to 1.2935 high ended Minute wave ((w)) of 1. Minute wave ((x)) of 1 pullback ended at 1.2798 low. Minute wave ((y)) of 1 ended as zigzag structure at 1.3042 high.
Down from there, the pullback to 1.2785 low ended Minor wave 2 pullback as a Flat structure where Minute wave ((a)) ended at 1.2959 low. Minute wave ((b)) bounce ended at 1.3006 high and Minute wave ((c)) of 2 ended at 1.2785 low. Above from there, the pair has managed to make a new high above 1.3042 peak confirming the next extension higher in Minor wave 3. Near-term, while dips remain above 1.2785 low, any dip is expected to remain supported in 3, 7 or 11 swings for further upside towards 1.3162-1.3252, which is the 100%-123.6% Fibonacci extension area of Minor wave 1-2 to complete Minor wave 3. Afterwards, the pair is expected to do a pullback in Minor wave 4 before further upside is seen. We don’t like selling the pair and prefer more upside against 1.2785 low in the first degree.
GBPUSD 1 Hour Elliott Wave Chart