Sample Category Title
GBPUSD Analysis: Might Gain Almost 100 Pips
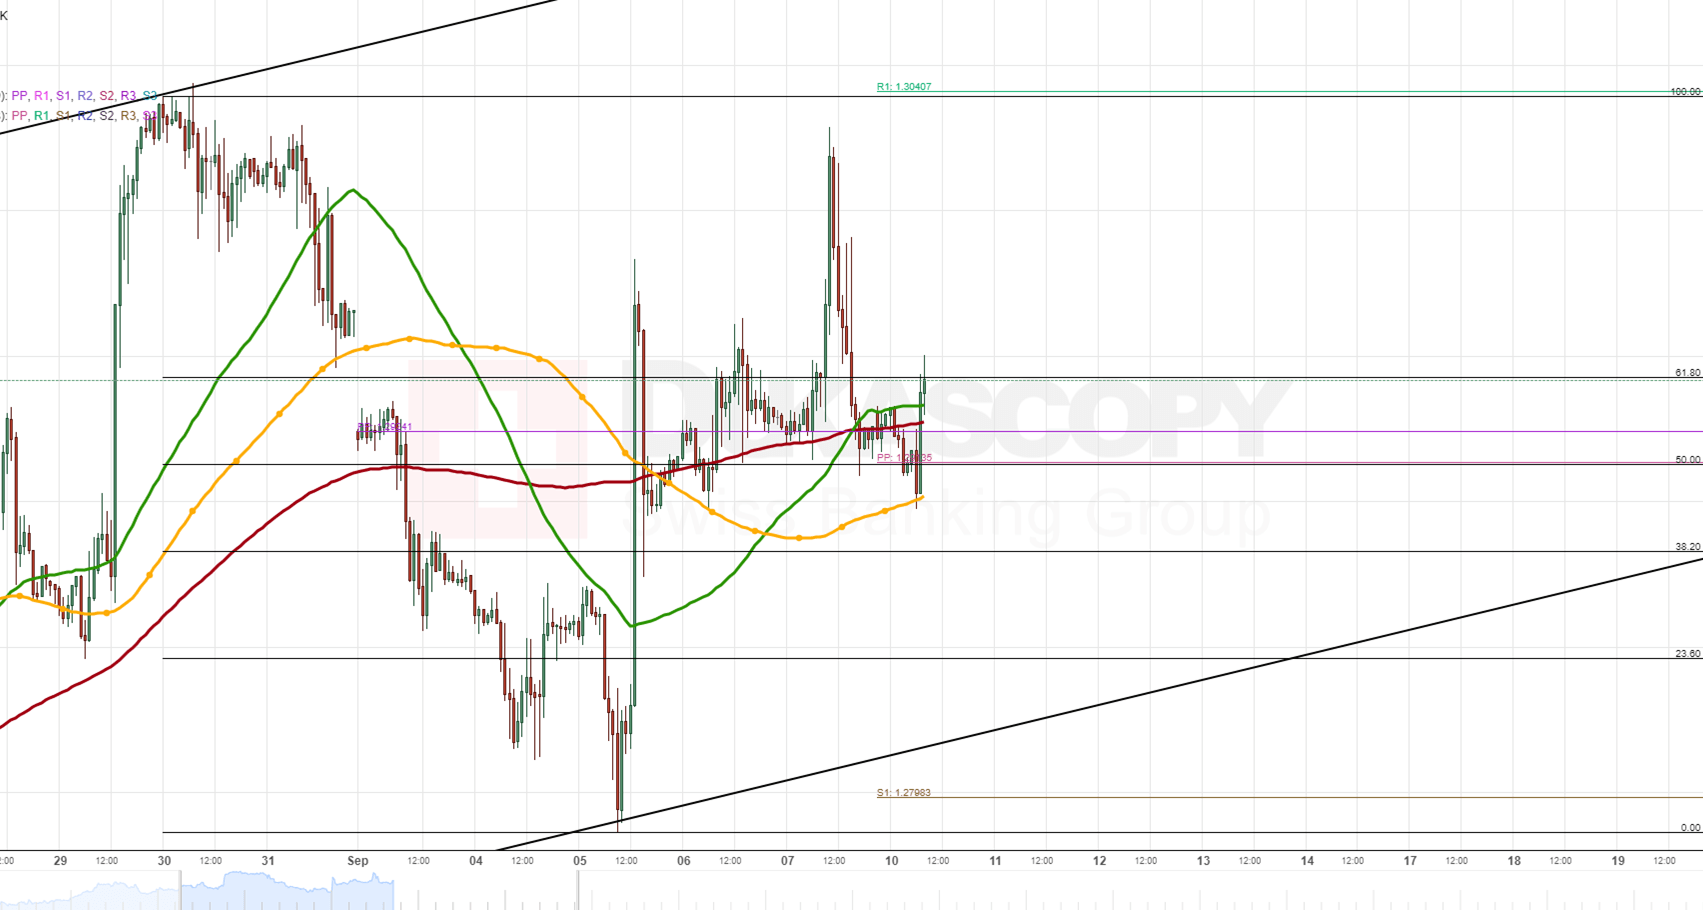
The GBP/USD was expecting a fundamental data release during the morning hours. The data did not cause a significant impact.
In regards the near future, most likely the rate will surge upwards due to a strong support of the simple moving averages. The rate will pass the 61.80% Fibo to move closer to the weekly R1 at the 1.3040 mark, which is almost 100 base points away from the rate.
On the other hand, the British pound may use the resistance of the 61.80% Fibo to retrace back to the 1.29 mark.
USDJPY Analysis: Faces Massive Resistance
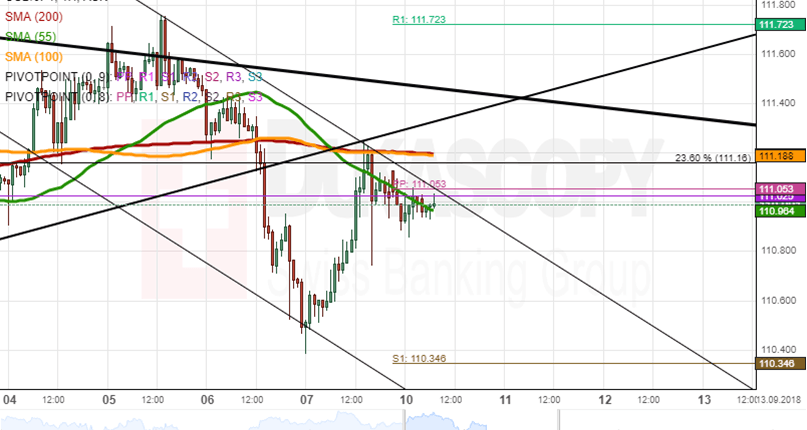
The US Dollar appreciated 0.59% against the Japanese Yen since Friday's session.
In regards to the near future, most likely the rate will bounce off the weekly PP at the 111.05 level to move downwards during the day. Meanwhile, the monthly PP with the support of the 23.60% Fibo together with the 200– hour and the 100-hour SMAs should provide additional resistance for the rate to move downwards.
However, the 55-hour simple moving average and a monthly PP at 111.02 may play role of support and push the rate upwards to the 111.40 level
XAUUSD Analysis: Declines Below 1,200.00
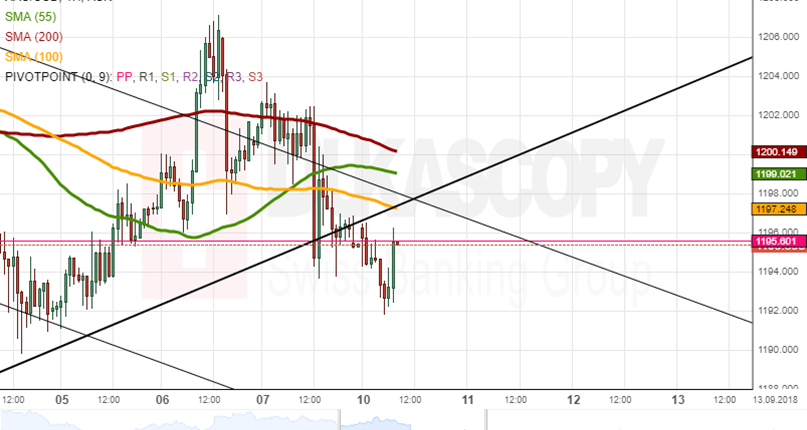
The gold price depreciated 0.41% since Friday's trading session. The XAU/USD was piercing the monthly PP at the 1.195.60 mark during Monday morning hours.
In regards to the near future, the yellow metal will surge upwards to the bottom boundary of the ascending medium channel, but will bounce off it due to a strong resistance of the 100-hour simple moving average and the medium channel line.
Be careful, the monthly PP at the 1.195.60 mark could also turn into a strong support level, which may push the yellow metal upwards to pass the medium channel line and the simple moving averages.
UK PM May: Chequers is the only Brexit plan on the table
UK Prime Minister Theresa May's spokesman said that "Chequers is the only plan on the table which will deliver on the will of the British people while avoiding a hard border in Northern Ireland. The prime minister is working hard to secure a deal and hopes all MPs (members of parliament) will be able to support it."
And, May will hold a cabinet meeting on Thursday to discuss preparation on "no-deal" Brexit.
Fed Rate Hikes Expected To Weaken Gold Further | U.S. Drilling Being Stalled Causes Shortage In Supply
Fed rate hikes expected to weaken gold further
Gold:
Gold has experienced minor losses prior to the last close. This is primarily because of the dollar gaining strength as fed rate hikes approach and the worries of U.S. and China trade disputes continuing. It is no secret, that while the dollar gains strength and stays in the lead, gold will fall back in result of this. Moreover, the solid positive non-farm payrolls had modestly forced downward pressure on gold. Referring back to the data that had been released on Friday, as it was much stronger than expected it has allowed investors to understand that the fed moving forward with the rate hikes are pretty much certain. The federal reserve banks decision to increase interest rates will commence in the month of September which would mean this is going to be the third rate hike. Therefore, from this alone, it is evident that the fed is motivated to continue rate hikes, which will lead to the dollar weighing down on gold.
The end for the greenbacks increase in strength does not conclude at rate hikes. It continues to drive to power via the assistance of Trumps decisions of enforcing an additional $267 billion worth of tariffs on Chinese imports, along with the $200 billion he had already promised to enforce previously. Moreover, at present the U.S. is holding the upper hand in trade wars and escalating. However, China will retaliate, then the question of can the U.S. hold stability will rise.
U.S. drilling being stalled causes shortage in supply
Oil:
Oil prices back on the rise while U.S. drilling comes to a halt and sanctions on Iran approach. Two oil rigs being shutdown has caused an immediate effect to the prices of oil where Brent crude futures increased by 0.65 percent totalling the price per barrel at $77.33. The rig count which currently sums to 860 has seen stagnation since May this year.
Sanctions being placed on Iran by the U.S. which are expected to be executed in November, are additionally allowing the price to increase. This is because more countries cut off supply from Iran as we approach November. Moreover, India and China are cutting back on supply from Iran which were the two countries that had initially resumed trade with Tehran. On the other hand, to some at this point it may seem that supply for oil is at risk. However, Washington has begun to place weight on various other countries especially Saudi Arabia and Russia which are the world’s biggest exporter and producer to keep output high in order to keep supply and demand balanced.
EUR/GBP: Brexit Pushes Sterling | DOWJONES: Tight Range Creates Uncertainty
EUR/GBP: Brexit pushes sterling
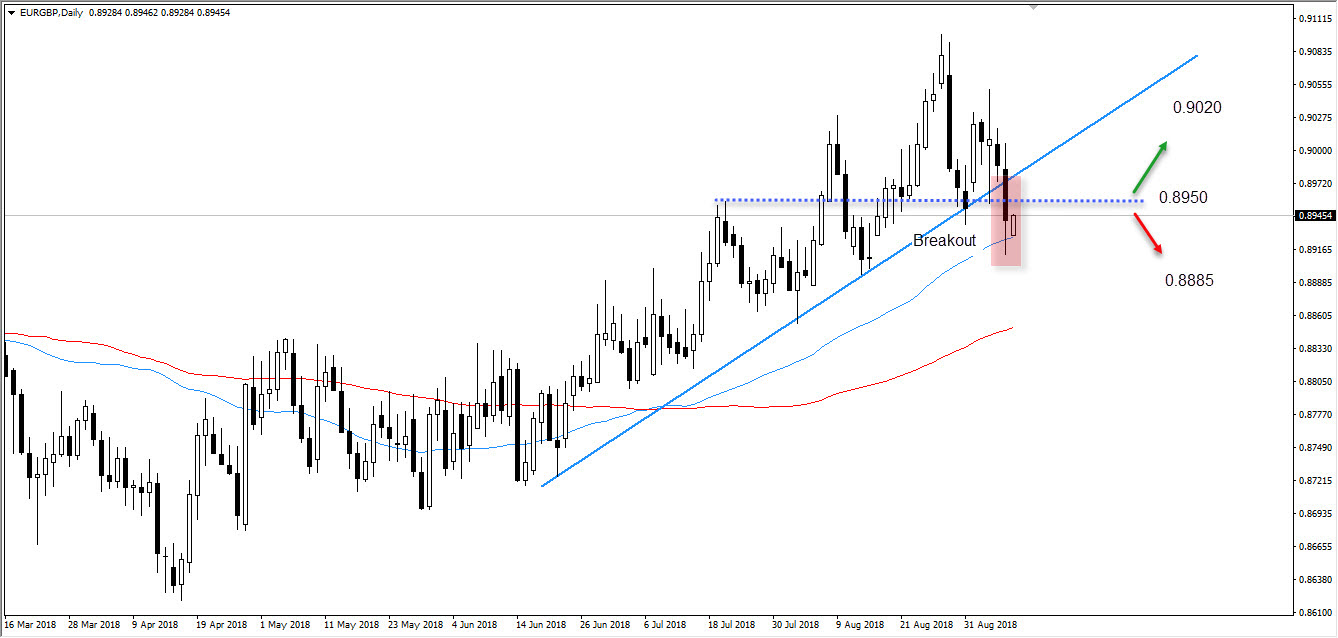
The chart below on a daily time-frame shows the pair EUR/GBP trading at $0.89454. Positive comments concerning Brexit from Europe has supported the price of sterling against the Euro. This has led to the price breaking the upward trend line (colored in blue) which is displayed below. In Addition, it can be seen that the pair is trading above the moving averages which shows a possible bullish sign. However, signs of a rebound are apparent, but this will be an opportunity to short the pair.
If the price drives up in a bullish momentum which is a possibility, then the price may reach the resistance zone (indicated by green arrow) which is priced at $0.9020. However, if the price trades below the moving averages which are near, then the price may trade towards the support zone (indicated by red arrow) which is priced at $0.8885.
Major support: 0.8885
Major resistance: 0.9020
DOWJONES: Tight range creates uncertainty
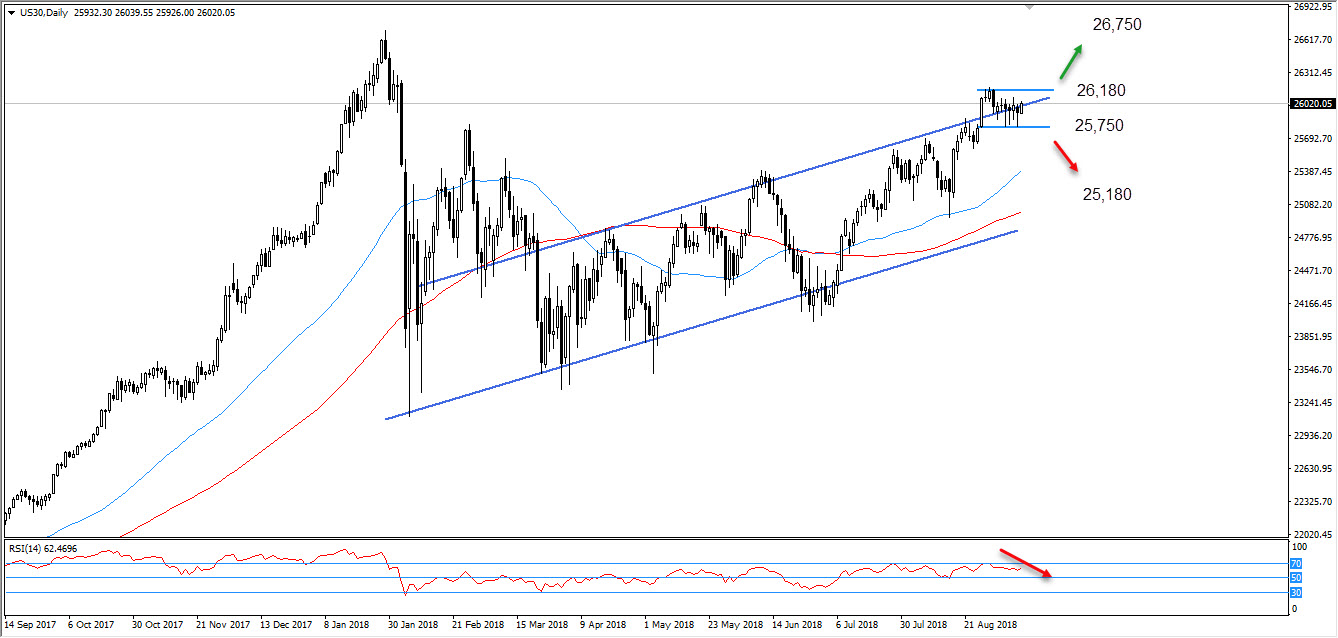
The chart below on a daily time-frame shows the index Dow Jones trading at $26020.05, its current position is in a tight range where the markets may be seeing a break out soon. It is displayed below that the price is trading above the moving averages which shows a bullish sign. If this momentum is maintained, then the price may drive towards resistance zone (indicated by green arrow) which is priced at $26,750.
On the other hand, the Relative Strength Indicator chart below shows that the price is trading very close to the oversold zone. This informs that a bearish sentiment maybe upon the index which would drive the price lower towards the support zone (indicated by red arrow) which is priced at $25,180. In this case, a downside move is looking fairly strong as the bullish penetration to the rising channel is weak.
Major support: 25,180
Major resistance: 26,750
WTI Outlook – Recovery Attempts To Form Reversal Pattern
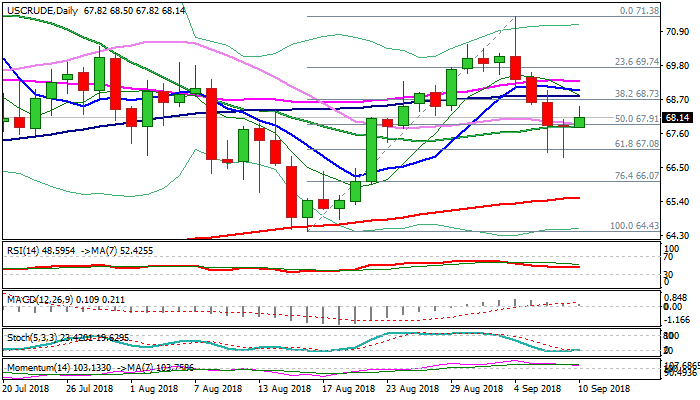
WTI oil moved higher on Monday, bouncing to session high $68.50, recovery attempt from last Friday's spike low at $66.85.
Repeated strong downside rejection and Friday's long-tailed Doji, with today's acceleration higher are signaling formation of reversal pattern on daily chart.
Technical studies support the notion as slow stochastic is forming bull-cross and reversing from oversold territory, while 10/30SMA's are also attempting to form bull-cross.
But flat momentum and mixed daily MA's so far weigh on the action.
Fundamentals are supportive, as persisting concerns on lower supply from Iran once new US sanctions start in November and drop in a number of US oil rigs, continue to underpin.
Fresh recovery attempts face a cluster of barriers, consisting of 100/10/55SMA's at $68.81/$69.31, with sustained break here needed to confirm reversal and shift near-term focus higher.
Otherwise, the downside would remain vulnerable if recovery shows signs of stall.
Res: 68.50, 68.81, 69.00, 69.31
Sup: 67.82, 67.31, 67.08, 66.85
AUDUSD Outlook: Aussie Looks For Psychological 0.70 Support After Pivots At 0.7160 Zone Were Broken
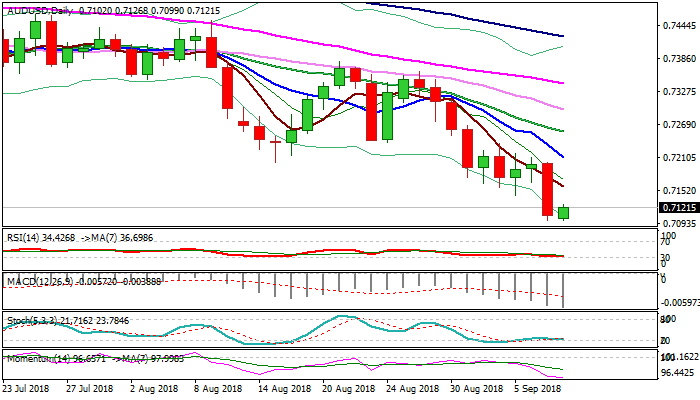
The Australian dollar recovers briefly on Monday, on bounce from new low at 0.7098 (the lowest since 15 Feb 2016) to 0.7126 (session high), but the move could be seen as consolidation before broader bears resume.
Last Friday's eventual close below key supports at 0.7160 zone (lows of 2016/17) was strong bearish signal, reinforced by the second straight strong bearish weekly close. Daily/weekly studies are in firm bearish setup and maintain strong negative momentum, supporting bears for test od psychological 0.7000 support and 0.6906 (04 Sep 2015 low), with key longer-term support at 0.6825 (15 Jan 2016 low), coming in focus.
Limited corrective action is expected, with extended upticks to face strong barriers at 0.7200 zone (15 Aug former low/last Friday's high/falling 10SMA).
Res: 0.7126, 0.7144, 0.7200, 0.7235
Sup: 0.7098, 0.7022, 0.7000, 0.6954
Stable Monday
A very ordinary Monday with market sentiment skewed towards risk-off. With the ECB meeting Thursday investors are taking time to reexamine strategies. Asia equity markets are broadly in the red highlighting the negative macroview. The conversation over stock markets reversal-point continues to gain traction. Our overall thought is that the fate of stocks markets will be determined more by financial conditions then business cycle. Global growth has been riding a wave accommodative monetary policy and fiscal stimulus, which allowed investors to overlook negative macro developments. Sending asset prices to clear bubble territory. But in the face of expected tightening in financial / credit conditions, slowing China, trade tensions, geopolitical stress is now taking a toll on investors psyche. Not to mention the sane strategy of locking in a returns before a broader correction wipes out 9-months of hard work. It’s hard to image another alternative senario then a significate equity correct. Although as slow deflation is preferable to a pop (cant help remembering the Feds history of bubble-popping). JPY and CHF gains continue, highlighting investors’ concerns. Both USDCHF and USDJPY are nearing range support. Higher US bond yields and stronger labor market report will keep the USD in demand, despite Trumps threats of more tariffs on imports from China. The Fed is likely increase rates on September 26th and debate of a further hike in December, currently priced as a 70% probability.
EM Crisis.. not likely
EM currency remain under pressure despite heavy devaluation of the past month. Investors have focused on foreign debt holdings to pick winner and losers. Foreign debt in EM have rising significantly in the past few years after a long period of decline. With funding cost expected to rise further, countries Turkey and Argentina are in extremely delicate situation. While Mexico, Russia and South Africa are less critical but still worrisome. Yet overall, its unlikely that the situation will spiral in a direct currency crisis. We anticipate that extended volatility in EM countries will further decelerate proving a short term opportune to short vol.
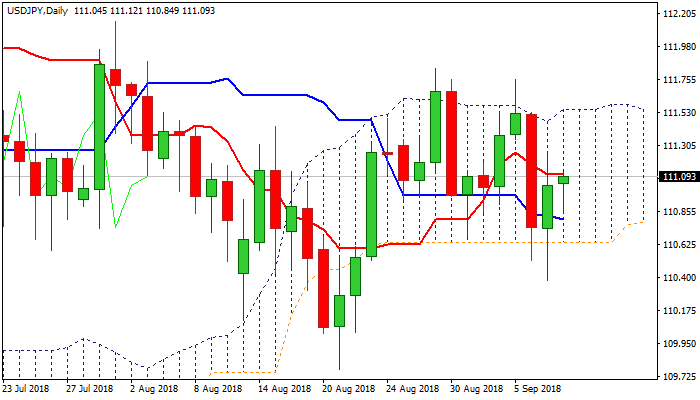
USDJPY Outlook: Directionless Mode Within Thick Daily Cloud Likely To Extend
The pair holds in the middle of thick daily cloud on Monday, following swings up and down which resulted in strong rejections on both cloud boundaries.
This suggest the price may hold in extended range within the cloud, which remains wide and twists in nearly two weeks.
Directionless mode is supported by neutral daily techs as well as double weekly Doji.
Converged 10/55SMA’s mark immediate barrier at 111.17, sustained break of which shift focus towards key barrier at 111.55 (daily cloud top).
Daily 20SMA marks initial support (110.97), loss of which would expose cloud base (110.64) which marks pivotal support (reinforced by rising 100SMA, currently at 110.54).
Focus turns towards US CPI and retail sales data, due later this week, which could provide stronger direction signals.
Res: 111.17, 111.55, 111.75, 111.83
Sup: 110.97, 110.64, 110.54, 110.38