

Sample Category Title
Weekly Economic and Financial Commentary: Will Global Growth Catch Up to the United States?
U.S. Review
The Housing Disconnect
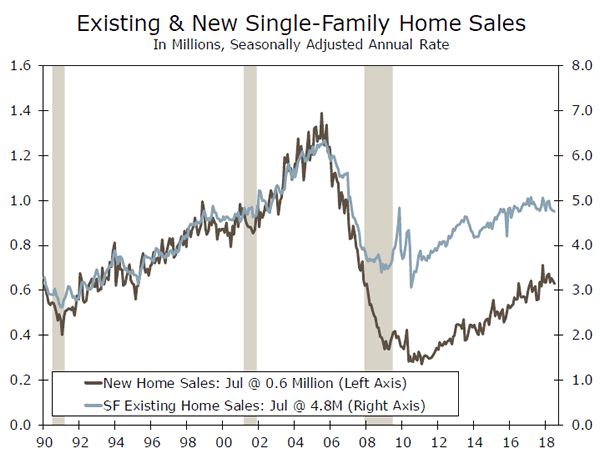
- Existing homes sales declined 0.7 percent to a 5.34-million unit pace in July. Total resales are now trending 1.5 percent below year-ago levels. Sales of new homes also fell, down 1.7 percent in July following a 2.4 percent drop in June.
- Durable goods orders slipped 1.7 percent in July. Much of the decline occurred from an expected drop in nondefense aircraft orders. Ex-transportation, orders rose 0.2 percent.
- The latest FOMC meeting minutes revealed that participants' views of the economic outlook had strengthened, making a September rate hike increasingly likely.
The Housing Disconnect
The week was replete with data that underscored the divide between a sluggish housing sector and an overall improving economy, as both new and existing home sales again came in below expectations in July. Meanwhile, minutes for the most recent FOMC meeting revealed that the committee appears on track for a September rate hike. Despite volatility in the transportation sector, a pickup in core capital goods orders bodes well for third quarter business equipment investment.
Existing homes sales declined 0.7 percent to a 5.34-million unit pace in July. Single-family sales fared slightly better and only experienced a 0.2 percent drop, while condos and co-ops fell 4.8 percent. Total resales have now declined on a monthly basis in each of the past four months and are trending 1.5 percent below year-ago levels. The parade of disappointing housing data continued with new home sales, which also came in below consensus and fell 1.7 percent in July. The monthly decline followed a 2.4 percent drop in June. Sales of new homes have now fallen in three of the past four months.
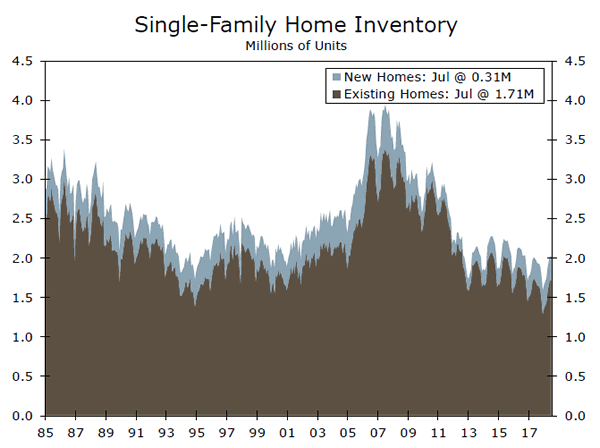
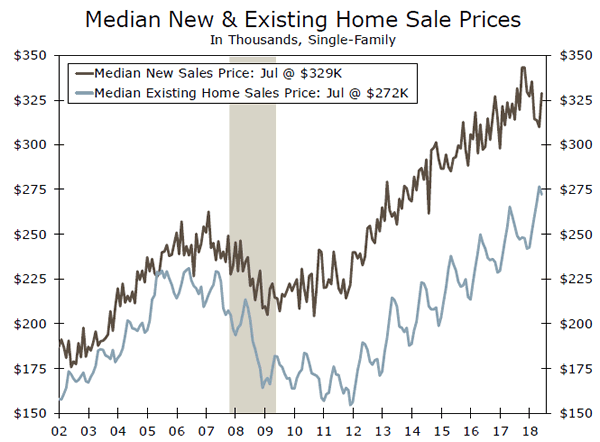
Several factors appear to be limiting home sales, but we doubt waning demand is one of them. Existing homes only lasted an average of 27 days on the market, slightly less than the 30-day average registered in July 2017. Fifty-five percent of the existing homes sold were also on the market for less than a month. Tight inventories are more of a concern. On a year-over-year basis, total inventories of existing homes remained essentially flat; however, this followed 37 consecutive months of declines. Home prices also remain high. The National Association of Realtors reported that the median home price for an existing single family home eased somewhat to $272,300, but this followed prices hitting a record high of $276,500 in June. Both the average and median home price for new homes also rose during the month.
The weather may have also dampened sales in July. The Northeast experienced an unusual amount of rain and saw sales of both new and existing homes drop sharply during the month. Parts of the South may have also been affected. However, home sales clearly remain on the slow track and the divide between the strengthening economy and sluggish housing market is a theme that should persist.
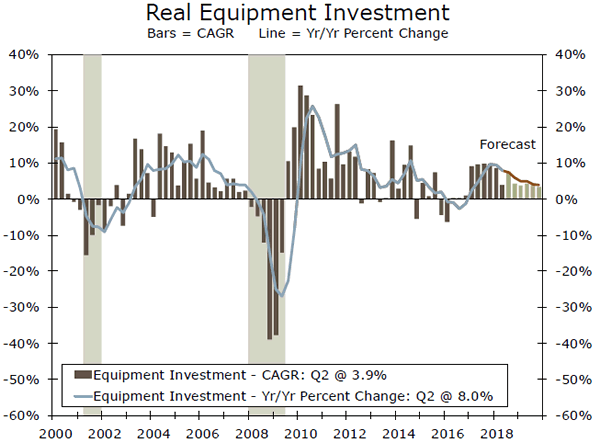
Topline durable goods orders slipped 1.7 percent in July. However, much of the monthly drop was in the transportation sector, as both civilian and military aircraft orders fell more than 34 percent. Excluding the volatile transportation component, there was fairly broad-based strength, as orders increased 0.2 percent, and nondefense capital goods orders excluding aircraft rose 1.4 percent. With orders in other categories still positive and unfilled orders of nondefense aircraft elevated, we maintain our call for real equipment spending to rise in Q3.
To cap the week, Fed Chair Powell gave a speech in Jackson Hole on Friday. He emphasized his view that the economy has "strengthened substantially" and there is "little risk of overheating." This makes a September rate hike all the more likely, as the minutes of the latest FOMC meeting released earlier this week revealed that participants' views of the economic outlook had also strengthened despite the noted potential downside risks of trade and the housing sector. This also firms up our stance that the Fed should hike rates two more times this year in September and December, with two additional quarter-point hikes in 2019.
U.S. Outlook
Consumer Confidence • Tuesday
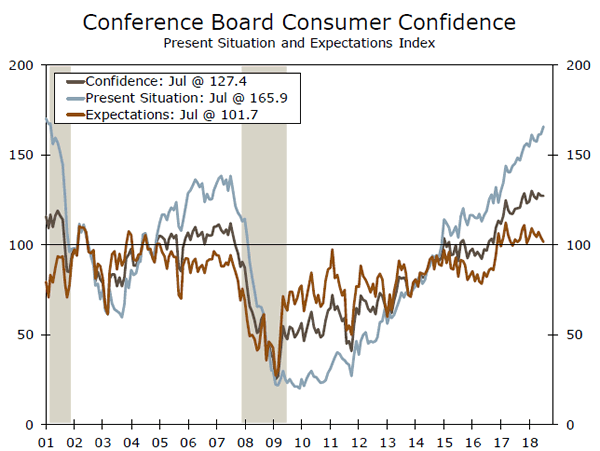
Consumer confidence rose 0.3 points in July, while June's drop was revised lower than first reported. Consumers generally continue to remain upbeat about current economic conditions. The present situation index rose 4.2 points in July, registering a new cycle high of 165.9. However, consumers are growing slightly more concerned about future economic conditions. All of the drag came from the future expectations component in July, which, falling 2.3 points, marks the second consecutive decline and fourth drop in the past five months. The growing divide between consumers' assessment of current economic conditions and their expectations of the future partly reflects uncertainty surrounding the ongoing trade negotiations and disputes. Despite these uncertainties, we expect consumer confidence to remain elevated in August, although we anticipate the divide between present and future conditions to continue to widen as this economic cycle ages.
Previous: 127.4 Wells Fargo: 126.4 Consensus: 126.5
Pending Home Sales • Wednesday
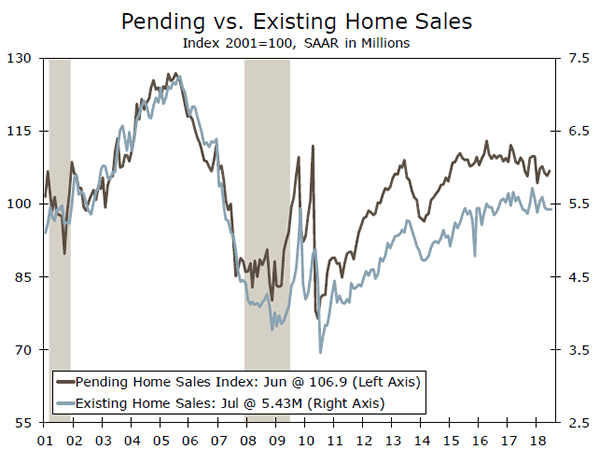
After declining for two consecutive months, pending home sales rose 0.9 percent in June. Since pending home sales measure purchase contracts for existing homes, pending sales tend to lead existing sales by one or two months. However, data released this week showed existing home sales fell 0.7 percent in July, largely due to tight inventories and rising home prices.
The inventory and affordability story is also prevalent in the pending home sales numbers. Low inventories are driving prices higher, which appears to have softened buyer interest, but may be a sign of more sellers eventually coming to market. Higher interest rates also appear to have had an impact on the housing market. Mortgage rates have picked up over the past year, which are contributing to the cost of purchasing a home. We expect home sales to pick up in the second half of the year, but to finish 2018 at levels slightly lower than last year.
Previous: 0.9% Consensus: 0.5% (Month-over-Month)
Personal Income & Spending • Thursday
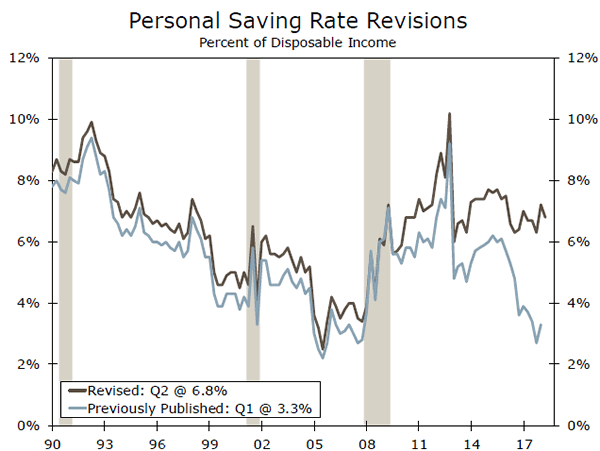
Both personal income and personal spending rose 0.4 percent in June. June income and spending data was the first opportunity to analyze how the benchmark revisions–which took effect with the Q2 GDP results–have altered the data. Incomes appear to have grown more strongly in prior years than previously reported, while consumption grew slightly less. These dynamics resulted in a boost to the saving rate to 6.7 percent in 2017, more than twice as high as previously reported (3.4 percent). Consumers appear to be in a better financial position than previously thought, as the revisions to the personal income data paint a slightly brighter economic picture. With wages and salaries having firmed, the trend now more closely tracks the strong job growth seen during the first half of the year. The tightening labor market will continue to pressure businesses to raise wages. Continued wage gains should be supportive of solid gains in consumer spending throughout the second half of the year.
Previous: 0.4% Wells Fargo: 0.4% Consensus: 0.4% (Month-over-Month)
Global Review
Will Global Growth Catch Up to the United States?
- Canadian retail sales declined in June, providing additional evidence that the Canadian consumer is underperforming relative to a strong 2017 showing.
- The Eurozone manufacturing PMI missed consensus expectations in August's preliminary reading, falling to 54.6, but the services index met expectations. The survey data suggest Eurozone economic growth has leveled off over the past few months.
- Despite a multi-decade high in wage growth in Japan in June, inflation in July disappointed relative to expectations.
Will Global Growth Catch Up to the United States?
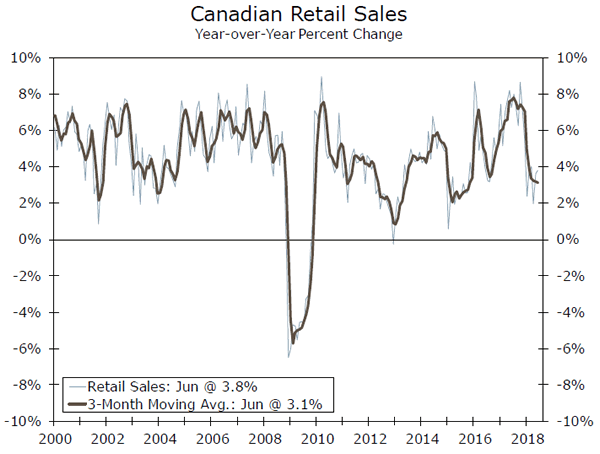
The Canadian consumer was a major driver of the 3.0 percent full-year growth registered in 2017. Personal consumption contributed 1.9 percentage points to topline growth, just 0.1 percentage point below what the Bank of Canada (BoC) expects the entire economy to grow in 2018. As illustrated in the chart on the front page, retail sales have slowed in 2018. Data on June retail sales in Canada were released this week and showed a 0.2 percent decline in the month, though upward revisions to May data helped offset the decline. Like the United States, e-commerce is accounting for a growing share of retail sales. The June data from Statistics Canada showed retail e-commerce sales rising at a brisk 18 percent year-over-year pace, well outpacing the 3.8 percent increase in total retail sales.
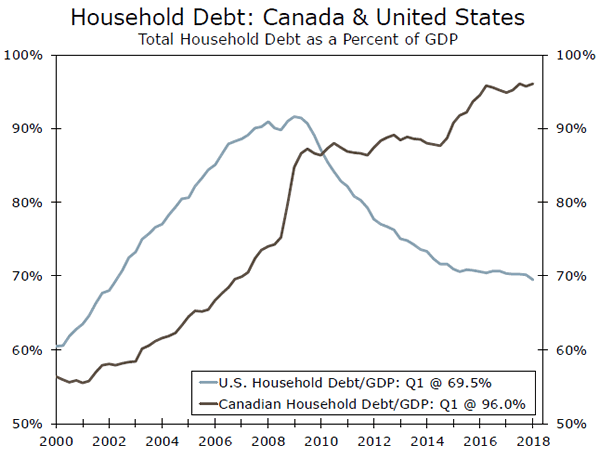
As we have noted previously, household debt levels as a share of the economy are much higher in Canada than in the United States (top chart). In the last Monetary Policy Report from the Bank of Canada, the central bank noted that the slowdown in consumption growth since the middle of 2017 has been led by a pullback in spending on items sensitive to interest rates, such as motor vehicles and furniture. With the output gap close to zero and inflation squarely within target, the BoC has continued to move forward with caution given households' potential vulnerability to rising rates and debt service costs. We look for one more rate hike from the BoC this year, occurring in Q4. Real GDP growth in Canada for Q2 is reported next Friday and is covered more in depth in the Global Outlook section on the next page.
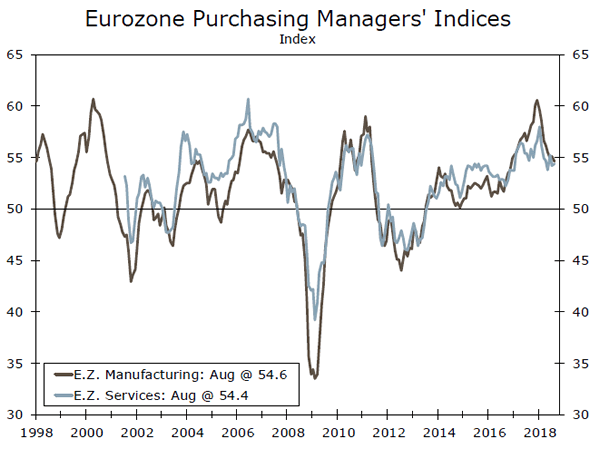
In the Eurozone, the closely-watched preliminary August release of the IHS Markit Purchasing Managers' Indices (PMI) yielded mixed results. The manufacturing PMI missed consensus expectations for a 0.1 point rise, falling 0.5 points to 54.6 (middle chart). While the manufacturing PMI continued its marked decline from the seven-year high registered at the end of 2017, the August reading still remains above the 50 demarcation line signaling expansion. The services and composite PMIs both increased slightly in August to 54.4. The service sector represents a larger share of the Eurozone economy, and the increase in the services PMI is encouraging for second half growth. Even still, the divergence between the United States and Eurozone economies has become starker in recent months, with both survey and hard data in Europe well off their recent highs.
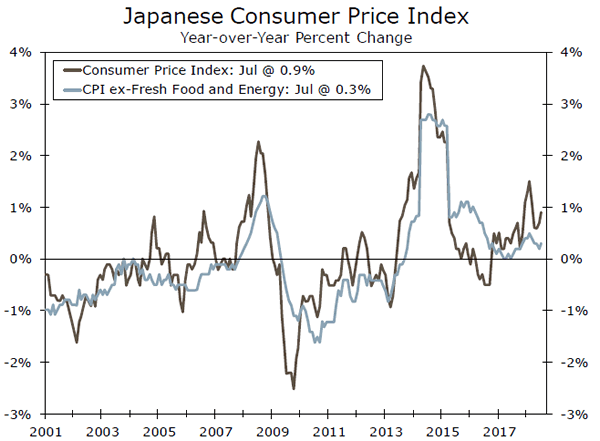
Japanese inflation data for July came in slightly softer than expected, a phenomenon all too familiar to Bank of Japan policymakers. The headline consumer price index rose to 0.9 percent year-over-year, up from June's 0.7 percent pace but below consensus expectations for a 1.0 percent gain. Core inflation, which excludes fresh food and energy, rose 0.3 percent over the year. The lack of inflation in July is disappointing, as a tight labor market has spurred a sharp acceleration in wages over the past few months. Real consumer spending rose at a solid 2.8 percent annualized rate in Q2, but at least for now the flow through to inflation remains modest. As a result, the Bank of Japan will likely remain vexed by the low inflation quagmire for at least another month.
Global Outlook
Canada GDP • Thursday
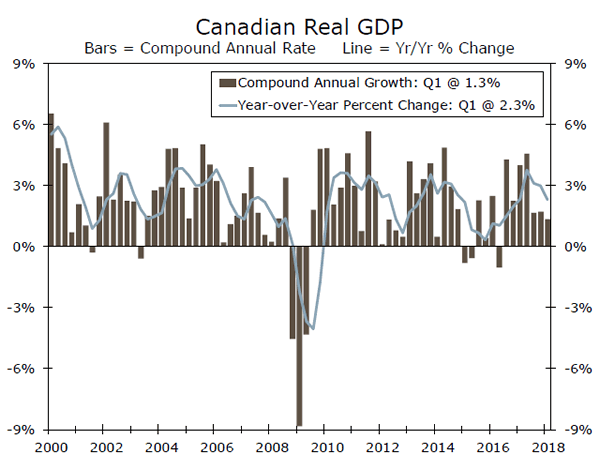
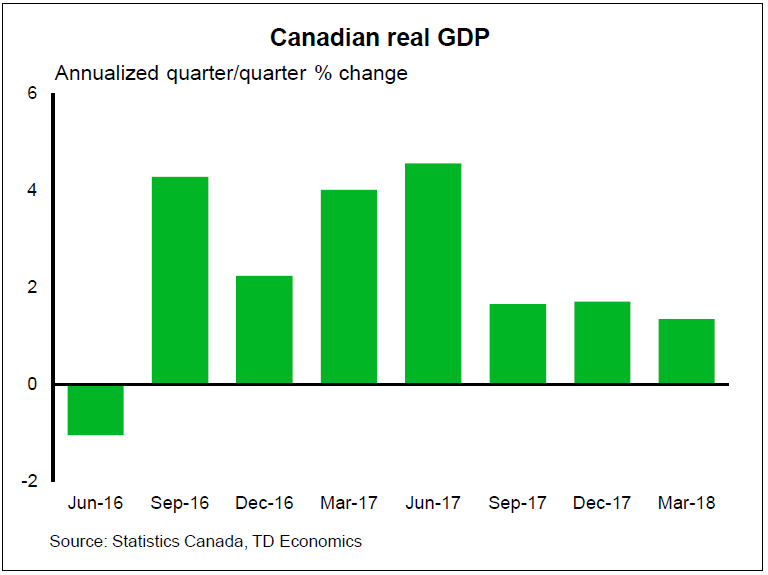
Real GDP growth in Canada surged last year as a strong consumer, a recovery in commodity prices and a broad-based global upswing benefitted the economy. Year-over-year real GDP growth peaked at 3.8 percent in Q2-2017 but has eased in each quarter since (see chart to right). A smaller contribution to growth from consumer spending appears to be the main culprit of the 2018 slowdown as households grapple with high debt levels and rising interest rates.
Looking forward, strong economic growth in the United States should benefit exports and investment spending in Canada. NAFTA renegotiations and tariffs already put in place on goods like steel and aluminum are risks to the outlook, however, and the uncertainty associated with these risks is likely weighing on the Canadian economy at the margin. Monthly data suggest a pickup in Canadian economic growth in Q2, and we look for full-year real GDP growth to register 1.8 percent in 2018, down from 3.0 percent in 2017.
Previous: 1.3% Wells Fargo: 3.1% Consensus: 3.0% (Quarter-over-Quarter, Annualized)
Eurozone CPI • Friday
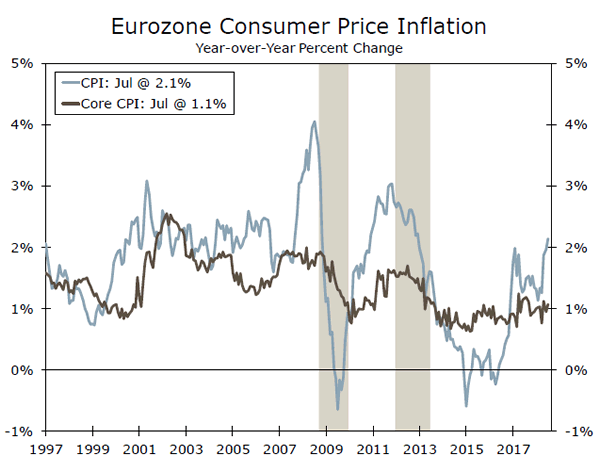
Headline consumer price inflation has surpassed 2.0 percent in the Eurozone, but much of the recent increase has occurred as a result of higher energy and utility prices. Core inflation was a much lower 1.1 percent year-over-year through July. While this matches the high of 2018, it remains nearly half of the European Central Bank's (ECB) target of "below, but close to, 2 percent over the medium term."
Unlike the United States, real GDP appears to have decelerated in Europe this year. Fiscal policy is far less expansionary in Europe than in the United States, and the latter has likely benefitted more than the former from the rise in oil prices. Still, even if Eurozone real GDP growth falls to 2.1 percent in 2018 (our forecast), this is still faster than potential growth, which is probably about 1.0-1.5 percent. Core inflation at this pace should be enough to keep the ECB on track to end its quantitative easing by year end, but it would likely take a meaningful pickup for the ECB to accelerate its rate hike plans.
Previous: 2.1% Consensus: 2.1% (Year-over-Year)
Brazil GDP • Friday
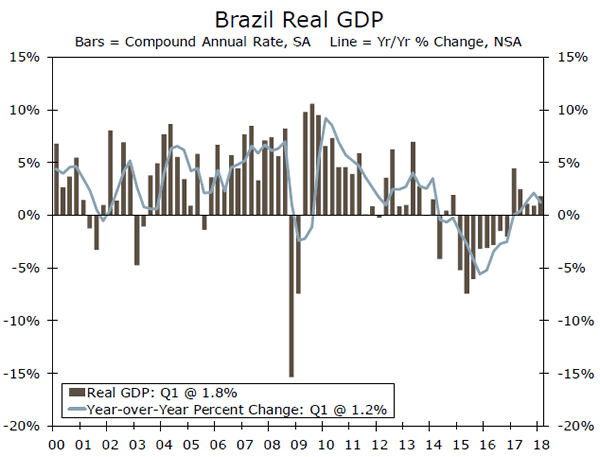
After turning the corner from a deep recession over the 2015-2016 period, the Brazilian economy appears to have lost some of its momentum in H1-2018. Real GDP growth has been positive but fairly meager over the past few quarters, and the Brazilian real has fallen about 26 percent against the U.S. dollar year to date. The weakness has been especially pronounced over the past few weeks amid broad-based weakness in emerging markets, led by Turkey.
A nationwide strike in the transportation sector may have weighed on real GDP growth in Q2. An economic activity index produced by the central bank fell sharply on a year-over-year basis in May, hitting nearly a two-year low before snapping back in June. Through the noise, the Brazilian economy should gradually improve in the quarters ahead as the recovery continues. But continued monetary policy tightening in the developed world, trade war fears and domestic political uncertainty are likely to be continued headwinds.
Previous: 0.4%
Point of View
Interest Rate Watch
Eyes on the Yield Curve Again
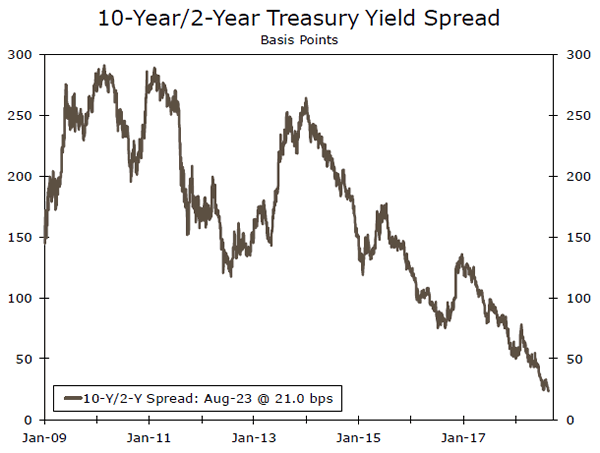
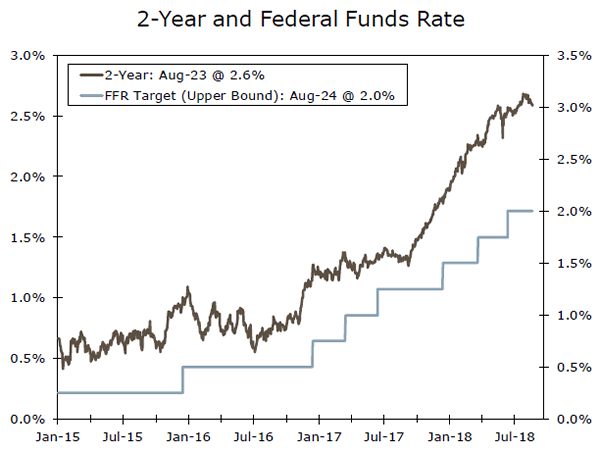
The 10-Yr/2-Yr Treasury yield spread has narrowed about 30 bps since the start of the year, and is currently sitting at its lowest level of the cycle (top chart). A major factor behind the flattening trend in the yield curve over the past two years is the Fed continuing to hike benchmark interest rates. This has served to push up yields at the short end of the curve (middle chart). Meanwhile, the 10-Yr Treasury yield has slid in recent weeks amid concerns about emerging market economies, which have driven investors into Treasuries.
An inversion of the yield curve is often interpreted as a recession-predictor, which has market participants nervously watching the 10-Yr/2-Yr spread inch lower. Every recession since 1970 was preceded by a yield curve inversion. However, we caution against reading too much into this single indicator. First of all, a yield curve inversion is not a very timely predictor of recession; during the previous cycle, the yield curve first inverted in late 2005, two years before the start of the Great Recession.
In addition, it is important to consider the yield curve in the context of various supply and demand drivers for Treasuries. In this cycle, quantitative easing (purchases of long-term bonds by the Fed) has pushed down the rate on the 10-Yr. Looking ahead, the unwinding of the Fed's balance sheet and an increase in Treasury issuance due to tax cuts and spending increases inform our call that the yield curve will generally move higher in a parallel fashion. Shifts in demand and/or supply of Treasuries for policy or regulatory reasons distort the signal from the yield curve about market pricing of risk.
Letting these caveats stand, the prospect of a yield curve inversion remains important because of potential reactions by market participants and the effect on Fed policy. This week, Federal Reserve Bank of Atlanta President Bostic (a voting member of the FOMC) stated that he would dissent against any interest rate hikes that would invert the yield curve. Two more rate hikes this year are already largely priced into the yield on the 2-Yr. However, concerns about yield curve inversion may prompt the Fed to pare back the pace of tightening next year.
Credit Market Insights
Credit Card Standards Tighten in Q2
Credit card lending standards tightened in Q2, according to results from the Federal Reserve's most recent Senior Loan Officer Opinion Survey (SLOOS). The net percent of banks that reported tightening standards for credit card loans rose to 12 percent, the highest share since 2009. While interest rates continue to rise and banks may be tightening lending standards in response to higher debt service costs, total credit card debt has actually come down slightly from its pre-recession peak as rising aggregate incomes have also likely better positioned most consumers to manage this type of debt.
However, total consumer credit liabilities have risen since 2009, as student and auto loans have come into the forefront as areas where consumers may be overleveraged. Both loan types, as a share of non-mortgage household debt, are now above their respective pre-recession peaks.
Interestingly, fewer banks in the SLOOS reported tightening lending standards for auto and other consumer loans in Q2. The net percent of banks reporting tightening standards for auto loans reached its lowest share over the past two years in Q2.
With these trends in mind, the shifting makeup of household balance sheets remains an area to watch as banks adjust lending standards in response to the Federal Reserve continuing to tighten policy. For now, only modestly tighter lending standards and a generally bright economic outlook should support most consumers' ability to pay back debt.
Topic of the Week
Buying on the Margins
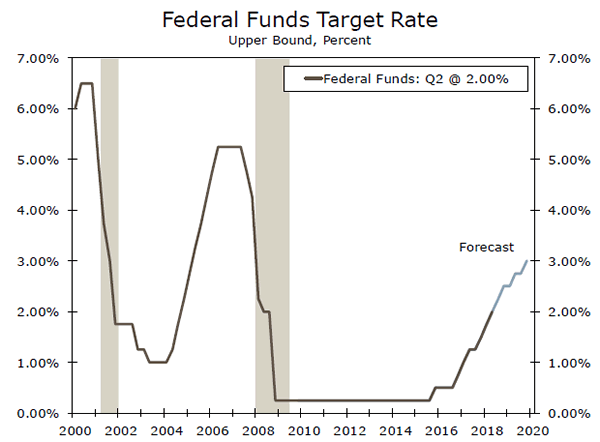
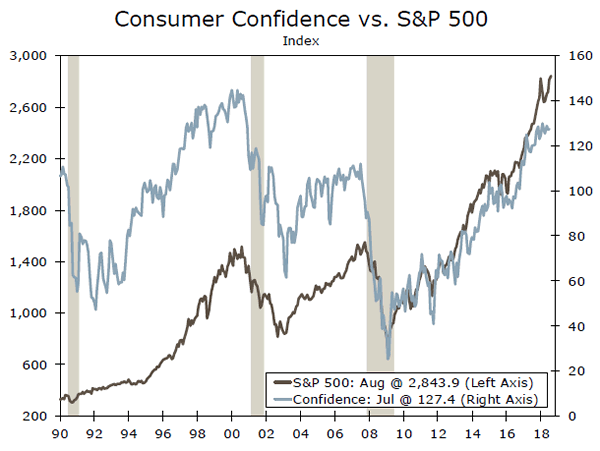
This week marks another milestone for the expansion with the current bull market becoming the longest on record. While length does not equate to strength (that record belongs to the 1990-2000 market) the ongoing climb has helped propel the recovery in consumer confidence and restore household financial assets to new highs (top chart).
Given the forward-looking nature of the equity market, the bull market's continued run is a plus for the near-term economic outlook. The Leading Economic Index, which includes the S&P 500, is up 6.3 percent over the past year. Our preferred recession probability model, which also includes the S&P 500 index, is currently predicting only a 2.2 percent chance of recession over the next six months.
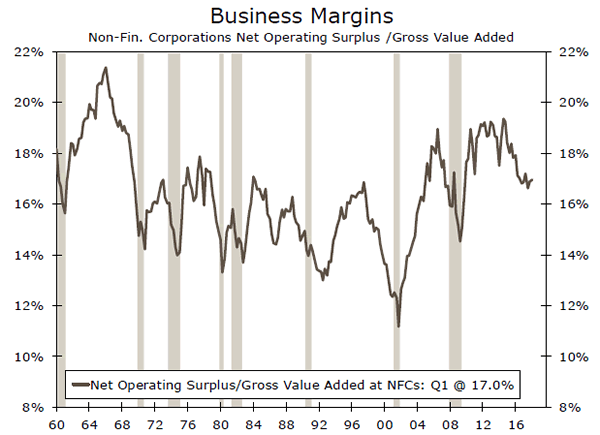
Underpinning the S&P 500's run has been rising profits at corporations over the past decade. But how much further can profits rise from here? We'll leave S&P earnings to equity strategists, but economy-wide profit growth is likely to get tougher in the coming year. The BEA's measure of corporate profits, which includes both private and public corporations, has risen 15.1 percent over the past year. That's the strongest gain since 2012 thanks in part to recent reductions in the corporate tax rate. Pre-tax profits have been somewhat less impressive, up 5.9 percent over the past year, but have benefited from the stronger demand backdrop as GDP has strengthened.
We expect economic growth to hold up fairly well in the coming quarters, with GDP running around 3 percent. Yet businesses are facing higher costs for materials and labor as the jobs market continues to tighten. At the same time, productivity growth remains rather weak, leading to upward pressure on unit labor and non-labor costs. We suspect that will weigh on margins and therefore overall profits unless companies are able to fully pass on costs— something which has proved difficult at the late stage of previous cycles (bottom chart). As a result, we see corporate profits growth slowing in the second half of the year and on into 2019.
The Weekly Bottom Line: Canada – Soft End to a Strong Second Quarter
U.S. Highlights
- Financial markets jitters have eased somewhat this week as concerns about emerging countries have temporarily subsided, helped in part by a lower U.S. dollar.
- Economic data was mixed. U.S. business investment remained upbeat in July, with new orders of capital goods (ex. aircraft) rising 1.4% m/m. Meanwhile, the housing market disappointed yet again in July.
- On the policy front, FOMC meeting minutes and a speech by Chairman Powell noted the recent strength in economic performance and confidence in the outlook, signaling continued gradual interest rate increases.
Canadian Highlights
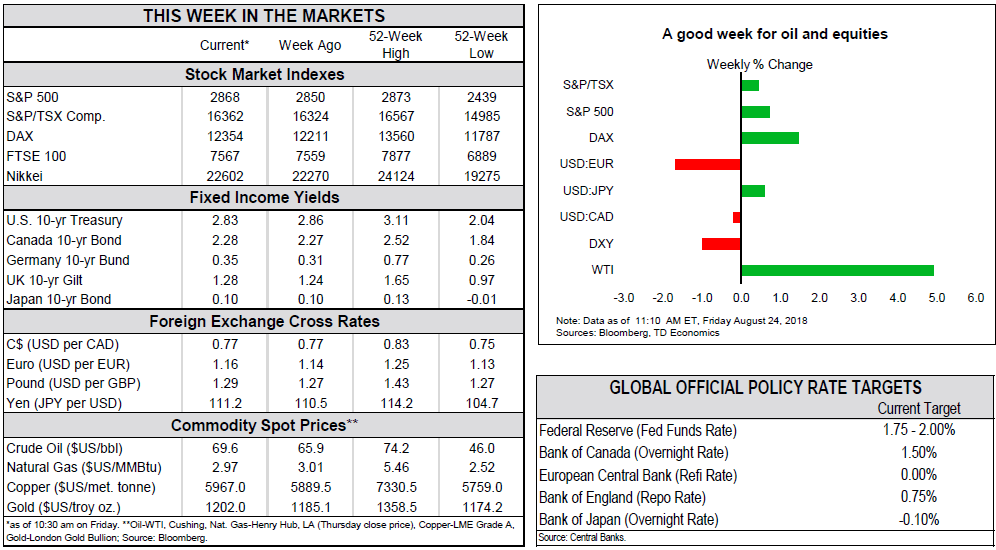
- The Canadian dollar edged higher this week as dovish comments by Federal Reserve Chair Powell weighed on the greenback. A softer dollar also supported oil prices, with the benchmark WTI up close to 5% from its close last week to just shy of $70 a barrel (as of writing).
- It was a light week for economic data. Wholesale and retail sales pulled back in June. Retail sales were up strongly in May, leaving the quarterly growth profile intact.
- Real GDP data will be released next week. We expect a strong 3.5% (q/q annualized) print. Growth appears widespread in the quarter, supported by a surge of exports following production disruptions early in the year.
U.S. - FOMC Signals Continued Gradual Rate Hikes
Aside from the political storm in Washington, this was a relatively quiet week. Data-wise, new and existing home sales and durable goods orders were on the docket. On the policy front, highlights included minutes of the FOMC meeting and the central bankers' conference in Jackson Hole. On the trade front, new China-U.S. trade talks failed to produce any meaningful results, while the latest batch of tariffs targeting $16 billion of each other's goods came into effect. Despite the deepening trade spat with China, U.S. business investment has remained upbeat in July, with new orders of capital goods (ex. aircraft) rising 1.4% m/m, up 8.5% from a year ago.
Financial markets' jitters eased somewhat this week as concerns about emerging countries have temporality subsided. This was helped by the lower U.S. dollar, which has reversed some of its recent strength following president Trump's comments that he was "not thrilled" about the Fed's interest rate increases.
Like it or not, the latest FOMC meeting minutes have signaled that the committee continues to view gradual interest rate increases as appropriate, so long as the economy evolves in line with its expectations. For now this continues to be the case. The committee noted the recent strength in economic growth and expressed confidence in the outlook, despite downside risks stemming from trade tensions. Taken together, these comments signal another 25 bp rate hike in September, and likely one more in December. At Jackson Hole, Chair Powell reiterated his support for the gradual pace of monetary policy normalization and defended the Fed's current approach.
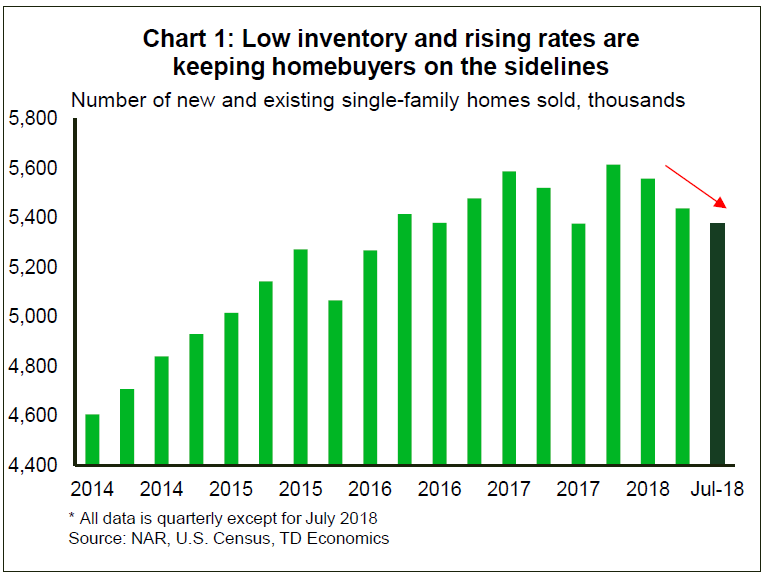
While the U.S. economy, broadly, is running at full throttle, the housing market has hit a speed bump (see Chart 1). Both new and existing home sales failed to make headway in the first half of the year, and this week's data suggests that the softness has extended into the third quarter. Existing home sales declined for a fourth consecutive month in July (-0.7% m/m), while sales of new homes slipped by 1.7% m/m, suggesting residential investment could again weigh on GDP growth in Q3.
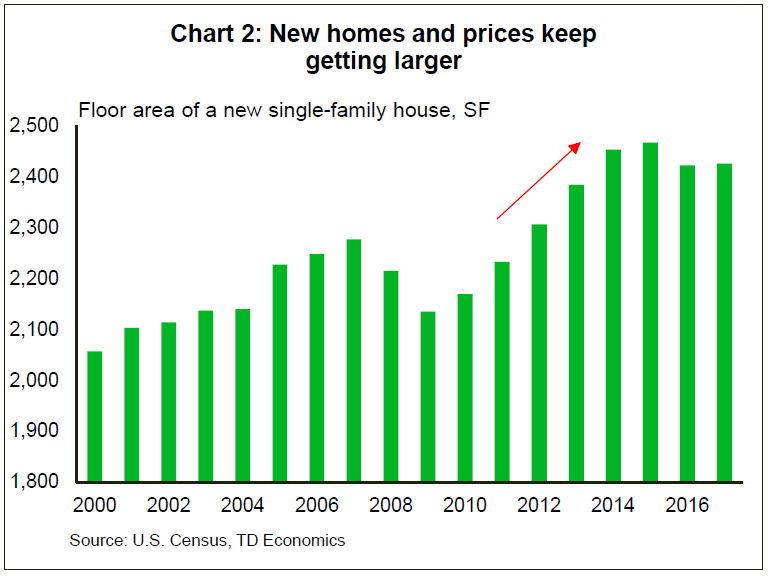
It is hard to square the housing market underperformance amid strength in other sectors of the economy as well as rising employment and incomes. Most commentators chalk tepid sales to low inventory, particularly in the entry-level segment. While new construction has been rising, it has been skewed toward higher end of the market with houses getting progressively larger during the recovery. Square footage of the median house was 13% larger in 2017 than it was back in 2004 (see Chart 2). Rising home prices and mortgage rates, which are up nearly 60 basis points since last year, have also dented affordability. These and other headwinds are likely to persist in the near term, however, but there are also some silver linings: price growth appears to be slowing and housing inventory finally stopped shrinking in July (on a y/y basis), stabilizing for the first time since the end of 2014.
Canada - Soft End to a Strong Second Quarter
It was ho hum week for Canadian equity investors. The TSX appeared set to end the week up slightly (+0.1% as of writing). The Canadian dollar also edged higher as comments by the Federal Reserve Chair weighed on the greenback. A softer dollar also supported energy prices, with the WTI benchmark up close to 5% from its close last week to just shy of $70 a barrel (as of writing).
It was a rather light week in terms of economic reports, with just wholesale and retail sales data. Still, these marked the final pieces of the second quarter data puzzle. Both indicators pulled back in June. In the case of retail sales, the modest decline followed an upward revision to an already-robust May print, leaving the quarterly growth pattern intact. Nonetheless, the pullback in these indicators to end the quarter suggests some slowdown in economic momentum for the third quarter, in line with our expectations.
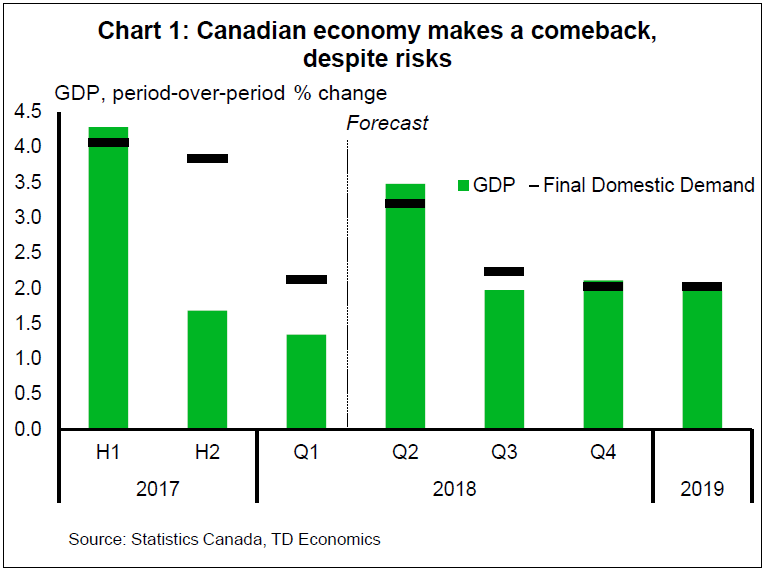
We will not have to wait much longer to find out just how well the Canadian economy performed in Q2. Real GDP data will be released next week. We expect a strong 3.5% (q/q annualized) print. Growth appears widespread in the quarter, supported by a surge of exports following production disruptions early in the year, but with household and business spending also performing admirably. Final domestic demand likely rose by over 3%, up from 2.1% in the first quarter (Chart 1).
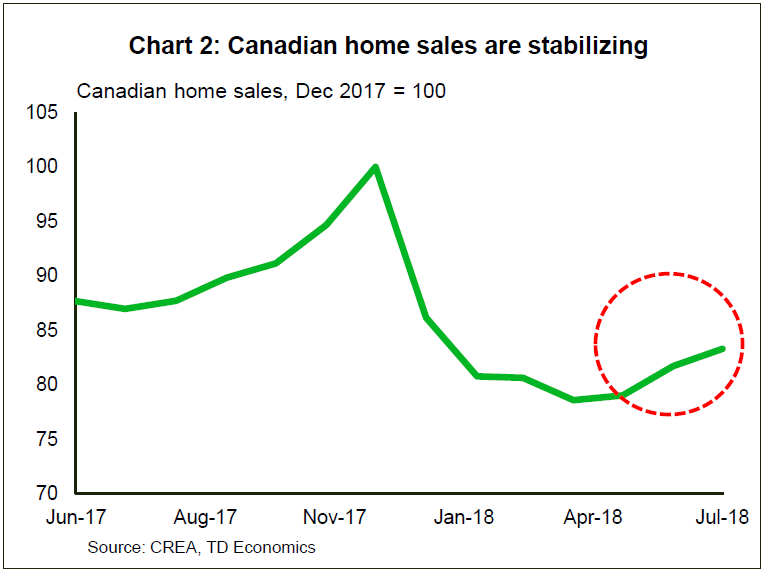
Notably, the acceleration is expected in spite of another likely pullback in residential investment, which was held back by slow sales activity. As we outline in a report released this week , housing markets have shown resilience following the policy-related pullback in activity early in the year. Sales have rebounded in recent months (Chart 2), bringing the market closer to seller's territory and putting a floor under prices. While growth is likely to be more subdued than it has been in the past several years and affordability will remain a constraint, the risk of a housing crash has diminished. With soft, but no-longer-declining housing activity, the Canadian economy appears on course to deliver modestly above-trend economic over the remainder of this year.
Late today, Governor Poloz will speak to reporters at the Jackson Hole monetary policy conference, ahead of a panel appearance on Saturday. These mark his final chances to comment on the Canadian economy before the blackout period preceding the Bank of Canada's next policy announcement on September 5th. With the improvement in economic data, the chances of a September hike have increased and investors will be looking for hints as to whether Poloz favors an earlier rather than later rate hike. We suspect that if he does comment on recent events he will remain balanced between recognizing recent strength and stressing the Bank's risk management framework. From our point of view, an October hike still remains the most likely, allowing the Bank the opportunity to reinforce its view with its updated economic forecasts.
Canada: Upcoming Key Economic Releases
Canadian Real GDP - Q2 & June
Release Date: August 30, 2018
Previous: 1.3% q/q, 0.5% m/m
TD Forecast: 3.5% q/q, 0.1% m/m
Consensus: 3.0% q/q, 0.1% m/m
Resurgent exports after production disruptions early in the year will act as the main driver sending second quarter growth to 3.5% (q/q, annualized). Export growth of 13.6% will likely attract many headlines, but the domestic picture looks solid as well. Final domestic demand likely grew by more than 3%, helped by a re-acceleration of consumer spending (forecast: 2.2%). Non-residential investment is expected to moderate from the first quarters scorching pace, but to a still-respectable 3% to 4% growth rate. Residential investment will likely come in negative for a second quarter, held back by the soft resale market early in the quarter, with soft construction activity also a possibility given the higher frequency data. From an income perspective, price gains across most major components should help nominal GDP hit a 5.7% growth pace for the quarter.
Industry-level GDP should post a 0.1% advance in June on a slowdown in services. Retail and wholesale sales both fell during the month and the steady grind higher in home sales will provide only a modest offset. This will leave goods sector output to drive the monthly print on strength in manufacturing sales and utilities, which are coming off an outsized pullback in May. This should provide a rather muted handoff to the Q3, which fits with our expectation for growth to slow to the low-2% range.
US Dollar Drops After Powell Stresses Gradual Approach to Rates
The US dollar is lower against most major pairs on Friday. The greenback was waiting for U.S. Federal Reserve Chair Powell’s speech at the central bank summit in Jackson Hole but in the end no new information was provided. Chair Powell reiterated the data dependency of the central bank and shared his optimism regarding inflation. The market is already pricing in two US rate hikes in 2018 and the somewhat dovish remarks from Powell did not add support to the US dollar.
- US Q2 GDP to remain at 4.0 percent
- Canadian Q2 GDP to make case for September rate hike
- NAFTA deal close to a handshake deal between Mexico and US
Dollar Fails to Gather Momentum on Powell’s Words
The EUR/USD gained 1.61 percent during the week. The single pair is trading at 1.1625 as the dollar continued to slide against the EUR on rising political uncertainty in Washington.
The U.S. Federal Reserve has already hiked twice in 2018 and is on the path to lift interest rates two more times before the end of the year. The minutes from the August Federal Open Market Committee (FOMC) puts the September meeting as a solid possibility with a December hike still on the table. The CME FedWatch has a 96 percent probability of a 25 basis points hike on September 26.
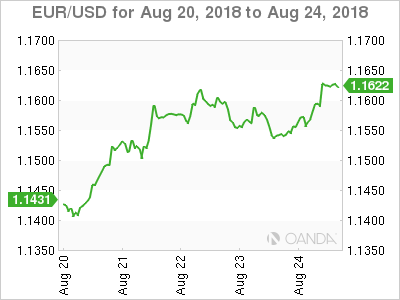
The EUR/USD is close to erasing the losses that started in August 1. Trade war concerns as US tariffs came into effect have triggered risk aversion taking the dollar higher but political turmoil surrounding the White House keep pressuring the currency downward.
The economic calendar next week is not crowded with the second estimate of Q2 GDP data in the United States the main realease. Growth is expected to remain close to 4.0 percent and to keep validating the policy decisions from the Fed. On the European calendar Germany’s Ifo Institute will publish its survey of business conditions and expectations.
Loonie Higher After Powell and Ahead of Poloz Remarks
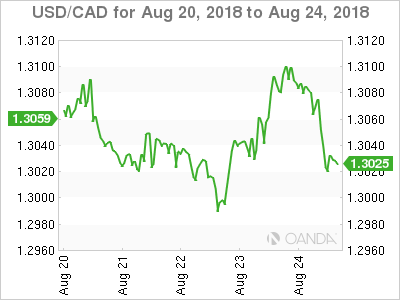
The USD/CAD fell 0.22 percent in the last five days. The currency pair is trading at 1.3033 after the remarks from Fed Chair Jerome Powell added little support to the greenback. Bank of Canada (BoC) Governor Stephen Poloz will speak on Saturday August 25 as part of the Jackson Hole Symposium.
NAFTA negotiations seem to be finally getting traction, but the choice of the US to deal with Mexico first still leaves a lot of question marks regarding how it will affect the Canadian economy. On Thursday Foreign Affairs Minister Chrystia Freeland said she was encouraged by optimism and ready to rejoin the talks. The Mexican team has said that they will work through the weekend and said that they haven’t bought their return tickets.
BoC Governor Poloz sounded optimistic on Friday that NAFTA will be worked out based on the developments of the last couple of weeks.
Oil Rebounds Boosted by Soft Dollar and Lower US Inventories
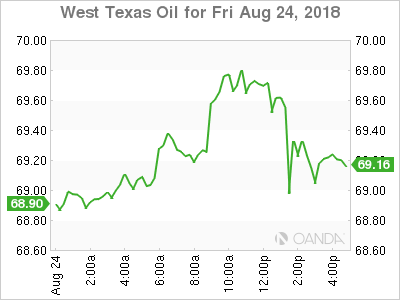
Oil prices recovered during the week. West Texas Intermediate is trading at $69.35 and since the Asian open the black stuff has headed higher. The release of a larger than expected US crude stocks on Wednesday put WTI over the $68 price level. The Energy Information Administration (EIA) reported a drop of 5.8 million barrels against a forecast of 1.6 million drawdown.
The US sanctions on Iran are beginning to have a negative effect on crude exports from that country, even though they don’t kick in until November. European airlines are halting flights to Iran with advance notice but most will end that route before the end of September.
The trade dispute between China and the US has kept oil prices from rising higher but for the moment the Iran disruption has cancelled out most of the effects of a possible oversupply if a full on trade war were to take place.
Market events to watch this week:
Wednesday, August 29
- 8:30am USD Prelim GDP q/q
- 10:30am USD Crude Oil Inventories
- 9:00pm NZD ANZ Business Confidence
- 9:30pm AUD Private Capital Expenditure q/q
Thursday, August 30
- 8:30am CAD GDP m/m
*All times EDT
German Ifo Business Climate to Edge up in August; May Struggle to Lift the Euro
The Ifo business survey out of Germany will be making the headlines on Monday at 08:00 GMT as investors look still for evidence that growth in the Eurozone’s largest economy is picking up. While recent data suggest the deceleration in growth has bottomed out and economic activity may even be quickening somewhat, many analysts remain cautious about the outlook for Germany and the wider euro area, and this is reflected in euro/dollar, which recently hit a more than one-year trough of $1.1300.
The Eurozone’s flash composite PMI released this week points to only a marginal improvement in business activity in August, led mainly by the services sector as the manufacturing PMI fell to a 21-month low of 54.6. Germany’s Ifo survey is also forecast to show a modest recovery for August. The Ifo’s closely watched business climate index is expected to increase slightly from 101.7 to 101.9. The business climate index had reached an all-time high of 105.2 in November before turning lower. The current conditions index, which measures businesses’ current situation, is forecast to improve for the second straight month, rising to 105.4, while the index measuring future expectations, is expected to edge up from 98.2 to 98.5.
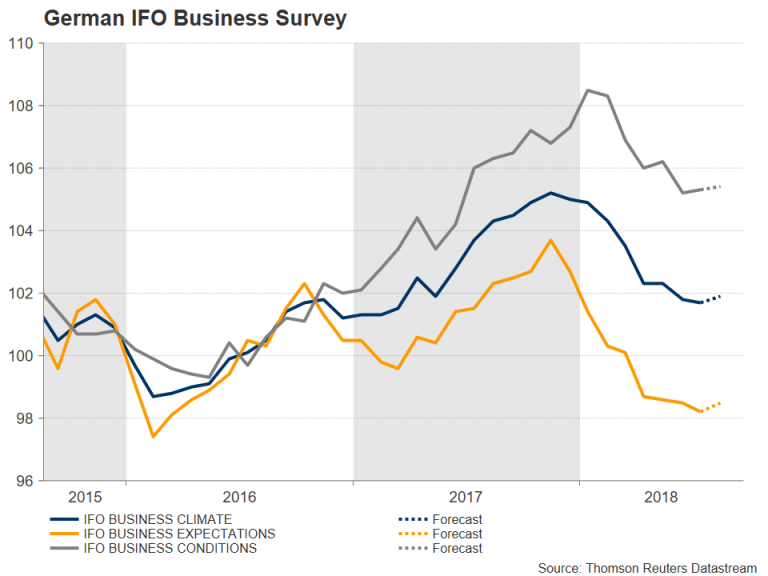
Other data released this week showed German GDP grew by 0.5% quarter-on-quarter in the three months to June, accelerating moderately from the first quarter’s 0.4% rate. While such figures may not be considered as awful and still represent a satisfactory pace of expansion, they are a few gears below the rates of growth enjoyed throughout 2017. And with global trade risks weighing heavily on businesses’ mind, the outlook for the rest of 2018 and 2019 is not as certain and positive as it was at the start of the year.
Only this week the US President, Donald Trump, once again raised the prospect of imposing 25% tariffs on car imports from the European Union, serving as a reminder that until the two sides have struck a new trade deal, the threat stands. German manufacturers are likely to be the worst hit in the Eurozone should the US decide to raise tariffs on EU cars and other products. The uncertainty has already had a dampening effect on German investor sentiment and growth may not fully bounce back until the threat of higher tariffs has been fully lifted.
In the meantime, euro/dollar could receive a small boost should the Ifo data beat expectations. The pair could advance above the 1.16 level, with a major hurdle arriving around the 1.1625 level. Further resistance could be met at the 1.1675 region before being able to test the 1.17 level. A climb above this key psychological level would bring into focus the strong resistance area of 1.1745, which the pair repeatedly failed to break in July.
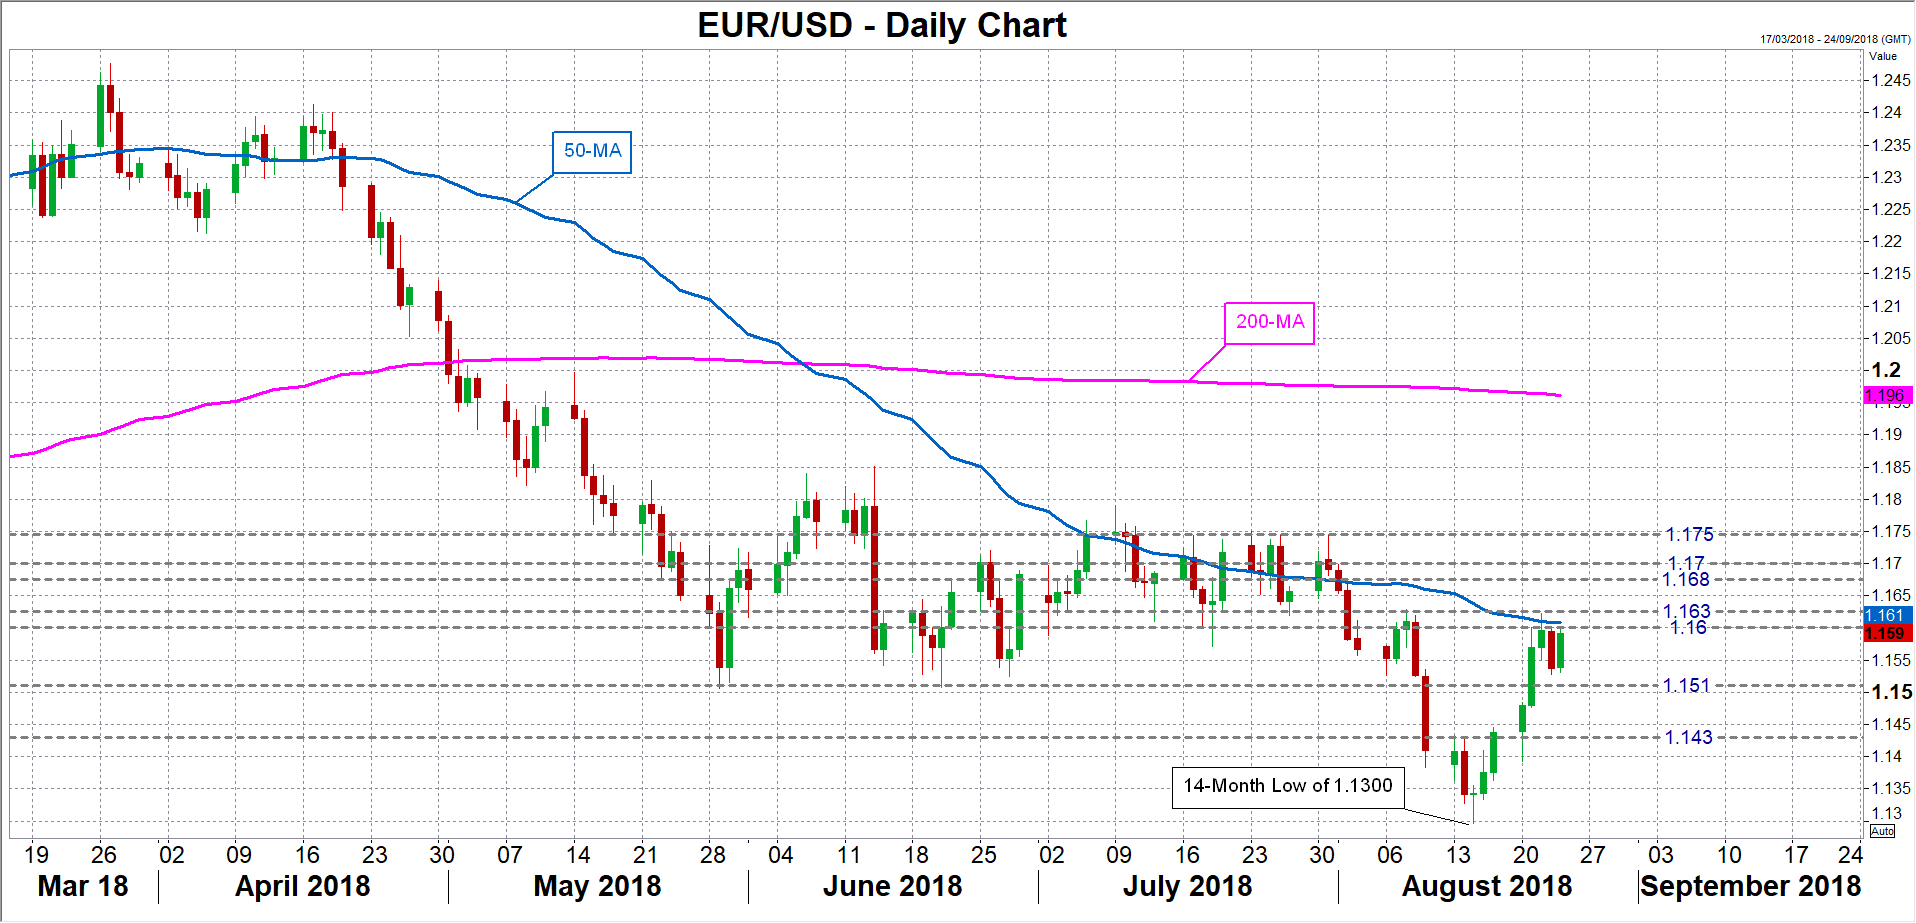
Should the data disappoint, however, euro/dollar could slip below nearby support at the 1.1510 mark. A drop below this level would open the way towards the 14-month low of 1.1300 set on August 15, but first, the pair might pause around 1.1430 – a recent congestion area. Sharper losses would likely see the next major support coming from the 1.11 handle.
Gold and USDCNH – Elliott Wave Analysis
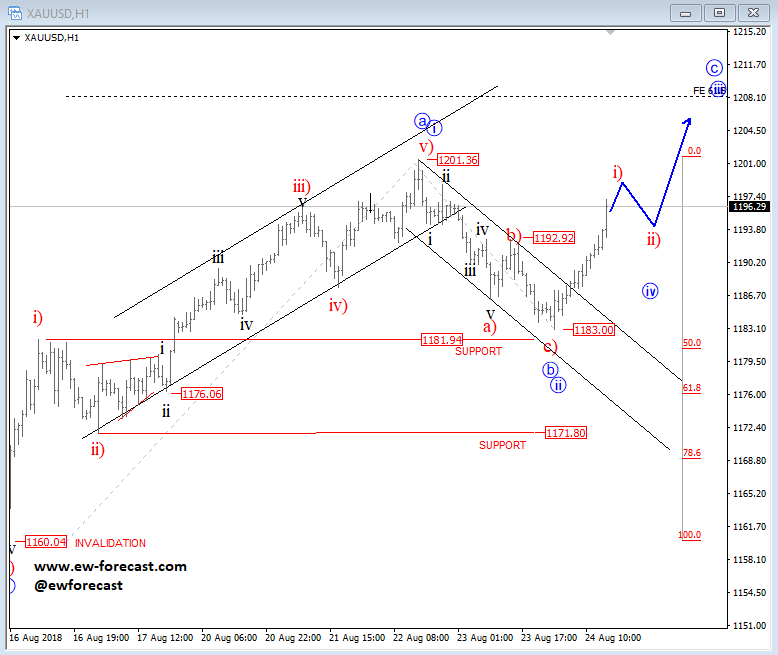
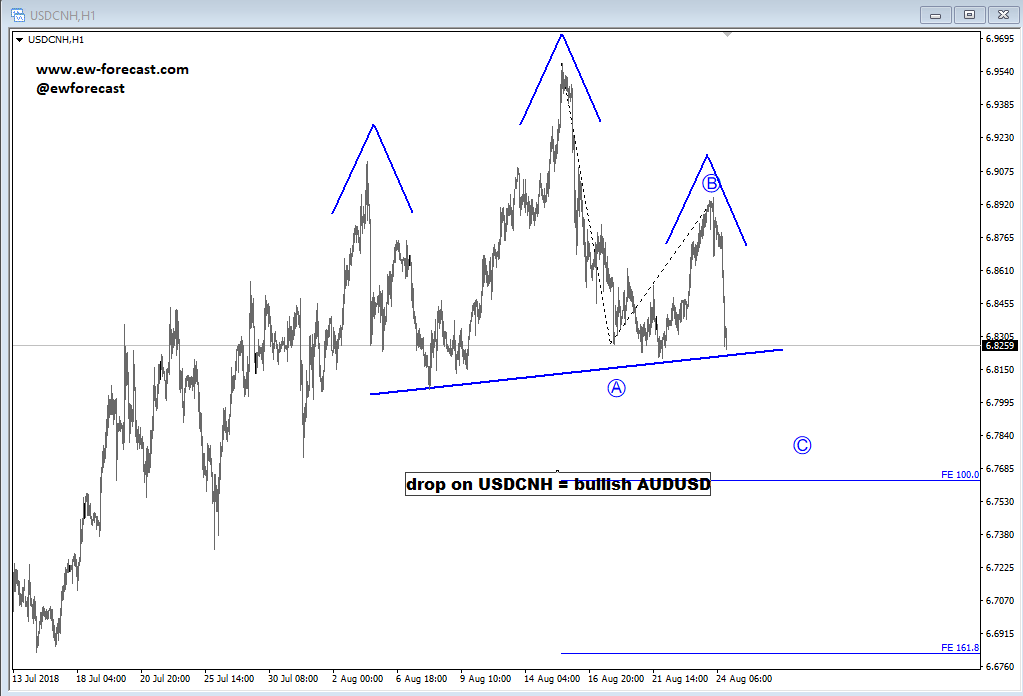
Gold is on the rise, now breaking well above the downward channel that put more bulls in play.. We see a very strong rise so it's part of a third leg up that can be headed to 1208/1210 area. At the same time we see USDCNH falling aggressively lower, probably into wave C that may starting to accelerate after that broken neckline which may cause more bulls for Aussie and GOLD.
Australia & New Zealand Weekly: RBA Cash Rate to Remain on Hold in 2020
Week beginning 27 August 2018
- Westpac extends forecast to 2020 - RBA cash rate to remain on hold in 2020.
- Australia: dwelling approvals, capex, credit.
- NZ: residential building consents, business confidence.
- China: official NBS PMI's.
- Europe: CPI, employment, ECB Chief Economist Praet speaks.
- US: PCE inflation.
- Key economic & financial forecasts.
Information contained in this report current as at 24 August 2018.
Westpac extends forecasts to end 2020 – RBA cash rate to remain on hold in 2020
To date Westpac has issued public forecasts for the outlook for growth and financial markets to March 2020.
These forecasts are incorporated in the August Market Outlook publication.
We are now extending those forecasts to end 2020.
Last year around this time we surprised markets by forecasting no change in the RBA cash rate out to end 2019. At the time markets were priced for at least three rate hikes (25 basis points per move) and the overwhelming majority of forecasters were anticipating the rate hike cycle to begin in 2018.
Markets have now partly moved into line with our view with only around a 50% probability of one rate hike by the end of 2019. Furthermore, 65% of forecasters in the Bloomberg survey are still expecting the cycle to begin by the third quarter of 2019.
Our view is that the cash rate is likely to remain on hold not only through 2018 and 2019 but also 2020.
Some may argue that we are unrealistically forecasting that Australia will completely miss the global rate hike cycle if rates remain on hold for such an extended period.
We differ from that view arguing that financial conditions are affected by more forces than just the RBA cash rate.
Through 2017 and 2018 we are already observing tightening conditions in the absence of RBA rate hikes.
This tightening is emanating from heightened macroprudential policies from the banking regulator APRA and the rise in wholesale funding costs for banks and corporates.
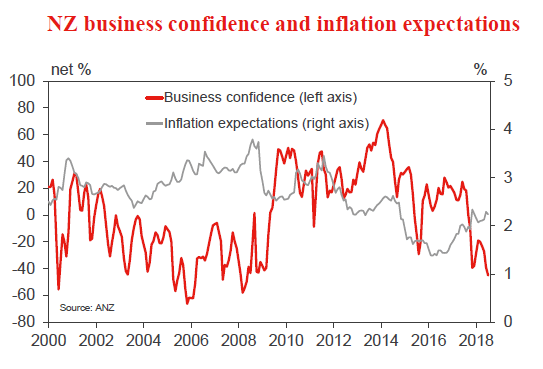
New lending to housing investors has fallen by 25% over the last year; housing credit growth is likely to slow from 6.5% in the year to September 2017 to 4% in 2018/19 and 2019/20. The bank bill rate has "settled" at around 25 basis points above those levels, which prevailed in previous years and is priced in markets to remain there for at least the next year or so.
As a direct reflection of that tightening in financial conditions we are now seeing housing markets weakening with outright price falls in both Sydney and Melbourne.
These price corrections look set to be sustained for at least the remainder of 2018 and 2019 with soggy markets likely prevailing through 2020.
Housing markets typically recover when there is an increase in new buyers in the market. That increase can be attributed to a boost in affordability or a rise in confidence.
In previous cycles affordability has been boosted by multiple rate cuts from the Reserve Bank; lower prices; and rising incomes.
In this cycle the Reserve Bank has made it clear that short of a major global financial shock (most likely emanating from China) or a major collapse in the local housing market, it will resist cutting the cash rate.
Neither of those scenarios figure in our central case.
Furthermore, we do not envisage a marked lift in income growth over the forecast period. Accordingly the "responsibility" for the restoration of affordability in the two major housing markets will accrue to prices. So an extended period of price weakness is required before we return to levels of affordability that will attract new buyers and stabilise the markets.
Confidence will also be a factor that will discourage new entrants over the 2019 period as the economy deals with uncertainty around the electoral process. In that regard the parties have significant differences regarding tax policies for property investors.
The global environment through 2019 and 2020 will not signal any need to further tighten financial conditions. We expect that the US economy will be slowing through the second half of 2019 and through 2020. We currently anticipate that the Federal Reserve will go on hold in the second half of 2019.
The risk to this scenario is a sharper increase in inflation in 2018 and 2019 as the US economy deals with the "cocktail" of an unemployment rate well below full employment and a strong fiscal stimulus. This would result in a larger and longer tightening cycle through 2019 to be followed by an even sharper slowdown in 2020.
China has signalled its commitment to reduce leverage. This is likely to be a sustained commitment through 2018; 2019; and 2020 as the authorities grapple with the need to diffuse the distortionary impact of the largely unregulated shadow banking system.
As we have seen in recent weeks the authorities will have no patience for a sudden slowdown in growth (likely precipitated by the reduced leverage and the concerns around trade wars). However the authorities are still expected to accept a gradual slowing to a growth pace somewhat below current market expectations, (Westpac expects China's growth rate in 2019 and 2020 to slow to 6.0%).
With the US and China in a slowdown phase it is unlikely that Europe or the emerging markets will be in a position to fill the "growth hole" that would develop in 2019 and 2020.
For Australia, we continue to expect that inflation will struggle to sustain the bottom of the Bank's 2–3% target zone. Low inflationary expectations; ongoing slack in the labour market; very limited upward pressure on wages; and falling energy prices will all keep the inflation rate anchored around 2%. (Recall that headline inflation has consistently undershot 2% for virtually all of the period since September 2014 and the Bank is predicting 1.75% for 2018).
In fact the Bank's own forecasts are not consistent with the pre conditions for a tightening until well into 2020. "It is likely to be some time before we are at full employment and the inflation rate is comfortably within the target range on a sustained basis". (Governor Lowe, Opening Statement to the House of Representatives Standing Committee on Economics, August 17).
Full employment is defined at 5% and the Bank does not expect to be there until the second half of 2020 while inflation is not forecast to be above 2% until 2020. As has been noted by Bank officials it is uncertain whether 5% is, indeed, Australia's full employment rate. Evidence from the US and some other countries points to the full employment rate being lower than in previous cycles largely due to structural change around technology and globalisation.
We are also sceptical about Australia's growth outlook.
The Reserve Bank is forecasting GDP growth of 3.25% (2018); 3.25% (2019) and 3% (2020). That compares with our forecasts of 2.7%; 2.5%; and 2.8%.
The key dynamic here is an expectation that the household can continue growing its consumption spending at around a 3% pace (note that the Bank consistently refers to the outlook for consumption being a source of uncertainty).
That will require a solid lift in wages growth (Government Budget forecasts of 3.25% in 2019/20 and 3.5% in 2020/2021) to support incomes; a negligible negative wealth effect from the falls in house prices and a sustained growth in employment averaging above 1.8% over the next few years.
We are more cautious about the outlook for wages growth expecting low inflationary expectations and considerable ongoing slack in the labour market to contain wage pressures. We also expect the current slowdown in employment growth to be sustained through 2019 particularly as the uncertainty around political developments weigh on business confidence, spending and employment plans.
In turn a cautious consumer is also likely to temper investment plans in plant and equipment.
While government spending will remain robust its contribution to growth will ease. Exports are also likely to support growth although the height of the boost from the LNG will be 2019 as production levels are expected to peak in that year. To an extent the slowdown in resource export growth will be compensated by the boost to services exports from the lower Australian dollar.
Conclusion
The Australian economy is currently being subject to tightening financial conditions despite the RBA cash rate remaining on hold. The impact of these tightening conditions is likely to last through 2018; 2019; and 2020. The Reserve Bank is unlikely to ease rates to offset these forces given the "high bar" it has set for cutting rates.
APRA and the Reserve Bank have used other policies to address Australia's household debt burden. These policies seem likely to be sustained for a number of years. No further conventional tightening of policy through a rate hike from the Reserve Bank seems likely – even as far out as 2020.
The Bank sets the unemployment rate and inflation as the keys to triggering higher rates. Our unemployment and inflation forecasts are consistent with steady rates in 2020.
Other issues supporting our view that rates will remain on hold through 2020 are a slowing in the global economy, particularly from the second half of 2019; a long adjustment process for house prices; low inflationary expectations; weak wages growth and a negative wealth effect.
We confirm our expectation that the Australian dollar will reach USD 0.70 in 2019 but, in response to a slowing US economy; the Federal Reserve going on hold and Australia's growth rate bottoming out in 2019 we expect that the AUD can recover slowly to around USD 0.75 through 2020 partly reflecting that weaker US dollar.
The week that was
The past week has been a quiet one for economic data, with political tension and monetary policy here and abroad instead the focus.
Beginning with the RBA, the minutes from their August Board meeting carried a very familiar tone, showing optimism over the global outlook (albeit while noting caution over trade policy and China's financial system) and confidence in the underlying strength of our own economy. Notably, the RBA highlighted that they believe the "recent increase in minimum wages, the announcement of future tax cuts, and expectations of a further tightening in labour market conditions had reduced some of the uncertainty around the outlook for consumption." The outlook for business investment was also viewed favourably, although non-mining investment growth was expected to be a little softer than the past year. The discussion of housing market developments was limited to the facts, with no outlook or overt concern offered. All things considered, the RBA remains of the view that the next move in rates is more likely to be up than down, albeit not in the near term.
On that front, this week Westpac Economics extended our longheld on-hold call for the RBA's cash rate to the end of 2020. As detailed by Chief Economist Bill Evans:
"Last year around this time we surprised markets by forecasting no change in the RBA cash rate out to end 2019. At the time markets were priced for at least three rate hikes (25 basis points per move) and the overwhelming majority of forecasters were anticipating the rate hike cycle to begin in 2018. Markets have now partly moved into line with our view with only around a 50% probability of one rate hike by the end of 2019. "
While the RBA's cash rate has been on hold, financial conditions have clearly tightened in Australia as a result of APRA's macroprudential policies and the rise in wholesale funding costs for banks and corporates. Australia's housing markets have weakened as a result, a correction that we believe is likely to continue for at least the remainder of 2018 and 2019. Housing is then set to remain soggy through 2020 in the absence of support from a rate cut or a marked lift in income growth – as has been seen in the past.
More broadly for Australia, we look for labour market slack and subdued wages growth to persist. Under such a scenario, the optimistic expectations of the RBA and Government around the consumer are unlikely to come to pass, also limiting the upside for business investment. We believe this combination is expected to keep GDP growth at or below trend through the end of 2020, and inflation near the lower bound of the RBA's 2–3% target range.
To this domestic view, the global economy creates a number of risks, largely to the downside. Of particular note is the domestic slowdown in China, led by systematic reform of their financial sector and government directives on investment, further exaggerated by trade tensions with the US. Note that the latter escalated further this week, as the US and China made no progress during two days of talks, and the next wave of tariffs on $16bn of imports from each nation came into effect.
Of the releases made available, Australian construction work done was most worthy of note. The headline print was above expectations at 1.6% as new housing construction formed a double peak (the first having been seen in 2016) and public sector infrastructure spending showed continued strength. Whereas residential investment will slow through 2019, growth in public sector spending will endure. The reason being, Australia is still in catch up mode on infrastructure investment, with a clear need to build out transport and essential infrastructure to meet the needs of a rapidly growing population. This is particularly the case in Sydney and Melbourne. For June quarter GDP though, the strength shown in residential construction will be offset by a pullback in renovation work, as the latter has a higher weight in the calculation of GDP than in this release.
Finally coming back to monetary policy, the minutes of the July/ August FOMC meeting were also released in the US. There were two key take outs. The first is that rate hikes will continue in the near term, supported by a strong labour market, fiscal stimulus and underlying momentum. We see a window for four more hikes from September 2018 to June 2019.
Thereafter, a material change in the FOMC's stance is likely to be seen as growth slows back to trend from late-2019. From that point until the end of our 2020 forecast horizon, we believe the fed funds rate will remain unchanged and market pricing will adjust to view June 2019 as the peak in the fed funds rate for this cycle. Into the weekend, the Kansas City Federal Reserve's Jackson Hole economic conference will continue. Chair Powell's address on 'Monetary policy in a changing economy' will likely provide further guidance on the outlook.
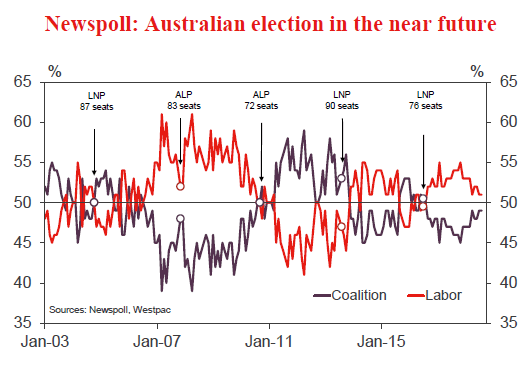
Chart of the week: Australia leadership spill
After the motion to spill the Liberal Party leadership was carried, the former Prime Minister Malcolm Turnbull has reportedly indicated that he will leave Parliament not before too long.
The consequent follow-up leadership vote saw a victory for the new Prime Minister Scott Morrison and his deputy Josh Frydenberg.
The Government has until May 2019 to call the Federal Election with the most recent polling suggesting that they trail the opposition Labor Party.
New Zealand: week ahead & data wrap
Falling into place
We recently released our latest Economic Overview1. It highlights that the economic slowdown that we have long warned of is well in train, with earlier drivers of growth having now moved into new phases. The coming year will see a temporary pickup in growth, supported by firmness in export earnings and large increases in fiscal spending. Nevertheless, economic growth over the next few years will be noticeably slower than it was between 2014 and 2016.
After fairly modest growth of 0.5 to 0.6% in recent quarters (rates that were effectively the same as population growth), we expect that GDP growth rebounded to around 1% in June. That's in part due to some temporary factors, particularly in the agricultural sector. Retail sales data this week have added credence to the idea of a near-term bounce in GDP, with a stronger than expected 1.1% increase in spending in June, underpinned by a lift in core categories.
This rebound in GDP growth is likely to come as a surprise to the Reserve Bank, whose latest policy assessment only factored in an increase of 0.5% in the June quarter. That's particularly important for financial markets. Since the RBNZ's August Statement, markets have been pricing in some chance of a near-term rate cut and the NZ dollar has taken a step down. But with it now looking increasingly likely that growth will surprise the RBNZ to the upside, we could see some correction when June quarter GDP is released in late September.
But while GDP growth looks to have rebounded recently, stepping back and looking at the economy more broadly leaves us with a picture of cooling activity. On an annual basis, we estimate that GDP growth has slowed to 2.7% in the year to June. That's a noticeable step down from the rates of 3.5 to 4% annual growth that we saw in earlier years.
This cooling in economic growth has been playing out very much as we have expected. As we've been highlighting for some time, several of the key factors that underpinned demand in recent years have been evolving, and are no longer providing the same boosts to growth that they once did. We've seen this on several key fronts.
First is reconstruction spending in Canterbury, which has slowed sharply since it peaked over 2015 and 2016. The continuing wind down in reconstruction work will be a drag on growth for several more years, the impact of which will be felt across the economy.
Construction activity more generally remains elevated, but the sector is unlikely to be the driver of growth and employment that it was in earlier years. That's because factors such as stretched capacity, rising costs, and difficulties accessing finance are providing a brake on how quickly building activity can ramp up.
Tax changes have seen house price inflation slowing sharply, with particular softness in Auckland. Restrictions on foreign buyers that are about to come into effect will reinforce this weakness. However, we expect that a drop in mortgage rates and a likely easing in the Reserve Bank's loan-to-value restrictions in January will provide some counterbalance. Nevertheless, we are still looking at a subdued outlook for house prices, with modest house price declines over the next few years. And with New Zealand households holding a large proportion of their wealth in owneroccupied and investment housing, this will be a significant drag on spending.
Finally, net migration remains elevated, but has been declining. Figures out over the past week showed that the net inflow of people into the country has slowed to just under 64,000 in the year to July - its lowest level since 2015. We expect that net migration will slow substantially further over the coming years. That will see population growth slowing from around 2% currently to around 1% in 2022, signalling a huge reduction in what has been an 'easy' source of demand growth for many businesses.
Against this cooling in GDP growth and changes in the policy back drop, we have seen a sharp decline in business confidence. However, business surveys appear to be overstating the degree of weakness in activity. In fact, we expect that the next phase of the economic cycle will be a pickup in GDP growth to just over 3% in 2019.
Underpinning the expected lift in near-term growth are large increases in Government spending that are now being rolled out. That includes around $1.5b of spending on the Government's families package and accommodation support payments, as well as increased spending in areas like health and education.
Strength in the export sector will also help to bolster New Zealand's economic performance. While there has been a softening in the prices for some commodities recently (most notably dairy prices, which were down another 3.6% in the latest auction), the terms of trade remain elevated. We're also seeing continued firmness in services exports. Going forward, export returns will be boosted by the depreciation of the New Zealand dollar, which we expect to continue over the coming year.
However, the above factors are only providing a temporary fillip. Beyond 2019, we expect GDP growth to cool once again, as slowing population growth and weakness in the housing market offset increases in fiscal spending. Overall, growth over the next few years will be noticeably slower than it was between 2014 and 2016.
Data Previews
Aus Jul dwelling approvals
- Aug 30, Last: 6.4%, WBC f/c: –3.0%
- Mkt f/c: -2.0%, Range: -5.0% to 2.0%
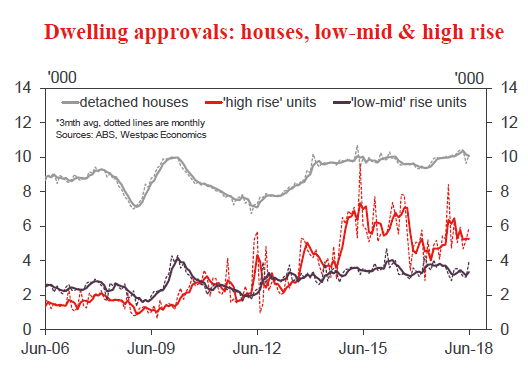
Dwelling approvals bounced 6.4% in June, coming in well above expectations. The detail confirmed May's 2.5% decline was likely a data issue with Qld approvals rebounding from their extreme fall. Outside of this, the picture is more mixed but is clearly not showing the anticipated weakening, particularly across high rise which recorded another relatively strong month.
Approvals are likely to retrace 3% in July with some risk of a sharper fall. Construction-related finance approvals have been pointing to a pull-back in non high rise approvals for several months now, a shift that has not yet materialised. Similarly, site purchases have been pointing to a further sharp leg lower for high rise approvals for some time now. With the Sydney and Melbourne housing markets swinging into price corrections and financing conditions tightening for both home buyers and developers, we may also start to see projects proceed more slowly or be shelved altogether
Aus Q2 business capex
- Aug 30, Last: 0.4%, WBC f/c: 0.3%
- Mkt f/c: 0.6%, Range: -1.0% to 3.0%
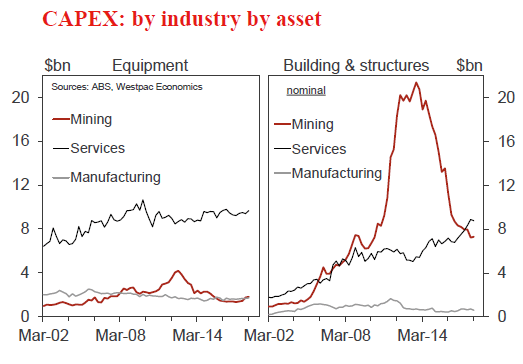
Business capex spending turned the corner in 2017, with the mining investment wind-down almost complete and an emergence upswing in non-mining investment. Capex rose 4% in 2017 after four years of decline.
In 2018, capex edged 0.4% higher in Q1 and we anticipate a rise of 0.4% in Q2.
Building & structures capex is expected to slip, declining by 0.3%. The Construction Work survey reported that infrastructure activity fell (as gas projects are completed), largely offset by a rise in non-residential building work.
Equipment spending has trended higher since mid-2017, emerging from a soft spot over the second half of 2016. We anticipate a further gain in Q2, a forecast +1%. Profits are up, so too capacity utilisation levels, global growth has been strong and there are positive spill-over effects from the strong upswing in public infrastructure.
Aus 2018/19 capex plans
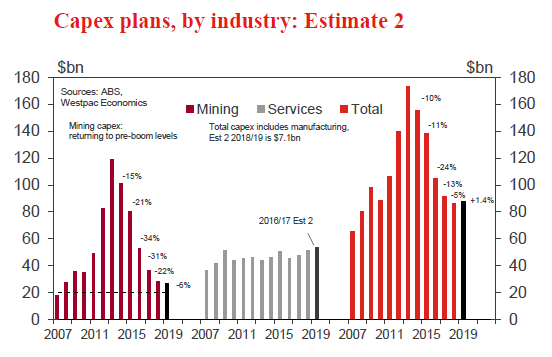
- Aug 30, Last (Est 2 for 2018/19): $87.7bn, +1.4%
This survey, conducted during July and August, includes the 3rd estimate of capex spending plans for 2018/19.
In the previous survey, Est 2 for 2018/19 was $87.7bn, 1% above Est 2 a year ago. This is the first positive 'Est 2 on Est 2' comparison since 2012/13.
For mining, Est 2 on Est 2 is only a modest negative, at -5.8%. For services, Est 2 vs Est 2 is +4.8%, evidence that the investment upswing is set to continue.
This update is likely to confirm the broad themes evident in the capex survey 3 months earlier. However, as to the value of Est 3, we see the risk of some apparent slippage.
For Est 3 on Est 3 to be at +1% (matching the Est 2 on Est 2 outcome) would require an upgrade to $104bn. That is a hefty 19% above Est 2 - yes the same upgrade as this time last year, but that was an abnormally sharp increase (the largest since 1988/89). A figure around $102bn, -1% vs Est 3 a year ago, may be more achievable.
Aus Jul private credit
- Aug 31, Last: 0.3%, WBC f/c: 0.3%
- Mkt f/c: 0.3%, Range: 0.2% to 0.5%
Private sector credit growth is modest and slowing as housing cools. Monthly growth averaged 0.3% in Q2, and annual growth eased to 4.5%, down from 5.5% a year ago. For July, we anticipate an increase of 0.3%.
Housing credit, at this late stage of the cycle, is slowing as tighter lending conditions see new lending decline, particularly for investors. In June, total housing credit growth was 0.34%mth, 5.6%yr, while the figures for investors were -0.1%mth, 1.6%yr.
Business credit, 3.2% above the level of a year ago, is volatile around a modest uptrend as businesses increase investment in the real economy, spending which is in part funded by retained earnings. The June month was an 'average' one, with a gain of 0.3% - we anticipate a similar result for July.
Personal credit continues to contract, -1.3% over the year.
NZ Jul residential building consents
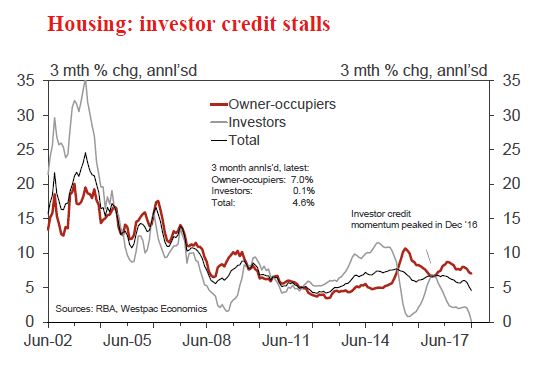
- Aug 30, Last: -7.6%, WBC f/c: -5%
Residential dwelling consent issuance fell by 7.6% in June. However, that followed solid levels of dwelling consent issuance in the preceding months, and still left consent numbers at a high level.
Recent volatility in consents has been related to apartments and retirement villages, which tend to get issued in lumps. We expect that swings in this group will again contribute to a modest 5% fall in July (that follows a large increase in June centred on Wellington).
The more interesting story is what's happening to consents for stand-alone and medium density housing in Auckland. Issuance in these groups has taken a large step higher in recent months, supported by regulatory changes and strong population growth. Smoothing through month-to-month swings, we expect issuance in these categories to remain firm.
NZ Aug ANZ business confidence
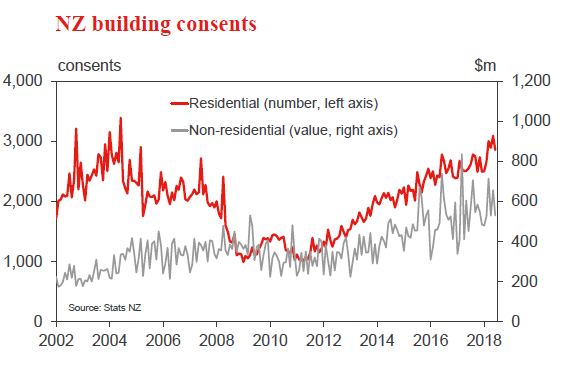
- Aug 30, Last: -44.9
Business confidence has lurched lower again in recent months, with the July survey falling to levels last seen during the Global Financial Crisis.
There is no doubt a political element to this survey, with firms displeased in particular with the new Government's intended changes to employment law. However, confidence has been falling since well before the election, and there does appear to have been some genuine slowing in growth in the last year.
Inflation expectations have been higher since the election, with rising fuel prices likely playing a role as well. However, firms still don't seem all that confident about their ability to pass on cost increases; pricing intentions have remained within a range over the last year or so.
Week Ahead – US PCE inflation, Aussie Capex and Canadian GDP to Highlight Another Muted Week
As summer draws to a close, it will be another lacklustre week for economic data in the coming seven days. The biggest weight will therefore fall on PCE inflation numbers out of the US, GDP figures from Canada and Australian quarterly capital expenditure data to keep the markets alive, barring of course any fresh developments on the trade front or in the Brexit negotiations. Other notable releases will include Eurozone flash inflation estimates, Chinese manufacturing PMIs and the second reading of US GDP growth for the second quarter.
Australian capex eyed for GDP clues
After the past week’s quarterly construction data, investors will get another chance to gauge the strength of the Australian economy in the three months to June with the release of quarterly capital expenditure figures on Thursday. The indicator for construction work done beat expectations by a wide margin and healthy business spending numbers next week would further point to another solid quarter of GDP growth following the robust first quarter performance. Capital expenditure is forecast to come in at 0.6% quarter-on-quarter, ahead of the Q2 GDP estimates scheduled for September 5. Meanwhile, traders should additionally keep an eye out for July figures on building approvals, also due on Thursday, and private sector credit data on Friday.
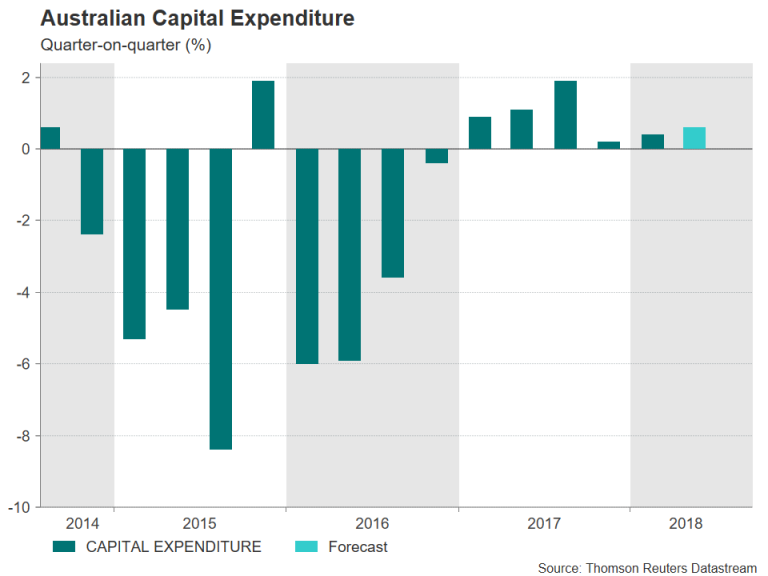
The Australian dollar could be in line for a significant boost from better-than-expected capex numbers, having already rallied late this week after major political uncertainty was removed following the resignation of the prime minister, Malcolm Turnbull, and his replacement by the finance minister, Scott Morrison.
Another risk for the aussie next week are China’s official PMI releases. The manufacturing and non-manufacturing PMIs are both due on Friday. The manufacturing PMI is expected to ease from 51.2 to 51.0 in August, which would mark a six-month low. Australia’s currency is viewed as a liquid proxy for China-related trades as China is Australia’s biggest export destination. Any evidence that the Sino-US trade war is starting to hurt business activity in China would likely be negative for the aussie.
Japanese industrial production to nudge up in July
Japan’s economy grew by a better-than-expected 1.9% annualized rate in the second quarter, bouncing back impressively from a first quarter dip. However, with trade tensions remaining high, growth could be cooling again in the third quarter, with industrial output falling sharply in June and exports rising at a slower pace in July. Industrial production is forecast to post a small rebound in July, growing by 0.2% month-on-month in the preliminary estimate. A negative print could weigh on the yen as it would make it difficult for the Bank of Japan to exit from its massive stimulus program anytime soon. Other data though is more likely to underline the bright spots in Japan’s economy. Retail sales figures on Thursday and the unemployment rate on Friday, both for July, will be looked at to assess the strength of domestic demand. It follows recent encouraging signs that a tightening labour market is finally starting to lift Japanese wages, which in turn is boosting household spending.
Business sentiment gauges and flash CPI to be European focus
With the third quarter now well underway, there’s been little sign of the Eurozone economy regaining the strong momentum it had enjoyed in 2017, even though the slowdown seen in the first half of this year was anticipated to be temporary. While recent indicators suggest some improvement in Eurozone growth in Q3, new risks, mainly trade protectionism, look set to continue to weigh on regional business confidence in the coming months. The Eurozone composite PMI released this week showed only a marginal recovery in economic activity in August. Germany’s Ifo business climate barometer, due on Monday, and the European Commission’s measure of economic sentiment out on Thursday are not expected to paint a different picture. The Ifo business climate index is forecast to edge up to 101.9 in August, while the economic sentiment index is expected to fall slightly to 112.0. The disappointing growth hasn’t acted as too much of a drag on prices however, as the bloc’s consumer price index hit a 5½-year high of 2.1% in July. It is expected to remain unchanged in August when released on Friday.
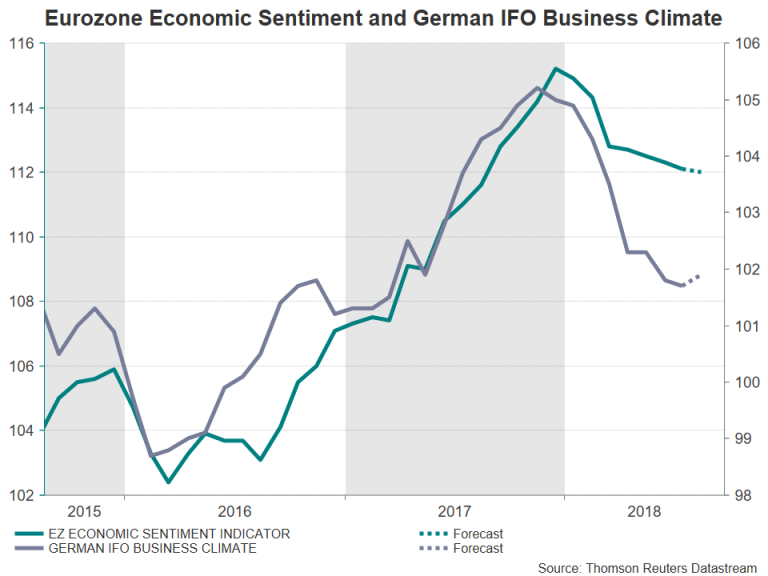
With expectations of a major turnaround in the Eurozone economy running low, any positive surprises in the data could buoy the euro, helping it recover further from last week’s 14-month low of $1.1300.
Across the channel, speculation about the direction of the Brexit negotiation will probably remain the main driver for sterling as there will be no major data releases coming out of the UK. However, comments from the Bank of England Governor, Mark Carney, might move the pound when he testifies on the Bank’s inflation report before a Parliamentary committee on Tuesday.
US PCE inflation to underscore Fed rate hike path
There will be several key releases coming out of the United States next week, starting with the Conference Board’s closely watched consumer confidence index on Tuesday. The index is forecast to slip to 126.5 in August from 127.4 in July, sticking close to the 18-year high of 130.0 it set in February. On Wednesday, pending home sales for July are due but a bigger attraction that day will be the second estimate of GDP growth for the second quarter. The preliminary print produced an annualized figure of 4.1% – the highest since Q3 2014. A modest downward revision to 4.0% is expected in the second publication. A bigger negative revision, specifically, one below 4%, could erode some of the bullish perception for the US economy.
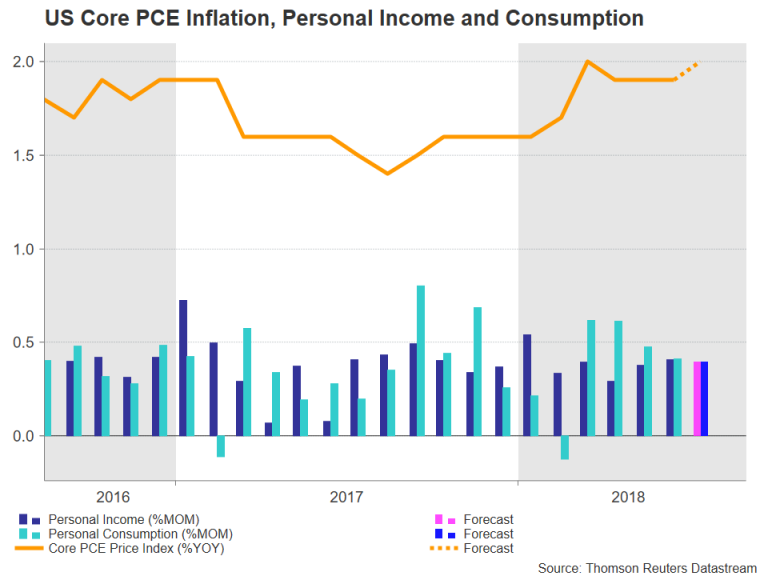
However, any possible knock to the US dollar from a downward revision would likely be short-lived as the personal consumption expenditures (PCE) report on Thursday is anticipated to show an uptick in the Fed’s preferred measure of inflation. Last month’s report saw major revisions to past data, revealing that the core PCE price index hit the Fed’s 2% target earlier than thought, in March, before dropping to 1.9%, where it has held for the past three months. It is projected to inch back up to 2.0% in July, which, if confirmed, would reinforce expectations of two more rate increases by the Fed for the remainder of 2018. Alongside the PCE inflation figures, the latest monthly numbers on personal income and spending are also due.
Finally, on Friday, the Chicago PMI for August should be watched together with the final consumer sentiment reading by the University of Michigan, also for August.
Canadian GDP data could seal a September rate hike for the BoC
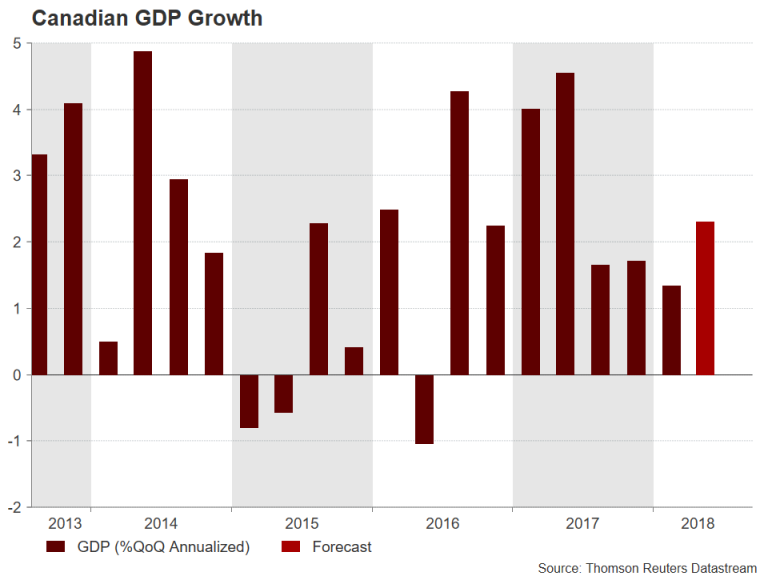
While most investors are convinced that there will be at least one more rate rise by the Bank of Canada in 2018, the timing is still open to discussion. The odds for a September move currently stand at about 40% (increasing to over 90% for October). Should incoming data surprise to the upside, a rate hike as early as the September 5 meeting could become more probable, giving the Canadian dollar a lift. The first opportunity for a positive data read is Thursday’s GDP figures for the second quarter. Canada’s economy is forecast to have expanded by an annualized rate of 2.3% in the three months between April-June. Given the recent run of upbeat economic indicators, a GDP beat is more likely than a miss. Also worth monitoring out of Canada next week are July producer prices scheduled for Friday.
Weekly Focus: Troubles in Emerging Markets
Market Movers ahead
- Inflation releases in the euro area and the US are in focus this week.
- In the US, PCE core inflation continued to tick upwards to 2.0% y/y in July.
- In the euro area, headline inflation is set to tick lower in August, while underlying inflation continues its move upward.
- Key emerging markets Turkey, Brazil, South Africa and Russia will be in focus together with the looming trade war between China and the US.
- There are several interesting releases in the Scandie markets, including Danish Q2 GDP, the Business Survey indicator in Sweden and unemployment data in Norway.
Global macro and market themes
- Emerging Market (EM) sentiment has been hit not only by rising USD and rates and the trade war, but also increased sanction risk from the US.
- The most vulnerable economies in EM at the moment are Turkey, Argentina, Russia, Brazil and South Africa.
- Contagion to other EMs should be limited unless Brazil escalates into a crisis.
- After failed trade talks between China-US, we expect an escalation in the trade war in early September, which could weigh further on EM sentiment.
US: Big Old Jet Airliner, Don’t Carry Me Too Far Away
Durable goods orders fell 1.7 percent in July, a bigger drop than was expected. Aircraft orders accounted for most of the weakness though, with bookings off more than 34 percent in both civilian and military orders.
Otherwise a Mostly Good Report
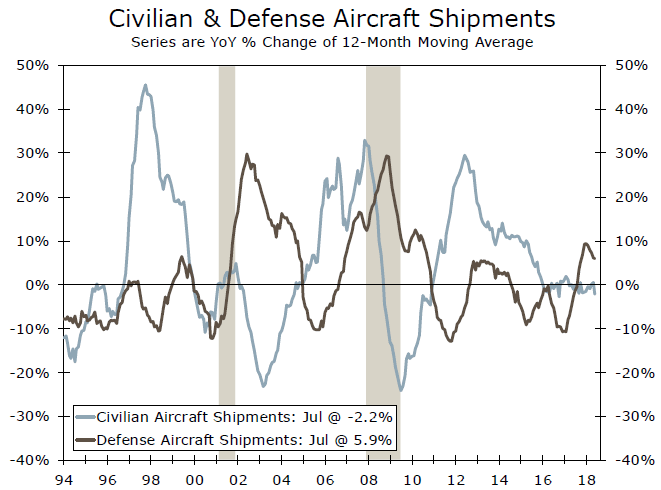
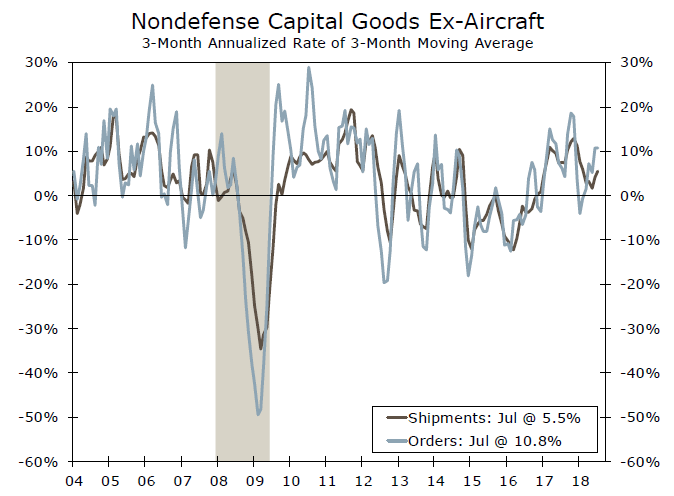
Orders for durable goods at U.S. manufacturers fell 1.7 percent in July, as a slip in monthly orders previously reported at Boeing presaged the drop of more than a third on both the defense side and the civilian side. Shipments of civilian aircraft were down again, and defense aircraft shipments were up; both developments here in July are in-line with recent trends (top graph).
When you strip away aircraft orders, there was fairly broad-based strength, but that is not to say that we can safely look past the weakness. In its initial estimate of equipment spending for GDP, the BEA includes aircraft and that means for this July print (the first month of the third quarter), we are not starting the quarter on a good note. We need to see a strong bounce-back in nondefense shipments (especially aircraft) in August and September to save the quarter for equipment spending. With orders in other categories still mostly positive and unfilled orders of nondefense aircraft still elevated, we maintain our call for real equipment spending to rise in Q3.
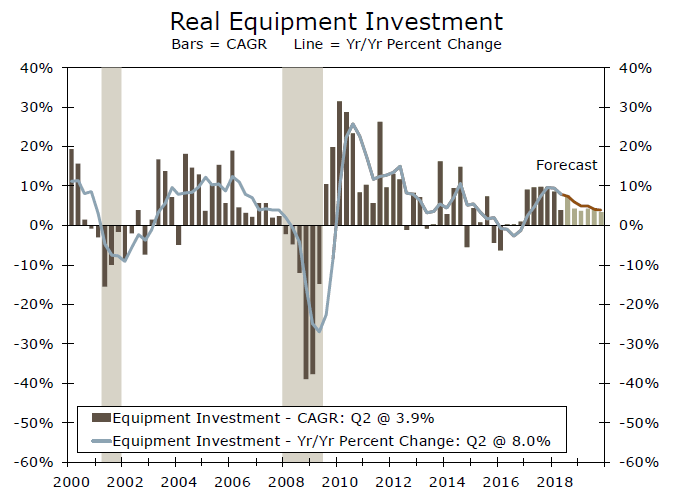
Business spending on new capital equipment was a significant driver of economic growth at the start of this long expansion, but a drop in oil prices in mid-2014 was quickly followed by spending cuts from late 2014 through early 2016. More recently, equipment spending has seen consistent, if somewhat underwhelming, growth.
For nine consecutive quarters, cap-ex on equipment has been positive in the GDP report, but the annualized growth rate has not broken into double digits on a percentage growth rate basis during that period. For comparison, in three out of four quarters in 2010, equipment spending grew at an annualized rate of 23 percent or faster.
Forward-looking measures of business spending, like orders for core capital goods, which are now growing at a 10.8 percent three-month annualized pace, suggest that any soft patch in Q3 spending may be short-lived.
Help from Inventories?
Another potential salve: inventories. The pace of inventory investment can occasionally be a major swing factor in the GDP report and the table is set for that to be the case here in the third quarter. Our current estimate for the annualized change in Q3 inventories is just $15 billion, a well-below trend number. But coming on the heels of a $27.9 billion drawdown in inventories in the second quarter, even that modest increase in Q3 is sufficient for inventories to add almost a full percentage point to headline GDP.
Inventories jumped 1.3 percent in July—the biggest one-month stockpiling event we have seen since 2011. As the saying goes, "one month does not a trend make," but we will be eyeing the incoming inventories numbers with renewed interest. On balance, businesses are still contributing to growth, even at this late stage of the cycle.
Sunset Market Commentary
Markets:
Global core bonds treaded water in an uneventful European trading session. Dynamics changed in US dealings. Core bonds started losing ground with US Treasuries underperforming German Bunds anticipating on Fed Chair Powell’s speech in Jackson Hole and reacting to strong US durable goods orders. The proxy for investments in the report rose a stronger-than-expected 0.9% M/M in July, following a similar increase in June. It further confirms the current strong momentum of the US economy. US Treasuries erased losses after Powell’s speech. The Fed chair confirmed the central bank’s gradual rate hike path, but stressed that currently there are no signs of an overheating US economy or from inflation rising rapidly above the Fed’s 2% goal. By pointing these out, he clearly signaled no intention to step up the tightening process at this stage in the cycle, causing a mildly dovish market reaction. The US yield curve bear flattens at the time of writing with yields 0.8 bps (2-yr) to 0.4 bps (30-yrà higher. The German yield curve bear steepens with yields 0.1 bp (2-yr) to 1.1 bp (30-yr) higher. 10-yr yield spread changes vs Germany are broadly unchanged with Italy underperforming (+3 bps).
After a brief dollar recovery yesterday, a sell-off in USD/CNY around noon marked the start of new losses for the greenback as market eagerly awaited Powell’s speech at the Fed symposium. Durable goods orders in the US were below expectations (-1.7% vs. -1.0% expected). More important core measures (non-defense, excl. aircrafts), however, were stronger than anticipated, yet with little impact on dollar trading. Instead, and while remarks from other Fed-members (Mester, Kaplan, Bullard …) triggered some intraday volatility, markets full attention went to Powell. In his speech, the Fed chair struck a rather balanced tone, saying he sees “good reasons to expect the strong economy to continue” while there “doesn’t seem to be elevated risk of overheating”. He sees “no clear signs of inflation accelerating above 2%”, confirming a gradual rate hiking path. His upbeat but nuanced message disappointed dollar bulls who were looking for clues for an increased normalization process. The dollar extended losses, with EUR/USD currently changing hands at 1.162, confirming the technical break (1.1510) earlier this week.
Sterling lost further ground vs. the euro today. While confident of reaching an agreement, brexit minister Raab provided the first details of UK’s no-deal contingency plan yesterday. However, markets were left unimpressed. Moreover, having the country to prepare for such a scenario rattled investors and the pound rather than actually having soothed them. EUR/GBP edged higher throughout the day, interrupted twice by sterling’s shy comeback attempts. However, without any good news (from the brexit or data front) to support the pound, the pair is currently testing important resistance levels at 0.9031/45. Cable gained as the dollar weakened, currently trading at 1.287.
News Headlines:
Italian media reported US President Donald Trump offered to buy Italian sovereign bonds next year. The offer was made when Italian prime minister Conte met US President Trump in the Oval Office last month. It remains unclear how Trump would impose this to the Fed, since the central bank operates independently.
China’s earlier made promise to open up its financial system is getting shape, despite rising trade tension with the US. The China Banking and Insurance Regulatory Commission announced that non-Chinese financial institutions will now be treated the same as local companies. Foreign stakes were until now capped at 20 or 25%.
Orders placed with US factories for business equipment grew with 1.4% in July (0.5% expected), which is a lot better than the upwardly revised 0.6% from June. Shipments of those goods, which is a proxy for business investment in US GDP, rose a stronger than expected 0.9% M/M, following an upwardly revised 0.9% M/M increase in June. This signals that solid growth into Q3 despite the ongoing trade dispute between the US and China.