Sample Category Title
Dollar weakens on Fed Powell, but markets misinterpret him
Dollar drops sharply as Fed chair Jerome Powell delivers his speech at the Jackson Hole Symposium. The markets seem to be responding to Powell's comment that "we have seen no clear sign of an acceleration above 2 percent" and "there does not seem to be an elevated risk of overheating". However, we believe that his messages need to be listened to more carefully.
In particular, Powell pointed to two common questions outside the Fed at the beginning part of the speech: They are
- With the unemployment rate well below estimates of its longer-term normal level, why isn't the FOMC tightening monetary policy more sharply to head off overheating and inflation?
- With no clear sign of an inflation problem, why is the FOMC tightening policy at all, at the risk of choking off job growth and continued expansion?
After presenting all the theories and case studies, Powell concluded that no acceleration in inflation above 2% is "good news". And such good news "results in part from the ongoing normalization process". And he added that " if the strong growth in income and jobs continues, further gradual increases in the target range for the federal funds rate will likely be appropriate."
He reiterated that "we are setting policy to do what monetary policy can do to support continued growth, a strong labor market, and inflation near 2 percent." And he didn't even mention yield curve as a condition like Bullard and Bostic.
To us, Powell's message is clear. The Fed is doing a great job with monetary policy normalization. The US economy is at this very good state partly because of the work of the Fed. And if job growth, income growth continue, Fed will continue with the rate hikes. It doesn't matter if the the POTUS is "thrilled" or not. For those with intellectual ability, read the theories and case studies. For those without, just enjoy the economy and shut up.
So, Powell is indeed reaffirming Fed's path and that shouldn't be dollar negative at all.
Fed Chair Powell’s Speech at Jackson Hole: Monetary Policy in a Changing Economy
Monetary Policy in a Changing Economy
Chairman Jerome H. Powell
At "Changing Market Structure and Implications for Monetary Policy," a symposium sponsored by the Federal Reserve Bank of Kansas City, Jackson Hole, Wyoming
Over the course of a long recovery, the U.S. economy has strengthened substantially. The unemployment rate has declined steadily for almost nine years and, at 3.9 percent, is now near a 20-year low. Most people who want jobs can find them. Inflation has moved up and is now near the Federal Open Market Committee's (FOMC) objective of 2 percent after running generally below that level for six years. With solid household and business confidence, healthy levels of job creation, rising incomes, and fiscal stimulus arriving, there is good reason to expect that this strong performance will continue.
As the economy has strengthened, the FOMC has gradually raised the federal funds rate from its crisis-era low near zero toward more normal levels. We are also allowing our securities holdings--assets acquired to support the economy during the deep recession and the long recovery--to decline gradually as these securities are paid off. I will explain today why the Committee's consensus view is that this gradual process of normalization remains appropriate. As always, there are risk factors abroad and at home that, in time, could demand a different policy response, but today I will step back from these.
In keeping with the spirit of this year's symposium topic--the changing structures of the economy--I would also note briefly that the U.S. economy faces a number of longer-term structural challenges that are mostly beyond the reach of monetary policy. For example, real wages, particularly for medium- and low-income workers, have grown quite slowly in recent decades. Economic mobility in the United States has declined and is now lower than in most other advanced economies.2Addressing the federal budget deficit, which has long been on an unsustainable path, becomes increasingly important as a larger share of the population retires. Finally, it is difficult to say when or whether the economy will break out of its low-productivity mode of the past decade or more, as it must if incomes are to rise meaningfully over time.
My FOMC colleagues and I believe that we can best support progress on these longer-term issues by pursuing the Federal Reserve's mandate and supporting continued economic growth, a strong labor market, and inflation near 2 percent. The topic of managing uncertainty in policymaking remains particularly salient. I will focus today on one of the many facets of uncertainty discussed at the 2003 symposium--uncertainty around the location of important macroeconomic variables such as the natural rate of unemployment. A good place to start is with two opposing questions that regularly arise in discussions of monetary policy both inside and outside the Fed:
1. With the unemployment rate well below estimates of its longer-term normal level, why isn't the FOMC tightening monetary policy more sharply to head off overheating and inflation?
2. With no clear sign of an inflation problem, why is the FOMC tightening policy at all, at the risk of choking off job growth and continued expansion?
These questions strike me as representing the two errors that the Committee is always seeking to avoid as expansions continue--moving too fast and needlessly shortening the expansion, versus moving too slowly and risking a destabilizing overheating. As I will discuss, the job of avoiding these errors is made challenging today because the economy has been changing in ways that are difficult to detect and measure in real time. I will first lay out a standard view of a handful of basic relationships that are thought to reflect key aspects of the underlying structure of the economy. I will then use that framework to explain the role that structural change plays in our current policy deliberations, focusing on how that role has been shaped by two historical episodes.
Conventional Views of Macroeconomic Structure
In conventional models of the economy, major economic quantities such as inflation, unemployment, and the growth rate of gross domestic product (GDP) fluctuate around values that are considered "normal," or "natural," or "desired." The FOMC has chosen a 2 percent inflation objective as one of these desired values. The other values are not directly observed, nor can they be chosen by anyone. Instead, these values result from myriad interactions throughout the economy. In the FOMC's quarterly Summary of Economic Projections (SEP), participants state their individual views on the longer-run normal values for the growth rate of GDP, the unemployment rate, and the federal funds rate.
These fundamental structural features of the economy are also known by more familiar names such as the "natural rate of unemployment" and "potential output growth." The longer-run federal funds rate minus long-run inflation is the "neutral real interest rate." At the Fed and elsewhere, analysts talk about these values so often that they have acquired shorthand names. For example, u* (pronounced "u star") is the natural rate of unemployment, r* ("r star") is the neutral real rate of interest, and Π* ("pi star") is the inflation objective. According to the conventional thinking, policymakers should navigate by these stars.3 In that sense, they are very much akin to celestial stars.
For example, the famous Taylor rule calls for setting the federal funds rate based on where inflation and unemployment stand in relation to the stars.4 If inflation is higher than Π*, raise the real federal funds rate relative to r*. The higher real interest rate will, through various channels, tend to moderate spending by businesses and households, which will reduce upward pressure on prices and wages as the economy cools off. In contrast, if the unemployment rate is above u*, lower the real federal funds rate relative to r*, which will stimulate spending and raise employment.
Navigating by the stars can sound straightforward. Guiding policy by the stars in practice, however, has been quite challenging of late because our best assessments of the location of the stars have been changing significantly.
Shifting Stars during Normalization
In December 2013, the FOMC began winding down the final crisis-era asset purchase program. Asset purchases declined to zero over 2014, and in December 2015, the FOMC began the gradual normalization of interest rates that continues to this day. As normalization has proceeded, FOMC participants and many other private- and public-sector analysts regularly adjusted their assessments of the stars (figure 1). Many projections of the natural rate of unemployment fell roughly 1 full percentage point, as did assessments of the neutral interest rate. Estimates of the potential growth rate of GDP slipped about 1/2 percentage point.
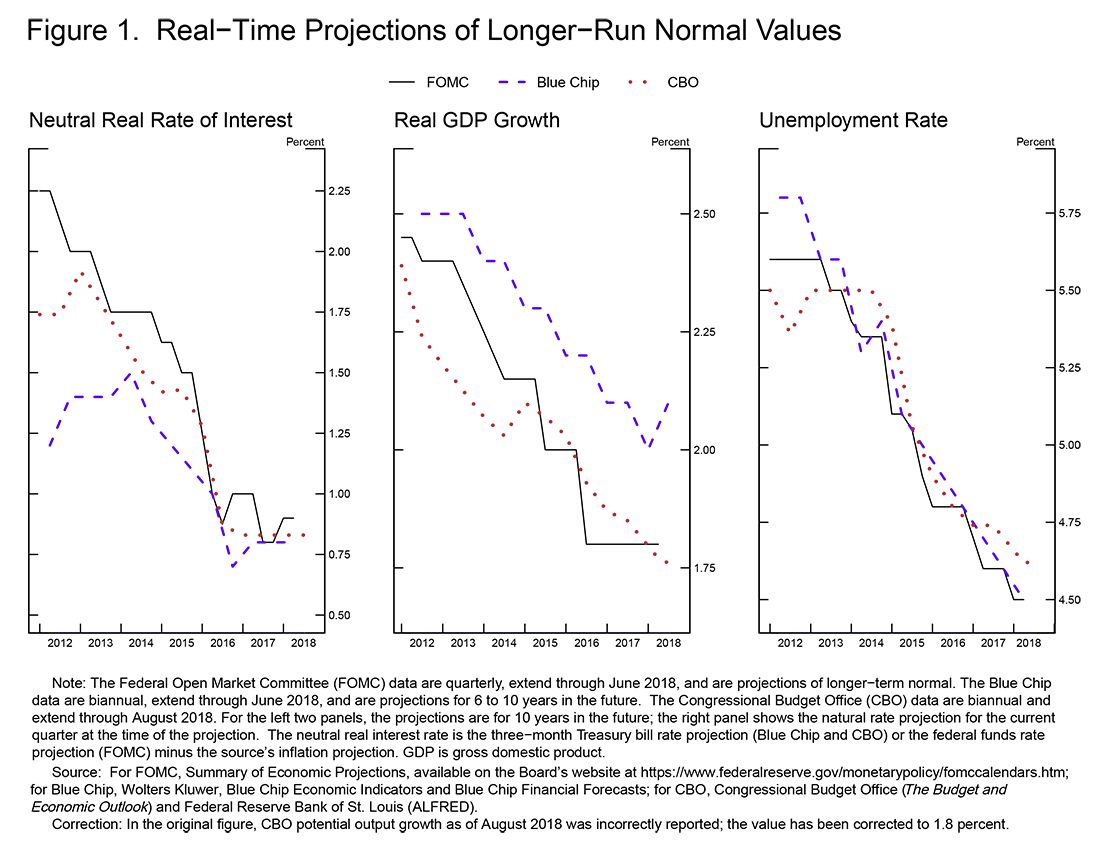
These changing assessments have big implications. For example, the 1 percentage point fall in the neutral interest rate implies that the federal funds rate was considerably closer to its longer-run normal and, hence, that policy was less accommodative than thought at the beginning of normalization. The 1 percentage point fall in the natural rate of unemployment implies at present that about 1.6 million more people would have jobs when unemployment is at its longer-run level. These shifts in the stars generally reflect analysts' attempts to square their estimates with arriving macroeconomic data. For example, as the unemployment rate fell toward, and then below, estimates of its natural rate, many expected inflation to move up. When inflation instead moved sideways, a reasonable inference was that the natural rate was lower than previously thought. Further, over this period, GDP growth was slower than one might have expected based on the rapid decline in unemployment and the well-known relationship between output and unemployment known as Okun's law. Put another way, labor productivity growth consistently disappointed, which raised the question of whether that shortfall was temporary‑‑perhaps due to headwinds from the crisis--or was part of a new normal.
These assessments of the values of the stars are imprecise and subject to further revision. To return to the nautical metaphor, the FOMC has been navigating between the shoals of overheating and premature tightening with only a hazy view of what seem to be shifting navigational guides. Our approach to this challenge has been shaped by two much discussed historical episodes--the Great Inflation of the 1960s and 1970s and the "new economy" period of the late 1990s.
Shifting Stars and the Great Inflation
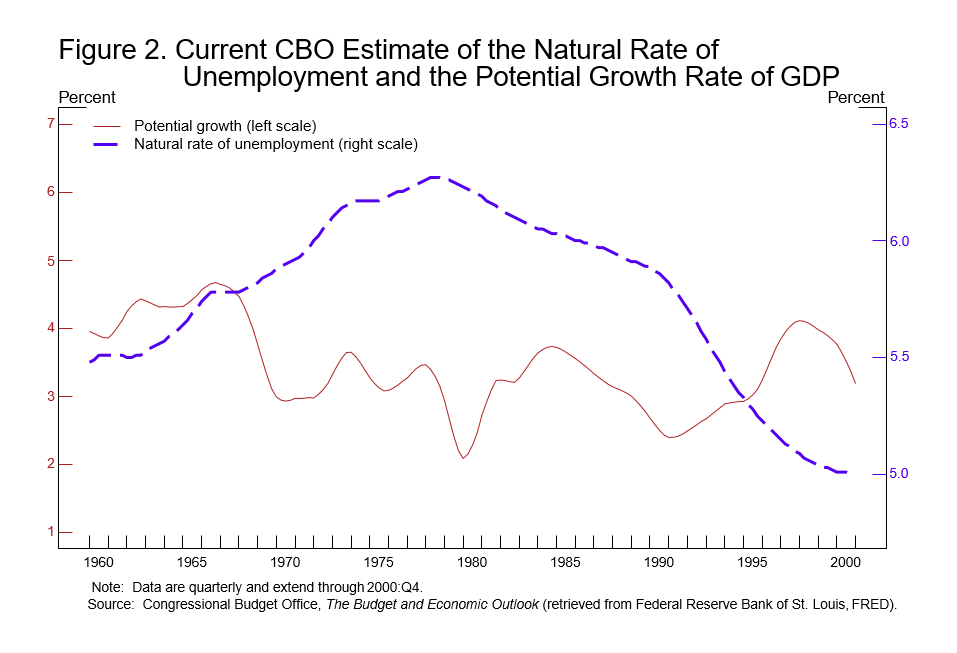
While the crisis and its aftermath have been extraordinary in many ways, the shifting of the stars is not one of them. Figure 2 illustrates the Congressional Budget Office's (CBO) current estimate of movements in the natural rate of unemployment and potential GDP growth from 1960 to 2000.5Viewed against the ups and downs observed over these four decades, the recent shifts in longer-run values are not all that dramatic. Of course, these CBO estimates benefit from many years of hindsight, whereas monetary policy must be based on assessments made in real time. The Great Inflation period vividly illustrates the difficulties this difference raises.
Around 1965, the United States entered a period of high and volatile inflation that ended with inflation in double digits in the early 1980s. Multiple factors, including monetary policy errors, contributed to the Great Inflation. Many researchers have concluded that a key mistake was that monetary policymakers placed too much emphasis on imprecise--and, as it turns out, overly optimistic--real-time estimates of the natural rate of unemployment.6
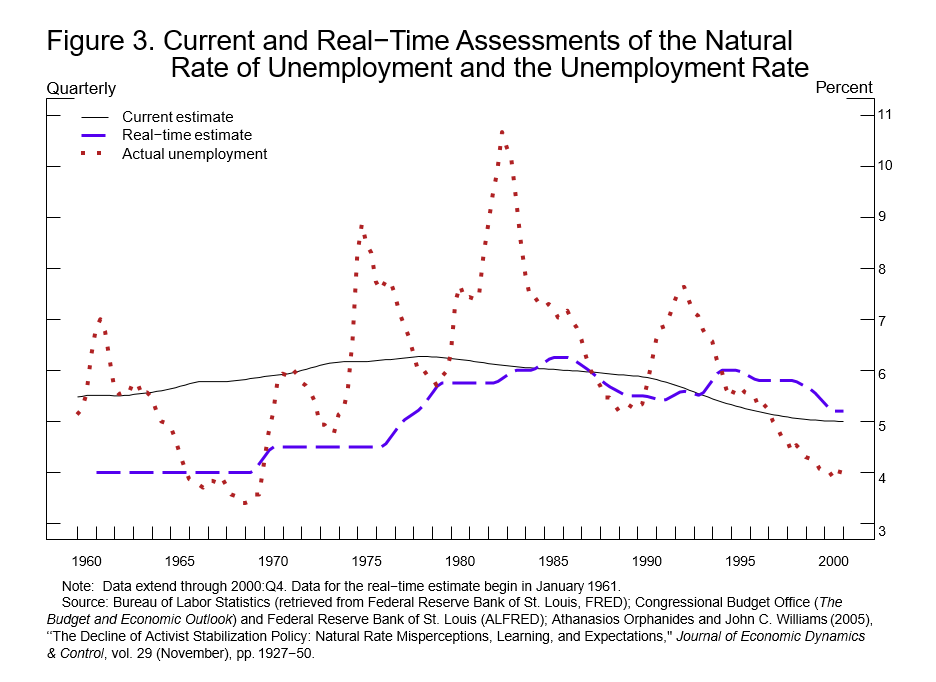
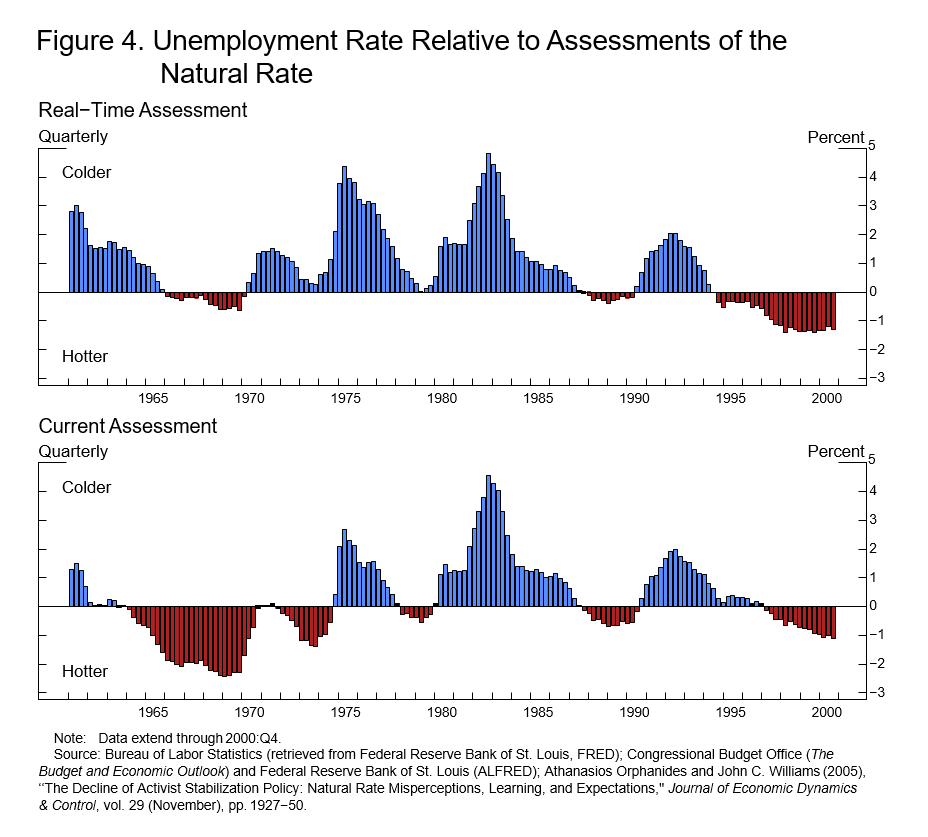
Figure 3 compares the CBO's current view of the natural rate of unemployment in that era with an estimate by Athanasios Orphanides and John Williams of the rate as policymakers perceived it in real time. From 1965 to the early 1980s, this real-time estimate of u* was well below where hindsight now places it. The unemployment rate over this period was generally well above the real-time natural rate, and contemporary documents reveal that policymakers were wary of pushing the unemployment rate even further above u* (figure 4, top panel).7 With the benefit of hindsight, we now think that, except for a few years in the mid-1970s, the labor market was tight and contributing to inflation's rise (figure 4, lower panel).
It is now clear that the FOMC had placed too much emphasis on its imprecise estimates of u* and too little emphasis on evidence of rising inflation expectations. The Great Inflation did, however, prompt an "expectations revolution" in macroeconomic thinking, with one overwhelmingly important lesson for monetary policymakers: Anchoring longer-term inflation expectations is a vital precondition for reaching all other monetary policy goals.8
When longer-term inflation expectations are anchored, unanticipated developments may push inflation up or down, but people expect that inflation will return fairly promptly to the desired value. This is the key insight at the heart of the widespread adoption of inflation targeting by central banks in the wake of the Great Inflation. Anchored expectations give a central bank greater flexibility to stabilize both unemployment and inflation. When a central bank acts to stimulate the economy to bring down unemployment, inflation might push above the bank's inflation target. With expectations anchored, people expect the central bank to pursue policies that bring inflation back down, and longer-term inflation expectations do not rise. Thus, policy can be a bit more accommodative than if policymakers had to offset a rise in longer-term expectations.
Shifting Stars and the "New Economy" of the Late 1990s
The second half of the 1990s confronted policymakers with a situation that was in some ways the flipside of that in the Great Inflation. In mid-1996, the unemployment rate was below the natural rate as perceived in real time, and many FOMC participants and others were forecasting growth above the economy's potential. Sentiment was building on the FOMC to raise the federal funds rate to head off the risk of rising inflation.9 But Chairman Greenspan had a hunch that the United States was experiencing the wonders of a "new economy" in which improved productivity growth would allow faster output growth and lower unemployment, without serious inflation risks. Greenspan argued that the FOMC should hold off on rate increases.
Over the next two years, thanks to his considerable fortitude, Greenspan prevailed, and the FOMC raised the federal funds rate only once from mid-1996 through late 1998.10 Starting in 1996, the economy boomed and the unemployment rate fell, but, contrary to conventional wisdom at the time, inflation fell.11
Once again, shifting stars help explain the performance of inflation, which many had seen as a puzzle. Whereas during the Great Inflation period the real-time natural rate of unemployment had been well below our current-day assessment, in the new-economy period, this relation was reversed (figure 3). The labor market looked to be tight and getting tighter in real time, but in retrospect, we estimate that there was slack in the labor market in 1996 and early 1997, and the labor market only tightened appreciably through 1998 (figure 4). Greenspan was also right that the potential growth rate had shifted up. With hindsight, we recognize today that higher potential growth could accommodate the very strong growth that actually materialized, let alone the moderate growth policymakers were forecasting.12
The FOMC thus avoided the Great-Inflation-era mistake of overemphasizing imprecise estimates of the stars. Under Chairman Greenspan's leadership, the Committee converged on a risk-management strategy that can be distilled into a simple request: Let's wait one more meeting; if there are clearer signs of inflation, we will commence tightening.13 Meeting after meeting, the Committee held off on rate increases while believing that signs of rising inflation would soon appear. And meeting after meeting, inflation gradually declined.
In retrospect, it may seem odd that it took great fortitude to defend "let's wait one more meeting," given that inflation was low and falling. Conventional wisdom at the time, however, still urged policymakers to respond preemptively to inflation risk--even when that risk was gleaned mainly from hazy, real-time assessments of the stars. With the experience in the new-economy period, policymakers were beginning to appreciate that, with inflation expectations much better anchored than before, there was a smaller risk that an inflation uptick under Greenspan's "wait and see" approach would become a significant problem.
Risk Management in the Face of Shifting Stars
Given what the economy has shown us over the past 15 years, the need for the sort of risk‑management approach that originated in the new-economy era is clearer than ever before. That approach continues to evolve based on experience and the growing literature on monetary policy and structural uncertainty.
Experience has revealed two realities about the relation between inflation and unemployment, and these bear directly on the two questions I started with. First, the stars are sometimes far from where we perceive them to be. In particular, we now know that the level of the unemployment rate relative to our real-time estimate of u* will sometimes be a misleading indicator of the state of the economy or of future inflation. Second, the reverse also seems to be true: Inflation may no longer be the first or best indicator of a tight labor market and rising pressures on resource utilization. Part of the reason inflation sends a weaker signal is undoubtedly the achievement of anchored inflation expectations and the related flattening of the Phillips curve.14 Whatever the cause, in the run-up to the past two recessions, destabilizing excesses appeared mainly in financial markets rather than in inflation. Thus, risk management suggests looking beyond inflation for signs of excesses.
These two realities present challenges. The literature on uncertainty reviewed at the 2003 symposium--and much refined since then--provides important advice for how policy should respond, although not yet, in my view, an explicit recipe or rule that a prudent central bank should follow.15 The literature on robust rules, such as so-called difference rules, for example, supports the idea of putting less emphasis on the level of unemployment relative to u*.16 The FOMC's practice of looking at a broad range of indicators when assessing the state of the labor market has explicitly been part of the FOMC's Statement on Longer-Run Goals and Monetary Policy Strategy since its inception in 2012.17 We have greatly expanded the scope of our surveillance for signs of labor market tightness and of destabilizing excesses more generally.
The risks from misperceiving the stars also now play a prominent role in the FOMC's deliberations. A paper by Federal Reserve Board staff is a recent example of a range of research that helps FOMC participants visualize and manage these risks.18 The research reports simulations of the economic outcomes that might result under various policy rules and policymaker misperceptions about the economy. One general finding is that no single, simple approach to monetary policy is likely to be appropriate across a broad range of plausible scenarios.19 More concretely, simulations like these inform our risk management by assessing the likelihood that misperception would lead to adverse outcomes, such as inflation falling below zero or rising above 5 percent.
Finally, the literature on structural uncertainty suggests some broader insights. This literature started with the work of William Brainard and the well-known Brainard principle, which recommends that when you are uncertain about the effects of your actions, you should move conservatively.20 In other words, when unsure of the potency of a medicine, start with a somewhat smaller dose. As Brainard made clear, this is not a universal truth, and recent research highlights two particularly important cases in which doing too little comes with higher costs than doing too much. The first case is when attempting to avoid severely adverse events such as a financial crisis or an extended period with interest rates at the effective lower bound.21 In such situations, the famous words "We will do whatever it takes" will likely be more effective than "We will take cautious steps toward doing whatever it takes." The second case is when inflation expectations threaten to become unanchored. If expectations were to begin to drift, the reality or expectation of a weak initial response could exacerbate the problem.22 I am confident that the FOMC would resolutely "do whatever it takes" should inflation expectations drift materially up or down or should crisis again threaten. In addition, a decade of regulatory reforms and private-sector advances have greatly increased the strength and resilience of the financial system, with the aim of reducing the likelihood that the inevitable financial shocks will become crises.
The Current Situation
Let me conclude by returning to the matter of navigating between the two risks I identified--moving too fast and needlessly shortening the expansion, versus moving too slowly and risking a destabilizing overheating. Readers of the minutes of FOMC meetings and other communications will know that our discussions focus keenly on the relative salience of these risks. The diversity of views on the FOMC is one of the great virtues of our system. Despite differing views on these questions and others, we have a long institutional tradition of finding common ground in coalescing around a policy stance.
I see the current path of gradually raising interest rates as the FOMC's approach to taking seriously both of these risks. While the unemployment rate is below the Committee's estimate of the longer-run natural rate, estimates of this rate are quite uncertain. The same is true of estimates of the neutral interest rate. We therefore refer to many indicators when judging the degree of slack in the economy or the degree of accommodation in the current policy stance. We are also aware that, over time, inflation has become much less responsive to changes in resource utilization.
While inflation has recently moved up near 2 percent, we have seen no clear sign of an acceleration above 2 percent, and there does not seem to be an elevated risk of overheating. This is good news, and we believe that this good news results in part from the ongoing normalization process, which has moved the stance of policy gradually closer to the FOMC's rough assessment of neutral as the expansion has continued. As the most recent FOMC statement indicates, if the strong growth in income and jobs continues, further gradual increases in the target range for the federal funds rate will likely be appropriate.
The economy is strong. Inflation is near our 2 percent objective, and most people who want a job are finding one. My colleagues and I are carefully monitoring incoming data, and we are setting policy to do what monetary policy can do to support continued growth, a strong labor market, and inflation near 2 percent.
References
Bernanke, Ben S. (2007). "Inflation Expectations and Inflation Forecasting," speech delivered at the Monetary Economics Workshop of the National Bureau of Economic Research Summer Institute, Cambridge, Mass., July 10.
Blinder, Alan S., and Ricardo Reis (2005). "Understanding the Greenspan Standard (PDF)," paper presented at "The Greenspan Era: Lessons for the Future," a symposium sponsored by the Federal Reserve Bank of Kansas City, held in Jackson Hole, Wyo., August 25-27.
Blinder, Alan S., and Janet L. Yellen (2001). The Fabulous Decade: Macroeconomic Lessons from the 1990s. New York: Century Foundation Press.
Board of Governors of the Federal Reserve System (various years). Bluebook (Monetary Policy Alternatives). Washington: Board of Governors, June 1996-December 1998, https://www.federalreserve.gov/monetarypolicy/fomc_historical_year.htm.
-------- (1996). "Monetary Policy Report to the Congress (PDF)," Federal Reserve Bulletin, vol. 82 (August), pp.701-16.
-------- (1997). "Monetary Policy Report to the Congress (PDF)," Federal Reserve Bulletin, vol. 83 (August), pp. 641-58.
-------- (1998). "Monetary Policy Report to the Congress (PDF)," Federal Reserve Bulletin, vol. 84 (August), pp. 585-603.
-------- (2018). "Federal Open Market Committee Reaffirms Its 'Statement on Longer-Run Goals and Monetary Policy Strategy,'" press release, January 31.
Brainard, William C. (1967). "Uncertainty and the Effectiveness of Policy," American Economic Review, vol. 57 (May, Papers and Proceedings), pp. 411-25.
Burns, Arthur F. (1979). "The Anguish of Central Banking (PDF)," speech delivered at the 16th annual Per Jacobssen Lecture, Belgrade, September 30.
Chetty, Raj, David Grusky, Maximilian Hell, Nathaniel Hendren, Robert Manduca, and Jimmy Narang (2017). "The Fading American Dream: Trend in Absolute Income Mobility since 1940," Science, vol. 356 (April), pp. 398-406.
Chetty, Raj, Nathaniel Hendren, Patrick Kline, and Emmanuel Saez (2014). "Where Is the Land of Opportunity? The Geography of Intergenerational Mobility in the United States," Quarterly Journal of Economics, vol. 129 (November), pp. 1553‑623.
Erceg, Christopher, James Hebden, Michael Kiley, David López-Salido, and Robert Tetlow (2018). "Some Implications of Uncertainty and Misperception for Monetary Policy (PDF)," Finance and Economics Discussion Series 2018-059. Washington: Board of Governors of the Federal Reserve System, August, https://dx.doi.org/10.17016/FEDS.2018.059.
Feldstein, Martin (2003). "Overview (PDF)," panel remarks delivered at "Monetary Policy and Uncertainty: Adapting to a Changing Economy," a symposium sponsored by the Federal Reserve Bank of Kansas City, held in Jackson Hole, Wyo., August 28-30.
Fischer, Stanley (2003). "Overview (PDF)," panel remarks delivered at "Monetary Policy and Uncertainty: Adapting to a Changing Economy," a symposium sponsored by the Federal Reserve Bank of Kansas City, held in Jackson Hole, Wyo., August 28-30.
Greenspan, Alan (2003). "Opening Remarks (PDF)," speech delivered at "Monetary Policy and Uncertainty: Adapting to a Changing Economy," a symposium sponsored by the Federal Reserve Bank of Kansas City, held in Jackson Hole, Wyo., August 28-30.
Kiley, Michael T. (2015). "Low Inflation in the United States: A Summary of Recent Research," FEDS Notes. Washington: Board of Governors of the Federal Reserve System, November 23.
Meyer, Laurence H. (1996). "Monetary Policy Objectives and Strategy," speech delivered at the 38th Annual Meeting of the National Association of Business Economists, Boston, September 8.
-------- (2004). A Term at the Fed: An Insider's View. New York: Harper Business.
Orphanides, Athanasios, and John C. Williams (2013). "Monetary Policy Mistakes and the Evolution of Inflation Expectations," in Michael D. Bordo and Athanasios Orphanides, eds., The Great Inflation: The Rebirth of Modern Central Banking. Chicago: University of Chicago Press, pp. 255-88.
Reifschneider, David, and John C. Williams (2000). "Three Lessons for Monetary Policy in a Low-inflation Era," Journal of Money, Credit and Banking, vol. 32 (February), pp. 936‑66.
Romer, Christina D., and David H. Romer (2002). "The Evolution of Economic Understanding and Postwar Stabilization Policy (PDF)," paper presented at "Rethinking Stabilization Policy," a symposium sponsored by the Federal Reserve Bank of Kansas City, held in Jackson Hole, Wyo., August 29-31.
Sargent, Thomas J. (2002). "Commentary: The Evolution of Economic Understanding and Postwar Stabilization Policy (PDF)," paper presented at "Rethinking Stabilization Policy," a symposium sponsored by the Federal Reserve Bank of Kansas City, held in Jackson Hole, Wyo., August 29-31.
Söderström, Ulf (2002). "Monetary Policy with Uncertain Parameters," Scandinavian Journal of Economics, vol. 104 (March), pp. 125-45.
Taylor, John B. (1993). "Discretion versus Policy Rules in Practice," Carnegie-Rochester Series on Public Policy, vol. 39 (December), pp. 195-214.
Taylor, John B., and John C. Williams (2011). "Simple and Robust Rules for Monetary Policy," in Benjamin M. Friedman and Michael Woodford, eds., Handbook of Monetary Economics, vol. 3B. Amsterdam: North-Holland, pp. 829-59.
Walsh, Carl E. (2003). "Implications of a Changing Economic Structure for the Strategy of Monetary Policy (PDF)," paper presented at "Monetary Policy and Uncertainty: Adapting to a Changing Economy," a symposium sponsored by the Federal Reserve Bank of Kansas City, held in Jackson Hole, Wyo., August 28-30.
Wilkins, Carolyn A. (2017). "Embracing Uncertainty in the Conduct of Monetary Policy (PDF)," speech delivered to the Money Marketeers of New York University, New York, November 15.
Yellen, Janet L. (2003). "Overview (PDF)," panel remarks delivered at "Monetary Policy and Uncertainty: Adapting to a Changing Economy," a symposium sponsored by the Federal Reserve Bank of Kansas City, held in Jackson Hole, Wyo., August 28-30.
-------- (2015). "Inflation Dynamics and Monetary Policy," speech delivered at the Philip Gamble Memorial Lecture, University of Massachusetts, Amherst, September 24.
1. See Greenspan (2003), p. 1. Return to text
2. See Chetty and others (2014) and Chetty and others (2017). Return to text
3. In this talk, I will sidestep the issue of navigating by short-run versus long-run versions of the stars. The challenges that I will highlight are, in my view, made more difficult, and the case for a careful risk-management approach made stronger, by the need to consider both short-run and long-run versions of the stars. Return to text
4. The original Taylor rule (Taylor, 1993) uses output relative to potential in place of unemployment relative to its natural rate. Both forms are now known as Taylor rules. Return to text
5. I am using the CBO's estimates to reflect a conventional view over that time span since the SEP longer-run values have only been reported since 2009. Return to text
6. See, for example, Burns (1979), Orphanides and Williams (2013), and the sources therein. Romer and Romer (2002) and Sargent (2002) debate additional factors that may have played a role. There is no dispute, however, that policymakers did misperceive the natural unemployment rate, and Orphanides and Williams show that misperception of the natural rate of unemployment alone would have been sufficient on its own to generate outcomes like the Great Inflation. Return to text
7. See the discussion in note 6. Return to text
8. Many central bankers have made this case; see, for example, Bernanke (2007) and Yellen (2015). Return to text
9. This account is drawn from several accounts of the period: Blinder and Yellen (2001), Blinder and Reis (2005), Meyer (1996), Meyer (2004), and the Federal Reserve's Bluebook documents from June 1996 through December 1998 (Board of Governors, various years). Return to text
10. In the second half of 1998, a Russian debt default and other ongoing financial instability in Asia intervened, and the FOMC rapidly lowered the federal funds rate 3/4 percentage point. Return to text
11. By current data, over the eight quarters starting in 1996:Q3, core PCE (personal consumption expenditures) inflation fell from 1.8 percent to 1.3 percent. Return to text
12. During this period, FOMC participants submitted six-quarter forecasts each July as part of the Fed's semiannual Monetary Policy Report to the Congress. Each July from 1996 through 1998, the FOMC forecast growth very close to or above the real-time estimates of potential growth. The forecast growth is well below current estimates of potential output growth. For the forecasts, see Board of Governors (1996, 1997, 1998). Return to text
13. For a more complete discussion of the greatly distilled account here, see the sources in note 9. Return to text
14. Kiley (2015) reviews the literature on this point. Return to text
15. The literature was reviewed by Walsh at the 2003 symposium; see Walsh (2003). Also from the same symposium, see, for example, Greenspan (2003), Feldstein (2003), Fischer (2003), and Yellen (2003). For a more recent perspective, see Wilkins (2017). Return to text
16. See Taylor and Williams (2011). Note that the robust rules literature does not suggest ignoring the general notion of labor market tightness or of resource utilization more generally. Indeed, robust rules often reflect tightness through the change in the unemployment rate. Instead, the issue is about how best to take account of labor market tightness when the best estimates of u* are very imprecise. See also Erceg and others (2018). Return to text
17. See Board of Governors (2018). Return to text
18. See Erceg and others (2018). Return to text
19. The paper illustrates that some standard intuitions do not hold up in all circumstances. When following a standard Taylor rule and facing a very flat Phillips curve, for example, it is not always good advice to lower the weight on the gap between unemployment and u* and to raise the weight on inflation in making policy. See Erceg and others (2018). Return to text
20. See Brainard (1967). Return to text
21. See Reifschneider and Williams (2000). Return to text
22. See Söderström (2002). Return to text
EURJPY: Bullish, Extends Recovery Higher
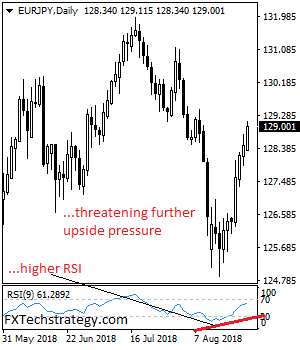
EURJPY - The pair looks to recover further higher following a hold on its recent gains during Friday trading today. Support comes in at the 128.50 level where a break if seen will aim at the 128.00 level. A cut through here will turn focus to the 127.50 level and possibly lower towards the 127.00 level. On the upside, resistance resides at the 129.50 level. Further out, we envisage a possible move towards the 130.00 level. Further out, resistance resides at the 130.50 level with a turn above here aiming at the 131.00 level. On the whole, EURJPY continues to face further upside threats.
EUR/USD Mid-Day Outlook
Daily Pivots: (S1) 1.1514; (P) 1.1558; (R1) 1.1585; More.....
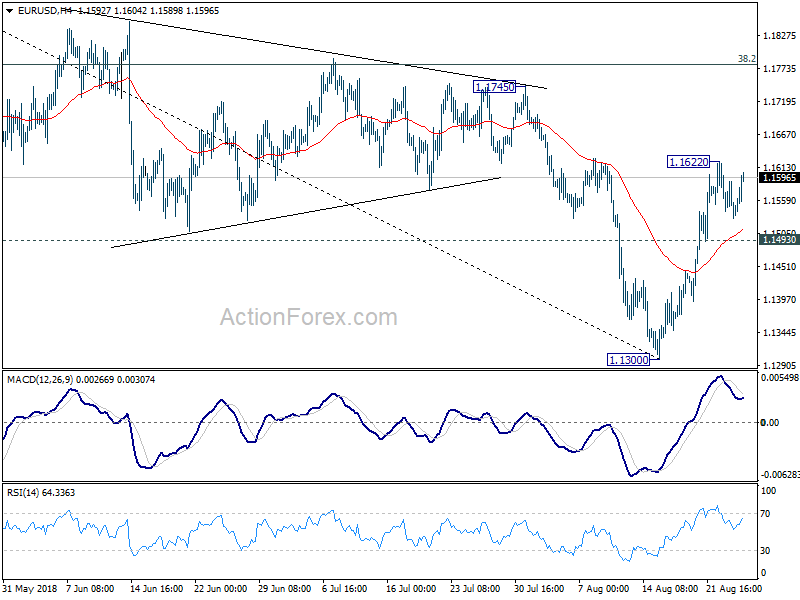
EUR/USD recovers mildly but is bounded in range below 1.1622. Intraday bias stays neutral. With 1.1493 minor support intact, further rise could be seen. But rebound from 1.1300 is seen as a correction. Hence, we'd expect strong resistance from 1.1745 to limit upside to bring larger down trend resumption. On the downside, break of 1.1493 minor support will suggest that the rebound is completed. Intraday bias would be turned back to the downside for retesting 1.1300 low.
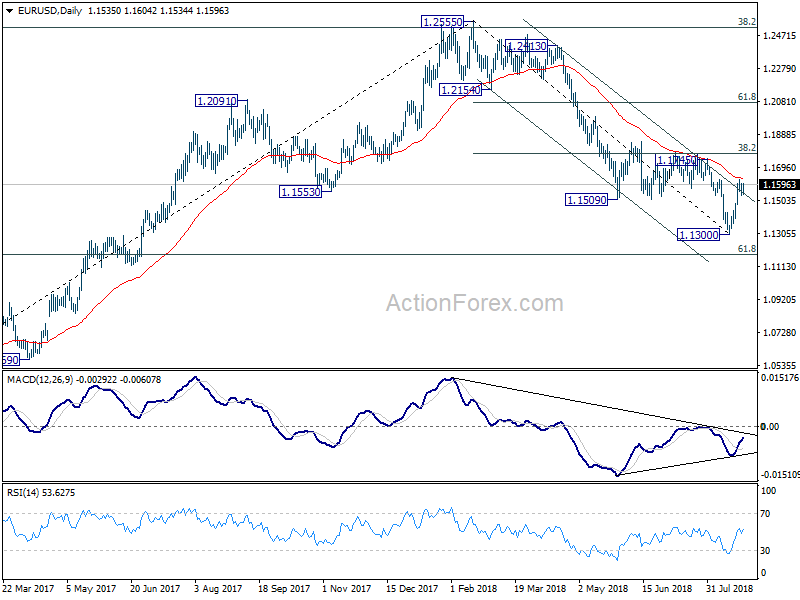
In the bigger picture, the down trend from 1.2555 medium term is in progress for 61.8% retracement of 1.0339 to 1.2555 at 1.1186. Note again that EUR/USD was rejected by 38.2% retracement of 1.6039 (2008 high) to 1.0339 (2017 low) at 1.2516. That carries some long term bearish implications. Sustained break of 1.1186 could pave the way back to retest 1.0339 low. For now, outlook will remain bearish as long as 38.2% retracement of 1.2555 to 1.1300 at 1.1779 holds, even in case of strong rebound.
USD/CHF Mid-Day Outlook
Daily Pivots: (S1) 0.9832; (P) 0.9849; (R1) 0.9877; More....
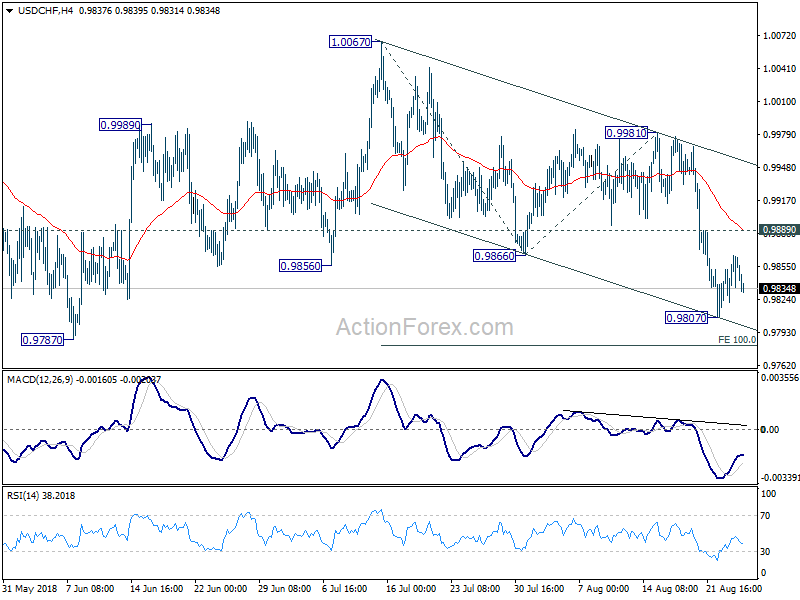
Intraday bias in USD/CHF stays neutral for consolidation above 0.9807 temporary low. Also, further fall is expected as long as 0.9889 minor resistance holds. On the downside, break of 0.9807 will target 100% projection of 1.0067 to 0.9866 from 0.9981 at 0.9780 and possibly below. But fall from 1.0067 is seen as the third leg of the consolidation pattern from 1.0056. Hence, we'd expect strong support from 38.2% retracement of 0.9186 to 1.0056 at 0.9724 to bring rebound. On the upside, above 0.9889 will turn bias to the upside for 0.9981 resistance first. Break will bring retest of 1.0067 high.
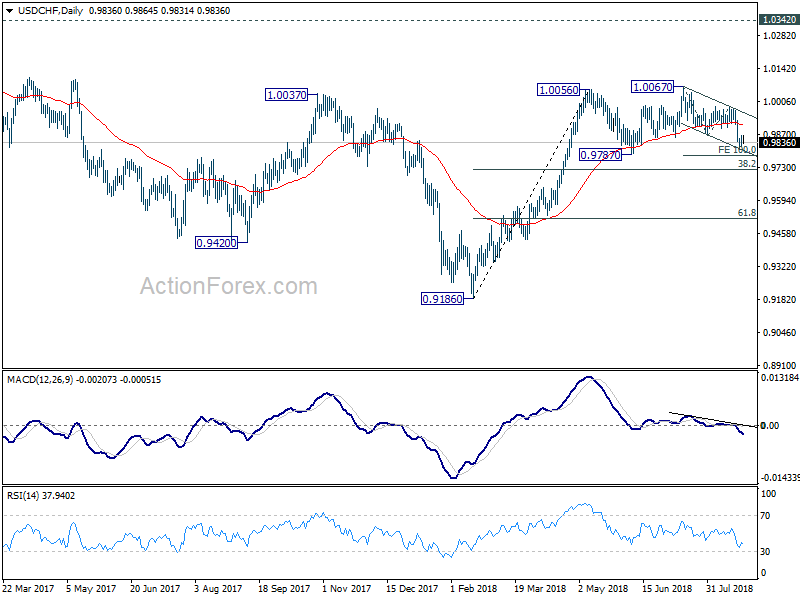
In the bigger picture, current development suggests that the consolidation pattern from 1.0056 is extending. As long as 38.2% retracement of 0.9186 to 1.0056 at 0.9724 holds, we'd expect rise from 0.9186 to resume at a later stage to retest 1.0342 key resistance (2016 high). However, sustained break of 0.9724 fibonacci level will bring deeper fall, as another declining leg in the long term range pattern.
USD/JPY Mid-Day Outlook
Daily Pivots: (S1) 110.77; (P) 111.04; (R1) 111.57; More...
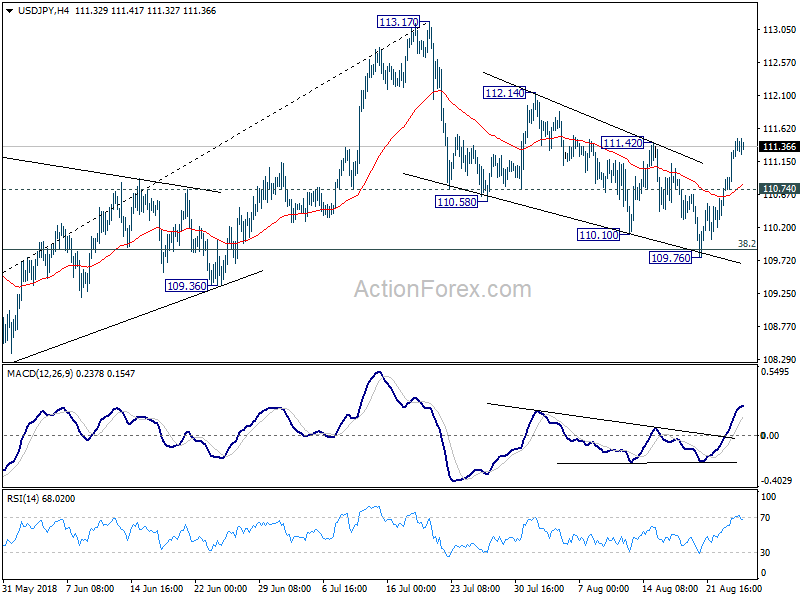
Intraday bias in USD/JPY remains on the upside for 112.14 resistance. As noted before, the correction from 113.17 should have completed at 109.76 already. Break of 112.14 will bring retest of 113.17 high. On the downside, below 110.74 minor support will turn bias back to the downside for retesting 109.76 again. But after all, we'd continue to expect strong support around 38.2% retracement of 104.62 to 113.17 at 109.90 to bring rebound.
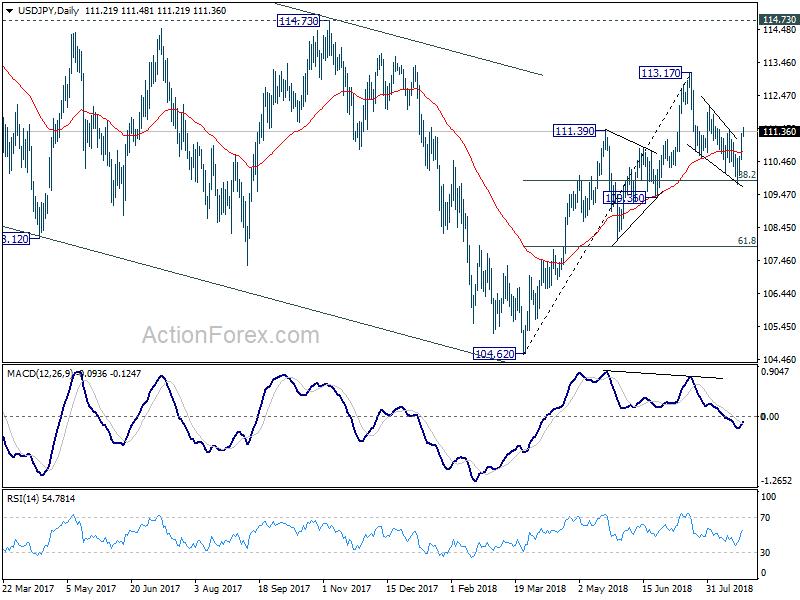
In the bigger picture, corrective fall from 118.65 (2016 high) should have completed with three waves down to 104.62. Decisive break of 114.73 resistance will likely resume whole rally from 98.97 (2016 low) to 100% projection of 98.97 to 118.65 from 104.62 at 124.30, which is reasonably close to 125.85 (2015 high). This will stay as the preferred case as long as 109.36 support holds. However, decisive break of 109.36 will mix up the outlook again. And deeper fall should be seen back to 61.8% retracement of 104.62 to 113.17 at 107.88 and below.
EURCAD Hits 16-Day High, Continues to Look Bearish in the Medium-Term
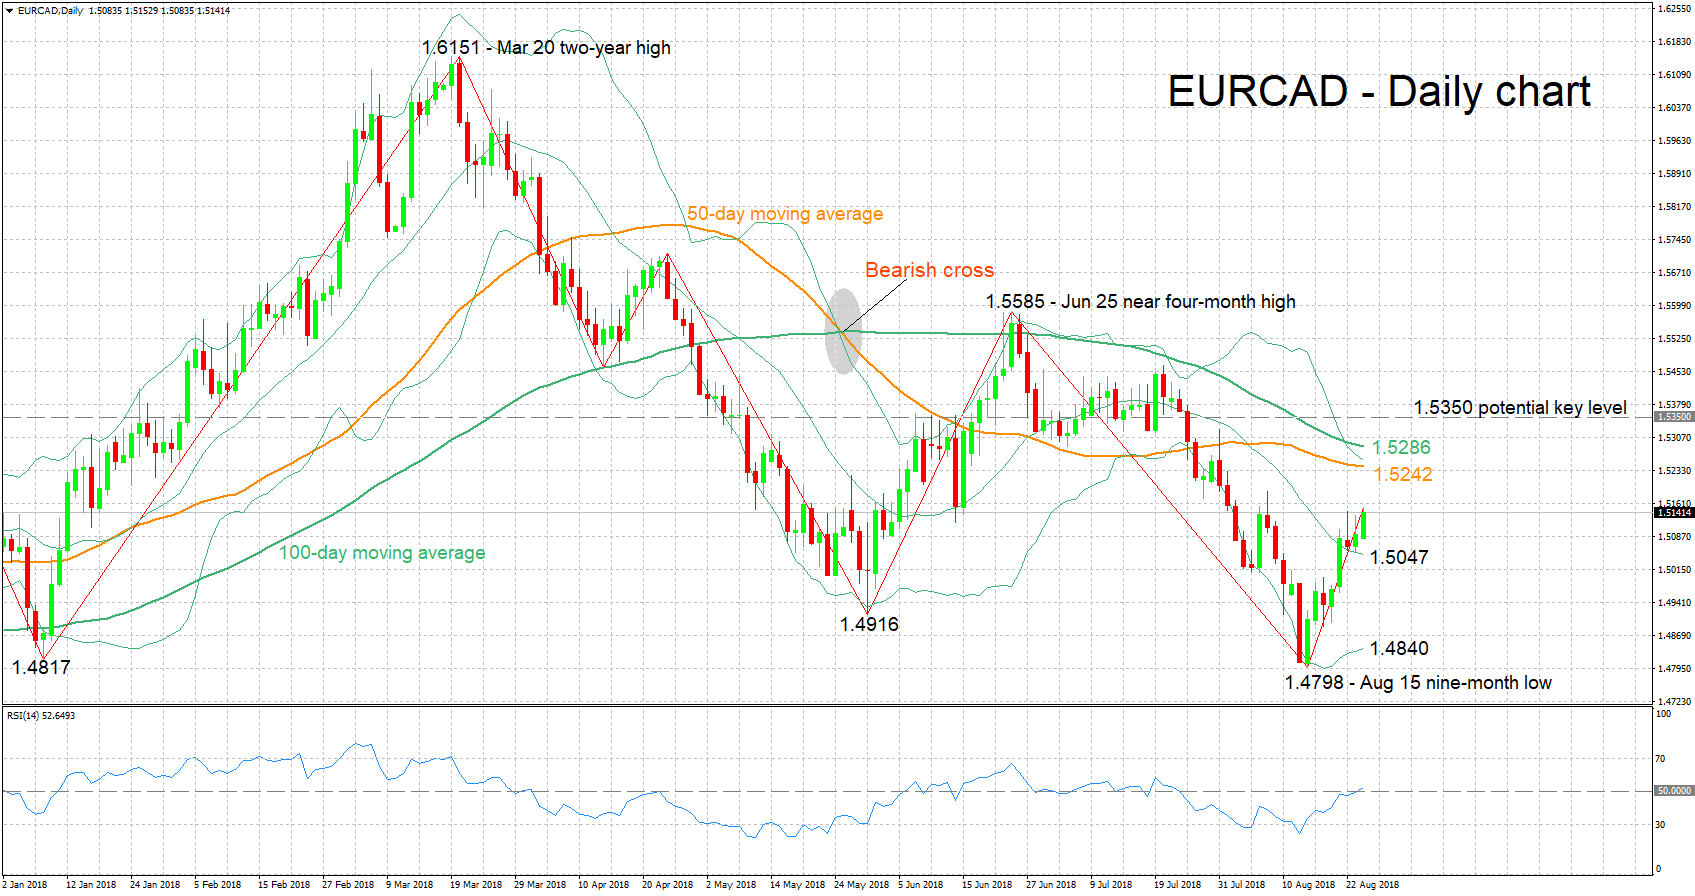
EURCAD has risen by roughly 350 pips after touching a nine-month low of 1.4798 in mid-August. Earlier on Friday, it posted a 16-day high of 1.5153, while it is currently trading not far below this peak.
The RSI is climbing in support of a bullish short-term picture for the pair.
Stronger gains may meet resistance from (and around) the zone between 1.5242 and 1.5286, which includes the 50- and 100-day moving average lines, as well as the upper Bollinger band. Further above, the region around 1.5350, which was congested between late June and late July, may be of significance, acting as an additional barrier to the upside.
On the downside, support could occur around the middle Bollinger line – a 20-day moving average line – at 1.5047. Steeper losses would increasingly bring into scope a previous bottom at 1.4916 and subsequently the lower Bollinger band at 1.4840.
Despite the recent gains, the medium-term picture remains predominantly bearish: the pair is in a downtrend, recording lower high and lower lows, while price action is taking place below the 50- and 100-day MAs lines. A move above the MAs – notice that the price is not far below them – would start tilting the outlook to a more bullish one.
Overall, the short-term outlook is bullish at the moment, while the medium-term one continues to appear mostly bearish.
GBP/USD Mid-Day Outlook
Daily Pivots: (S1) 1.2773; (P) 1.2846; (R1) 1.2889; More...
GBP/USD recovers after dipping to 1.2798. But we're still favoring the case that corrective rebound from 1.2661 has completed at 1.2935 already. Further decline should be seen to retest 1.2661 low first. Break will resume larger down trend from 1.4376. On the upside, in case of another rebound, we'd still expect upside to be limited by 1.2956 support turned resistance. However, decisive break of 1.2956 will turn focus to 1.3212 key resistance instead.
In the bigger picture, whole medium term rebound from 1.1946 (2016 low) should have completed at 1.4376 already, after rejection from 55 month EMA (now at 1.4091). Current downside acceleration argues that it's possibly resuming long term down trend. In any case, outlook will stay bearish as long as 1.3212 resistance holds. Retest of 1.1946 should be seen next.
Mixed Fedspeaks and Durables, Dollar Recovery Lost Steam as Powell Eyed
Dollar trades broadly lower today, except versus Yen as it's recovery quickly lost steam. Comments from Fed officials are mixed while markets are awaiting Fed chair Jerome Powell's speech at Jackson Hole symposium at 1400GMT. Durable goods orders report is mixed too, with weak headline numbers, but solid details. It's certainly not giving any help to the greenback.
On the other hand, Australian Dollar is staying as the strongest today and picks up momentum slightly. Markets responded to generally welcomed Scott Morrison as new Prime Minister, and he ruled out calling a general election in near term. Fitch rating agency also said the leadership change will not have any impact of Australia's rating. New Zealand Dollar follows as the second strongest.
In other market, European indices are generally firm with FTSE up 0.21%, DAX Up 0.20% and CAC up 0.38% at the time of writing. Earlier today, Nikkei closed up 0.85% at 22601.77 while China SSE also rose 0.18%. But Hong Kong HSI and Singapore Strait Times ended in red, down -0.43% and -1.14% respectively. As Dollar softens, Gold is back above 1190.
St. Louis Fed Bullard would stand pat on rate if it's just him
St. Louis Fed President James Bullard said in a CNBC interview that he doesn't see much inflation in the economy. And, he went further saying that it's not a situation where Fed has to be "pre-emptive". And "if it was just me, I'd stand pat where we are and I'd try to react to data as it comes in."
Regarding growth, he said "it's going to be a good year, and part of that is fiscal stimulus". However, the economy is "going to slow in 2019 and 2020" and "that's the standard forecast that's out there".
Separately, Bullard told Bloomberg TV that Fed should not do anything that knowingly invert the yield curve. This sort of echoes comments of Atlanta Fed President Raphael Bostic.
Fed Mester upgrades growth forecasts, supports gradual policy path
Cleveland Fed President Loretta Mester said there's more momentum in the economy then she anticipated. And, she's been "upping" her forecasts, now expecting 2.75-3.00% for the year, and "probably close to 3%. She said that "the fiscal policy – the stimulus and the tax cuts – has been a positive for the economy in terms of demand growth and so that's one of the factors."
Mester also support the gradual path of monetary accommodation removal. But for now, it's hard to judge whether the fed funds rate needs to go above neutral rate. But her neutral rate, at 3%, is higher than her fellows.
US durable goods orders show jump in investments despite trade war
US headline durable goods orders dropped -1.7% in July versus expectation of 1.0% rise. Ex-transport goods rose 0.2% versus expectation of 0.3%. However, it should be noted that non-military capital-goods orders excluding aircraft jumped 1.4%, showing solid increase in business investments. Shipments rose 0.9% which should provide solid contribution to Q3 GDP.
The overall set of data argues that the impact from escalation of US-China trade war didn't have material impact of business investments yet, despite the cries for lower confidence. However, August and September figures will provide a more realistic picture as larger batch of tariffs came into effect.
Italy warns hardline on migrants while European commission said threats don't work
On the issue of disembarkation of 150 migrants being held on a coast guard ship in Sicily, Italian Deputy Prime Minister Lugi Di Maio insisted that other EU countries should share the burden. He threatened on television that "the soft line does not work, the hard line will be to withhold funds if they don't listen to us."
On the other hand, European Commission spokesman Alexander Winterstein told a news conference that "unconstructive comments, let alone threats, are not helpful and will not get us any closer to a solution. The European Union is a community of rules and it operates on the basis of rules, not threats,"
Envoys from a dozen members states meet in Brussels to discuss disembarkation from the guard ship Diciotti.
RBNZ Orr: New Zealand fundamentals strong but biggest challenge is to get inflation to rise
RBNZ Governor Adrian Orr said in a Bloomberg interview at Jackson Hole that the economy is well supported with a "very supportive exchange rate" and "strong terms of trade". The fundamentals for New Zealand are strong with "stable monetary policy", "low inflation", "very good fiscal account", "accommodative exchange rate" and it's a "very positive story". But the country has come a period of strong population growth which is easing, therefore, the focus is shifted from "consumption" to "earning.
The "biggest challenge" is to "get inflation to rise" as it's below mid-point of 1-3% target for a couple of years. To do that, Orr reiterated that RBNZ will hold interest rate low for a long period of time and it's "in no rush to raise interest rate". And, Orr also emphasized that "we don't rule out a cut" if necessary.
According to Orr, trade war will have to be very real and vicious before having an impact on New Zealand significantly. And, trade income will have to fall quite considerably before affecting the country's term of trade.
GBP/USD Mid-Day Outlook
Daily Pivots: (S1) 1.2773; (P) 1.2846; (R1) 1.2889; More...
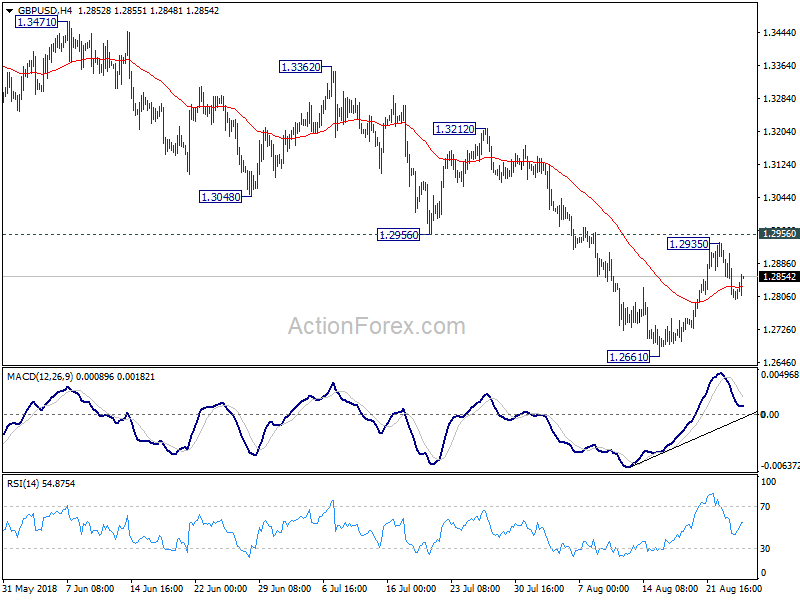
GBP/USD recovers after dipping to 1.2798. But we're still favoring the case that corrective rebound from 1.2661 has completed at 1.2935 already. Further decline should be seen to retest 1.2661 low first. Break will resume larger down trend from 1.4376. On the upside, in case of another rebound, we'd still expect upside to be limited by 1.2956 support turned resistance. However, decisive break of 1.2956 will turn focus to 1.3212 key resistance instead.
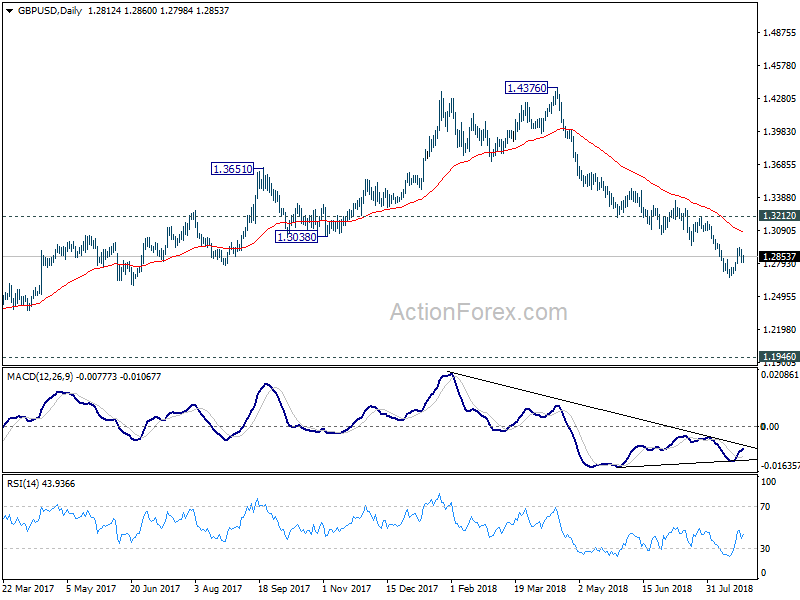
In the bigger picture, whole medium term rebound from 1.1946 (2016 low) should have completed at 1.4376 already, after rejection from 55 month EMA (now at 1.4091). Current downside acceleration argues that it's possibly resuming long term down trend. In any case, outlook will stay bearish as long as 1.3212 resistance holds. Retest of 1.1946 should be seen next.
Economic Indicators Update
| GMT | Ccy | Events | Actual | Forecast | Previous | Revised |
|---|---|---|---|---|---|---|
| 22:45 | NZD | Trade Balance Jul | -143M | -400M | -113M | -288M |
| 23:30 | JPY | National CPI Core Y/Y Jul | 0.80% | 0.90% | 0.80% | |
| 06:00 | EUR | German GDP Q/Q Q2 F | 0.50% | 0.50% | 0.50% | |
| 08:30 | GBP | BBA Loans for House Purchase Jul | 39.6K | 40.6K | 40.5K | |
| 12:30 | USD | Durable Goods Orders Jul P | -1.70% | 1.00% | 0.80% | |
| 12:30 | USD | Durables Ex Transportation Jul P | 0.20% | 0.30% | 0.20% |
UK 100 Index Hovers Within 50- and 200-Day SMAs; Neutral Outlook
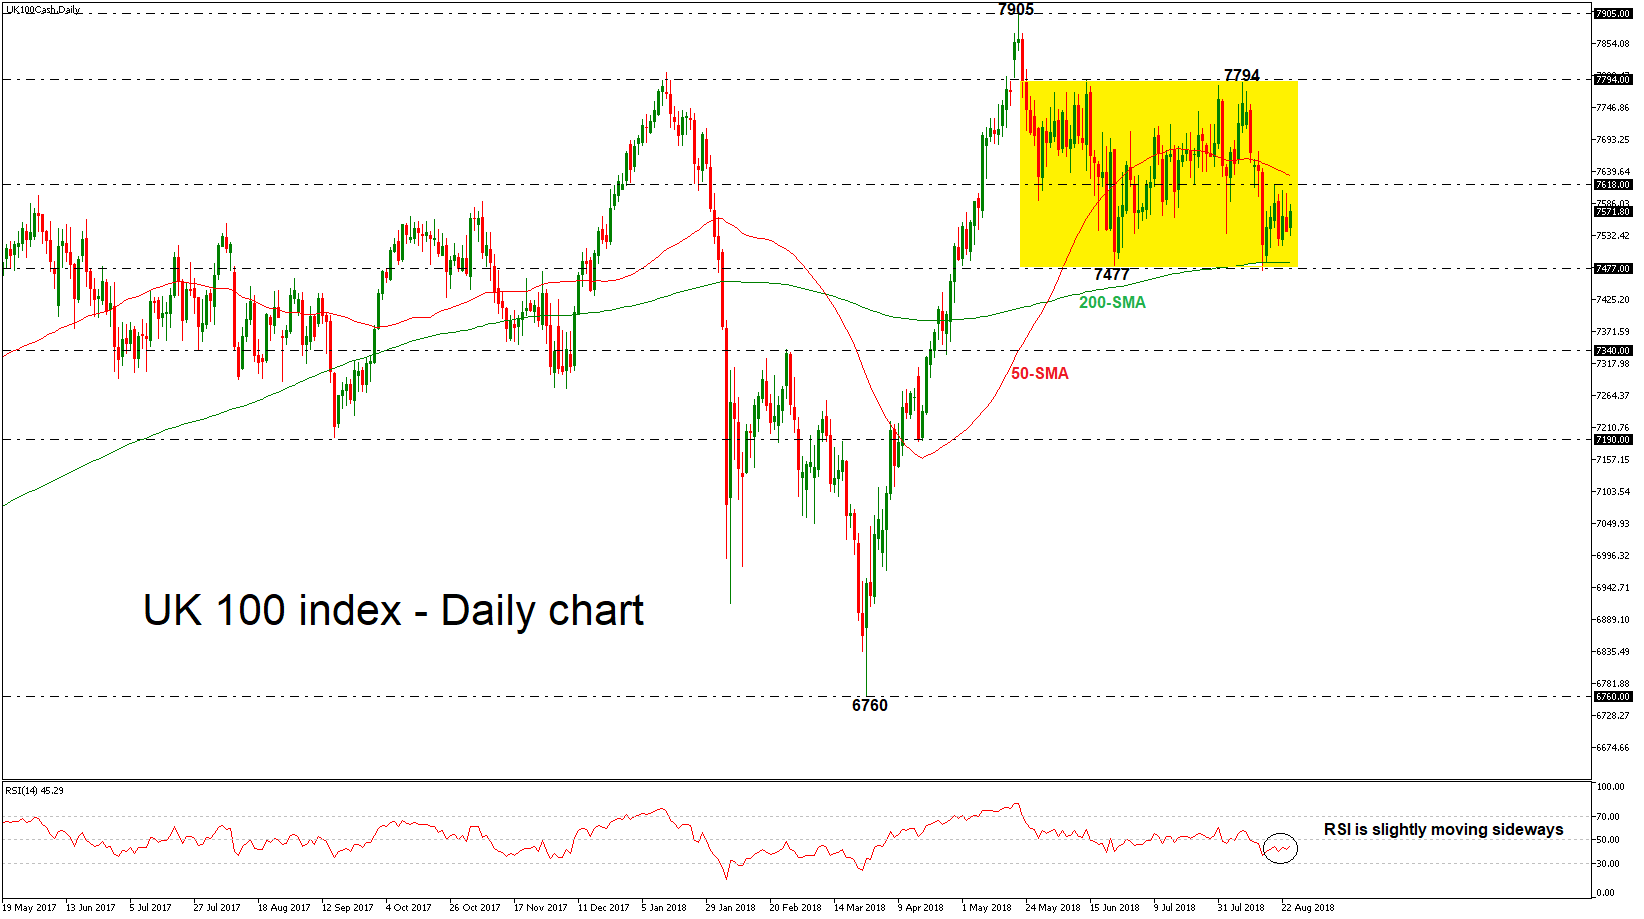
The UK 100 index has been moving within the 50- and 200-day simple moving averages (SMAs) since August 15. The technical indicators are suggesting further continuation of the neutral structure as the RSI is largely moving sideways in the daily timeframe.
If the price has a significant leg lower, closing below the 7477 key level which overlaps with the 200-day SMA, this could push the index towards the 7340 support level, taken from the highs on February 27. The next key support to watch further below is 7190, identified by the April 16 low.
Should the index manage to post advance, the next resistance could come around 7618, before challenging the 7794 critical level. A break above this obstacle would shift the bias from neutral to a more bullish one and open the way towards the 7905 resistance level, where the benchmark topped on May 22.
In the medium-term, there is no clear trend over the last twelve weeks, as the price holds within the 7794 resistance level and the 7477 support barrier. Note, though, that that in the weekly chart UK 100 holds above the 50- and 200-SMAs.