Sample Category Title
USD/JPY Breaks Pattern
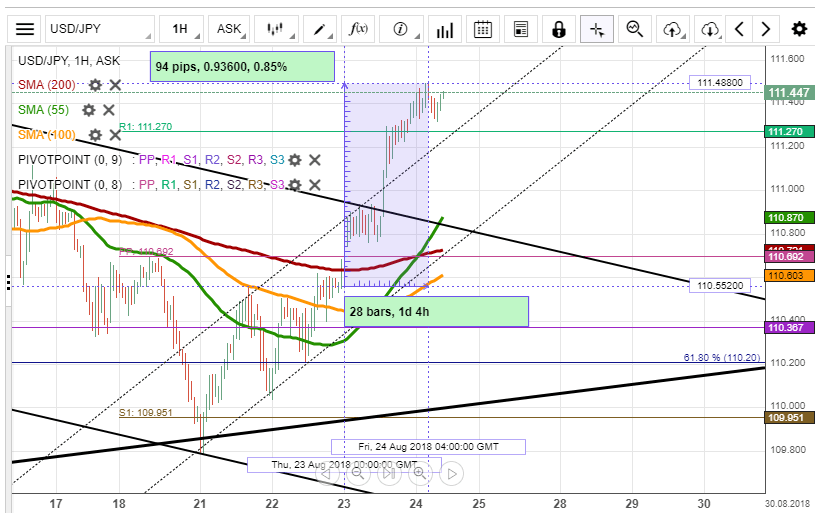
The Japanese Yen has still been depreciating against the US Dollar during the last three days. The main pair passed through the monthly PP( 110.692) and tested the weekly R1 during Thursday's trading session. In general, the US Dollar recovered 0.85% from Wednesday night until Friday morning.
On Friday morning, the main pair was at 1.1270, showing strong bullish signals. The US Dollar passed through all SMAs on Wednesday and breached pattern starting from yesterday's session.
On Friday, we can observe that the currency movement is trying to fit into the existing trend line. The 55-hour and 100-hour SMAs have crossed during yesterday's trading session as it was expected. However, the 200-hour SMA joined the club crossing the 55-hour SMA early on Friday.
XAU/USD Tests Upper Trend Line
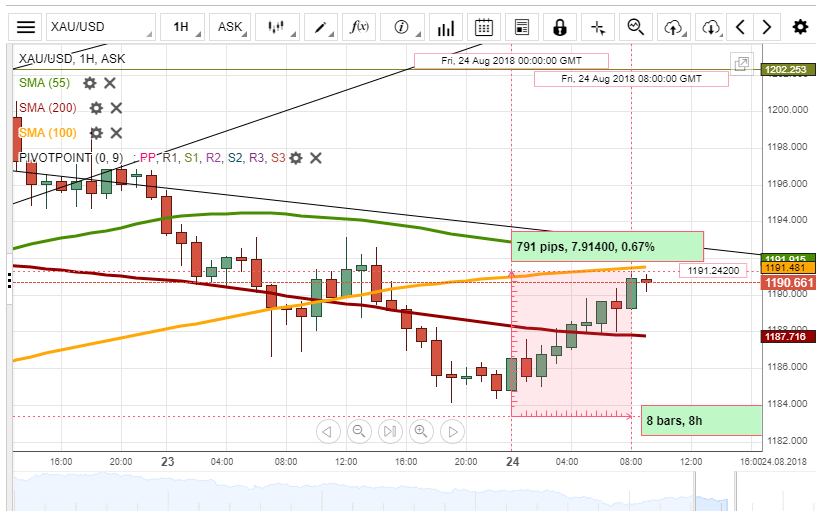
The yellow metal has appreciated 0.67% against the US Dollar since Friday morning. The pair tested the bottom boundary of the trend line early on Thursday and tried to reach the top early on Friday.
During Friday morning hours, Gold was at 1,191.10, testing the 55-hour SMA (4H) as additional support level to recover itself. It seems that the 55-hour and 100-hour SMAs should cross at today's trading session giving strong bullish signals for traders.
The nearest support level is the monthly S2 at 1,117.90, while the nearest resistance level is the monthly S1 at 1,202.25.
EUR/GBP Bullish Zig Zag Pattern Possibly Targeting 0.9050
The EUR/GBP has formed a bullish zigzag, and at this point we can see two POC zones: 0.8990-0.9000 and 0.8970-80. Rejection from the zones should target 0.9020 and 0.9050. Bullish zig zag is valid as long as 0.8950 holds. Today it's Friday so we might see a profit taking that could provide us with the necessary retracement.
W L3 - Weekly Camarilla Pivot (Weekly Interim Support)
W H3 - Weekly Camarilla Pivot (Weekly Interim Resistance)
W H4 - Weekly Camarilla Pivot (Strong Weekly Resistance)
D H4 - Monthly Camarilla Pivot (Very Strong Daily Resistance)
D L3 – Monthly Camarilla Pivot (Daily Support)
D L4 – Monthly H4 Camarilla (Very Strong Daily Support)
POC - Point Of Confluence (The zone where we expect the price to react - aka the entry zone)

EUR/USD – Euro Edges Higher As German GDP Matches Forecast
EUR/USD has reversed directions in Friday trade and posted slight gains. Currently, the pair is trading at 1.1565, up 0.21% on the day. On the release front, German Final GDP improved to 0.5% in the second quarter, matching the estimate. In the U.S, the markets are expecting mixed results from durable goods reports for July. Core durable goods are forecast to rise to 0.5%, while durable goods are expected to downturn, with an estimate of -0.7%. Investors will be listening closely as Federal Reserve Chair Jerome Powell speaks at the economic symposium at Jackson Hole.
With a dearth of data for the markets to digest the week, the Federal Reserve is in the spotlight. Fed chair Jerome Powell will address the Jackson Hole gathering of central bankers. With the heads of the ECB and Bank of Japan conspicuously absent, Powell’s speech will be the main event of the meeting. With a September rate hike practically a given, investors will be looking for Powell to discuss trade tensions, particularly with China, as well as the lack of wage growth despite a tight labor market. Earlier this week, Powell said that the Federal Reserve would maintain its independence and would not be influenced by President Trump’s criticism of the Fed’s plans to continue raising interest rates.
The Federal Reserve released the minutes of its August meeting on Wednesday. The minutes noted that the U.S economy remains strong and hinted that the Fed would raise rates in September. However, policymakers added that there plan to continue with gradual rate increases could have to be halted if the global trade war worsened, as the trade war represented a major downside risk to the U.S economy. The minutes have cemented a rate hike in September, with an estimate of 98%, while the odds of a December rate hike stand at 57%.
USDJPY Outlook: Break Above Daily Cloud Top To Spark Further Recovery
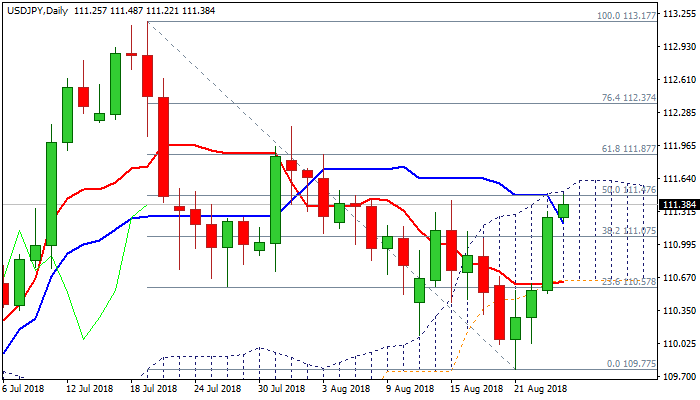
The pair maintains firm tone for the fourth straight day and pressures key barrier at 111.51 (daily cloud top) in extension of strong bullish acceleration on Thursday. Daily MA's turned to bullish setup and momentum strengthened, supporting the advance. Strong bullish signal could be expected on close above daily cloud, which would open way towards strong barriers at 111.87 (Fibo 61.8% of 113.17/109.77 descend) and 112.15 (01 Aug high). Meanwhile, bulls may show hesitation at cloud top, which could result in extended consolidation before fresh push higher. Former strong barriers at 111.00 zone (converged 20/55SMA's) now reverted to supports and are expected to contain stronger downticks to keep bullish bias in play.
Res: 111.51, 111.87, 112.15, 112.37
Sup: 111.22, 111.00, 110.74, 110.64
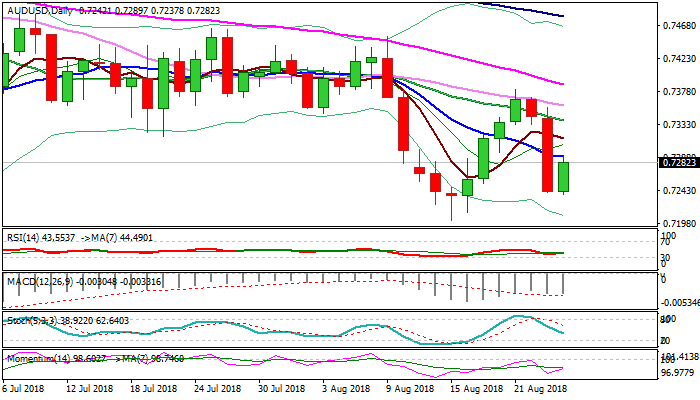
AUDUSD Outlook: New PM Election Provides Temporary Relief, But Overall Bearish Picture Keeps The Risk Skewed Lower
The Aussie dollar bounced on Friday, gaining 0.6% in Asia after election of new ruling party leader signaled an end of political crisis. Fresh rally so far retraced nearly 38.2% of bear-leg from 0.7381 in past two days, as Thursday's fall marked the biggest one-day fall since 14 June. Immediate risk of retesting key near-term support at 0.7202 (15 Aug low) has eased, but bearish weeklies keep the downside vulnerable. Fresh momentum underpins the action which attacks 10SMA (0.7289) break of which would signal further recovery towards a cluster of barriers at: 0.7315 (5SMA), 0.7338 (20SMA), 0.7359 (30SMA). Stronger bullish signal could be expected on break above 0.7381/88 pivots (21 Aug high/falling 55SMA). Fresh recovery is supported by weaker greenback after US/China trade talks ended without progress, but today's speech of Fed chairman Powell in Jackson Hole symposium will be closely watched for fresh signals.
Res: 0.7289, 0.7315, 0.7338, 0.7359
Sup: 0.7271, 0.7237, 0.7202, 0.7158
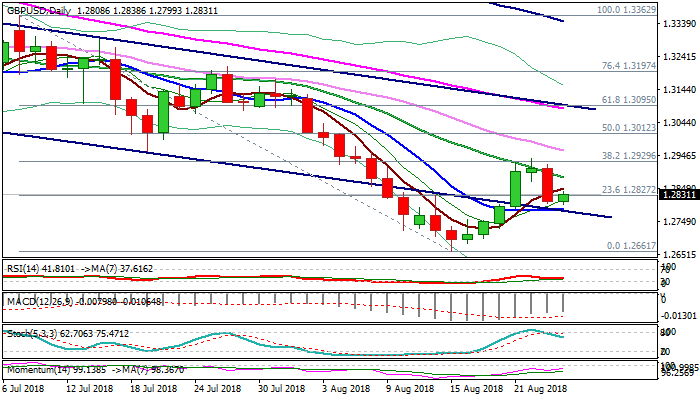
GBPUSD Outlook: No Clear Direction While The Price Holds Between 10 & 20SMA’s
Cable is taking a breather after strong fall on Thursday and consolidating above strong supports at 1.2789/81 (10SMA / bear-channel support line) which stayed intact, keeping risk of further weakness sidelined, despite formation of reversal pattern on daily chart.
Mixed daily techs lack firmer direction signal, as the price holds between falling 20SMA (currently at 1.2882) and north-turning 10SMA (1.2789), with break of either barrier expected to generate firmer direction signal.
On the other side, risk of stronger recovery remains as Doji reversal pattern is forming on weekly chart, but close above 1.2729 (Fibo 38.2% of 1.3362/1.2661 downleg) is needed to confirm scenario.
Res: 1.2848, 1.2881, 1.2929, 1.2961
Sup: 1.2800, 1.2789, 1.2766, 1.2726
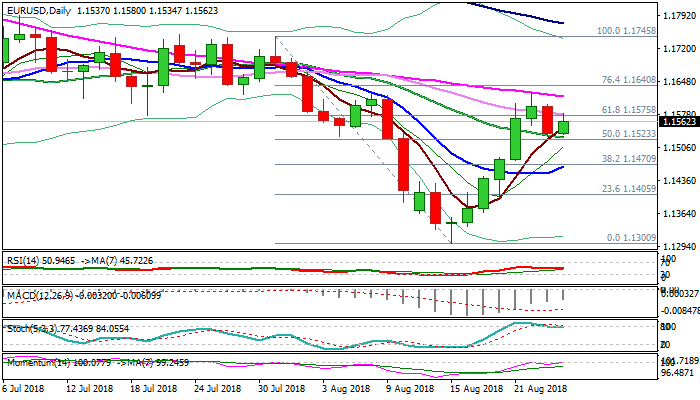
EURUSD Outlook: Bounce From Key Supports Shifts Focus Higher
The Euro trades higher on Friday after previous day's fall was contained by 20SMA, sidelining risk of deeper pullback.
Rising bullish momentum on daily chart is supportive for further recovery and retest of key near-term barrier – falling 55SMA (1.1616), close above which would signal bullish continuation.
In addition, reversal pattern has formed on weekly chart, on previous week's hammer and this week's strong rally which penetrated thick weekly cloud, suggesting that further advance could anticipated in coming sessions.
Weekly close above key supports at 1.1528/25 (20SMA/weekly cloud base) is needed to confirm scenario.
Res: 1.1578, 1.1616, 1.1640, 1.1659
Sup: 1.1549, 1.1525, 1.1500, 1.1462
The Analytical Overview Of The Main Currency Pairs
The EUR/USD currency pair
Technical indicators of the currency pair:
Prev Open: 1.15938
Open: 1.15367
% chg. over the last day: -0.47
Day's range: 1.15651 – 1.15764
52 wk range: 1.0571 – 1.2557
Yesterday, the bearish sentiment was observed on the EUR/USD currency pair. The decrease in quotations was more than 60 points. At the moment, quotes are recovering. The local support and resistance levels are: 1.15500 and 1.15850, respectively. We recommend opening positions from these marks. The trading instrument is tending to grow.
The news feed on 2018.08.24:
Data on GDP of Germany at 09:00 (GMT+3:00);
Basic orders for durable goods in the US at 15:30 (GMT+3:00).
We also recommend paying attention to the speech by the Fed's head, Powell.
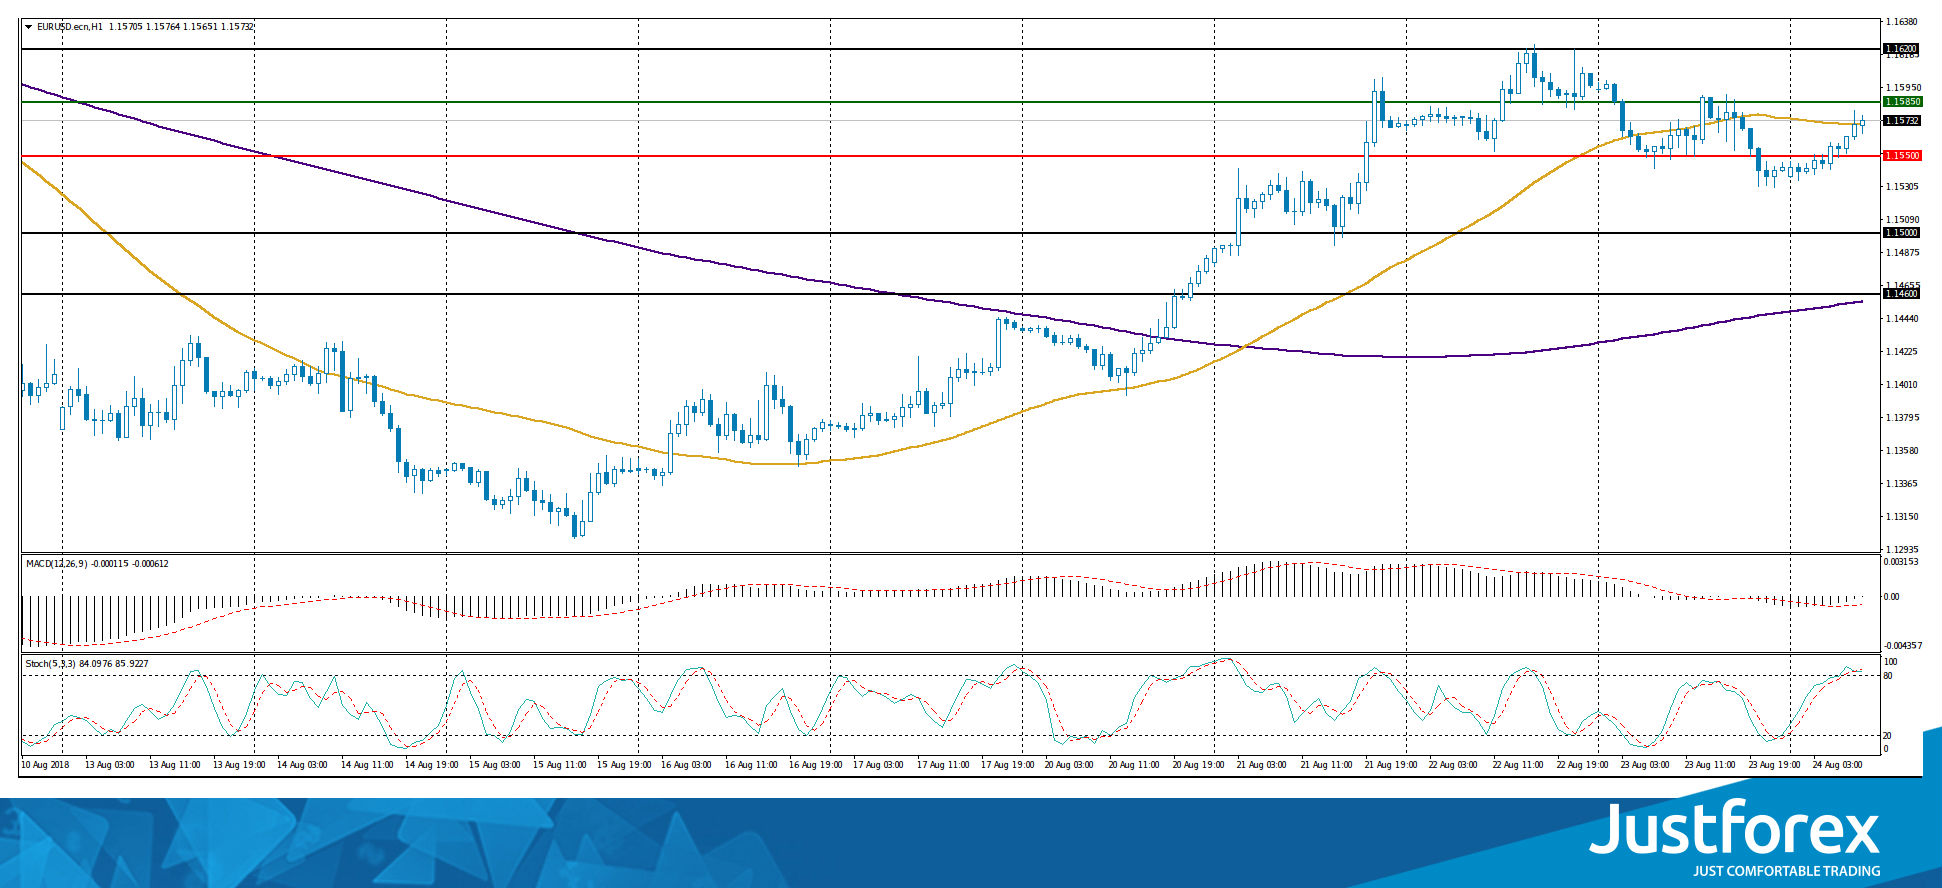
Indicators do not send accurate signals: the price is testing 50 MA.
The MACD histogram is located near the 0 mark.
Stochastic Oscillator is in the overbought zone, the %K line has crossed the %D line. There are no exact signals.
Trading recommendations
Support levels: 1.15500, 1.15000, 1.14600
Resistance levels: 1.15850, 1.16200
If the price fixes above the resistance level of 1.15850, further growth of the EUR/USD currency pair is expected. The movement is tending to 1.16200-1.16500.
Alternative option. If the price fixes below the support of 1.15500, we recommend considering sales of EUR/USD. The movement is tending to 1.15000-1.14800.
The GBP/USD currency pair
Technical indicators of the currency pair:
Prev Open: 1.29006
Open: 1.28097
% chg. over the last day: -0.79
Day's range: 1.28201 – 1.28307
52 wk range: 1.2361 – 1.4345
Yesterday aggressive sales were observed on the GBP/USD currency pair. The decrease in quotations exceeded 100 points. At the moment, the trading instrument is recovering. Local support and resistance levels are: 1.28100 and 1.28450, respectively. The positions must be opened from these marks.
The news feed on the UK economy is calm.
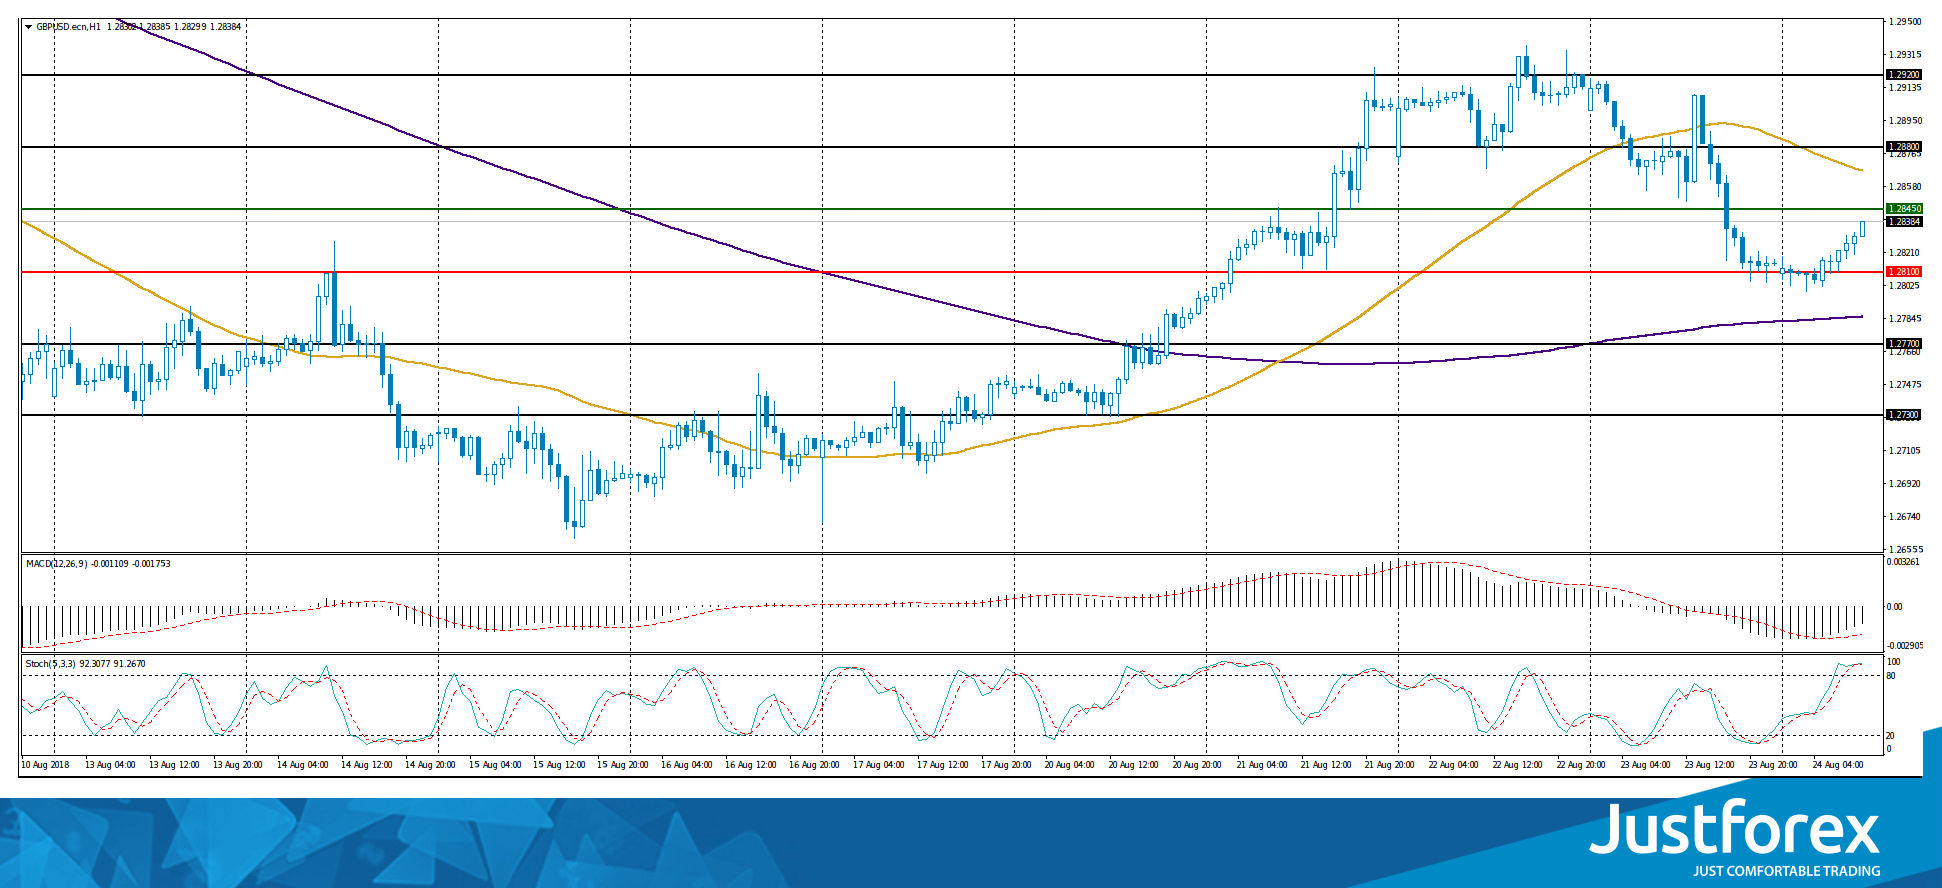
Indicators do not send accurate signals: the price is being traded between 50 MA and 200 MA.
The MACD histogram is in the negative zone, but above the signal line, which gives a weak signal to sell GBP/USD.
Stochastic Oscillator is located in the overbought zone, the %K line is crossing the %D line. There are no exact signals.
Trading recommendations
Support levels: 1.28100, 1.27700, 1.27300
Resistance levels: 1.28450, 1.28800, 1.29200
If the price fixes above 1.28450, the GBP/USD currency pair is expected to grow. The target level of movement is 1.28800-1.29000.
Alternative option. If the price fixes below 1.28100, we recommend considering sales of GBP/USD. The target movement level is 1.27700-1.27500.
The USD/CAD currency pair
Technical indicators of the currency pair:
Prev Open: 1.30367
Open: 1.30788
% chg. over the last day: +0.79
Day's range: 1.30740 – 1.30792
52 wk range: 1.2059 – 1.3795
Yesterday there were purchases on the USD/CAD currency pair. The growth of quotations exceeded 100 points. At the moment, the trading instrument has started declining. Local support and resistance levels are: 1.30650 and 1.30900, respectively. We recommend opening positions from these marks. The trading instrument is tending to fall.
The news feed on Canada's economy is calm.
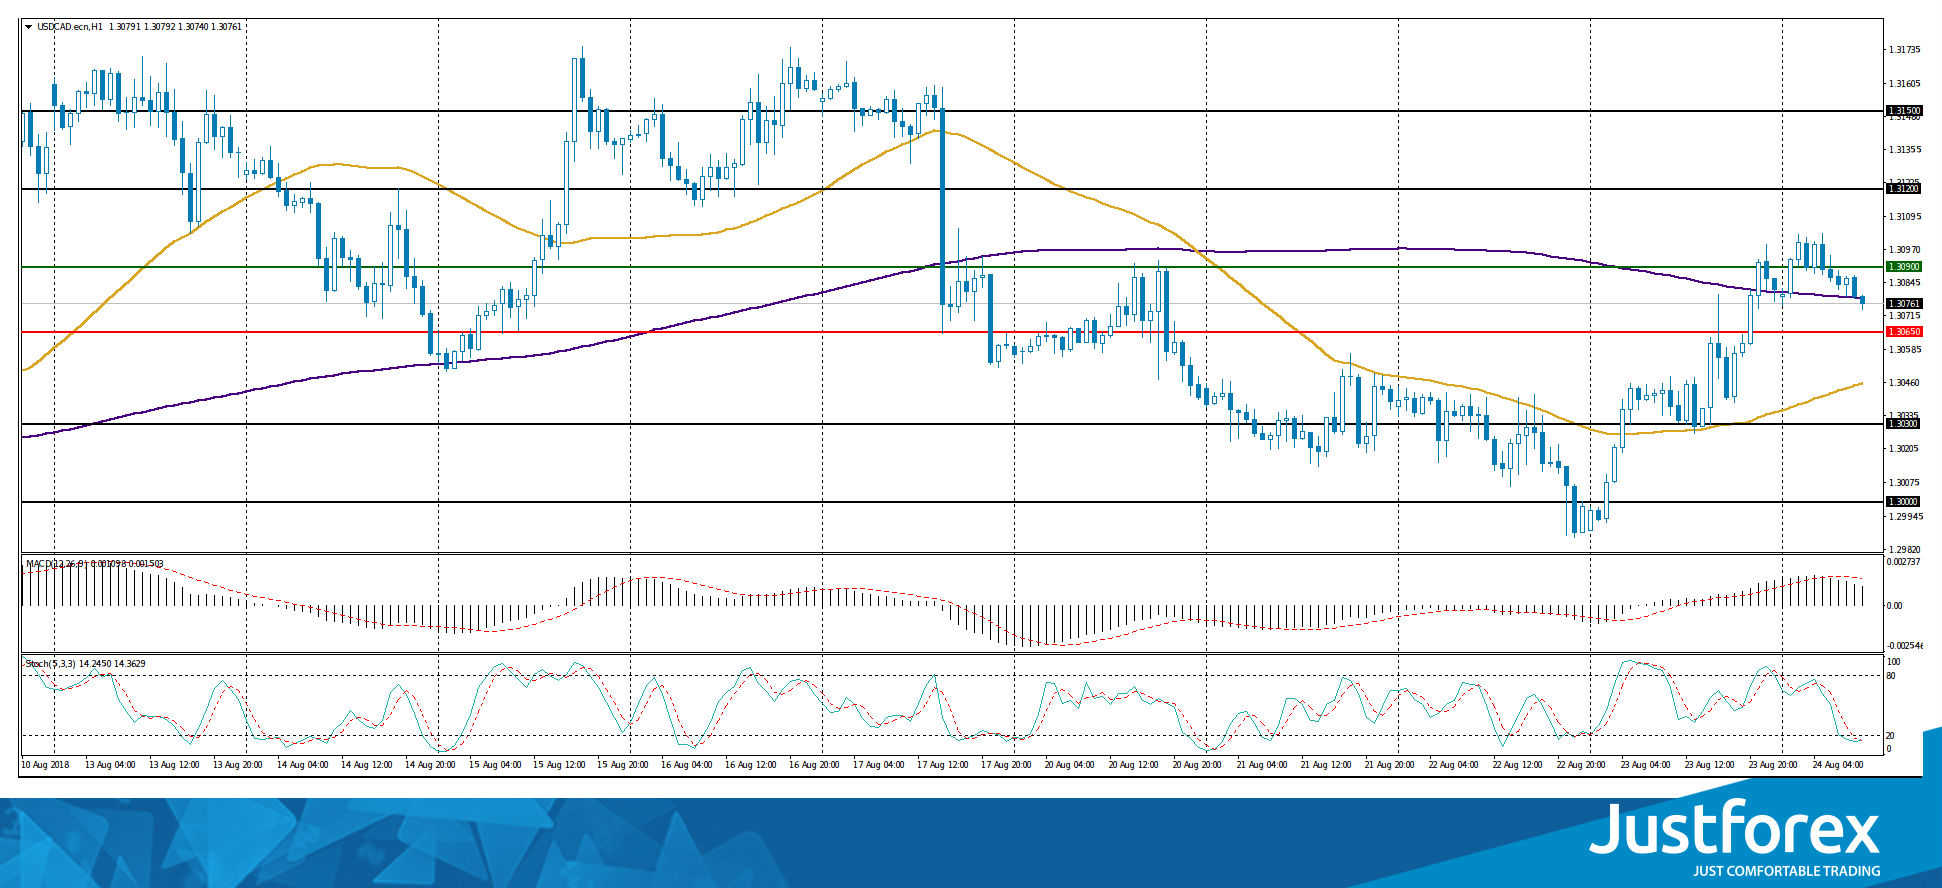
Indicators do not send accurate signals: the price is testing 200 MA.
The MACD histogram is in the positive zone, but below the signal line, which gives a weak signal to buy USD/CAD.
Stochastic Oscillator is located in the oversold zone, the %K line is crossing the %D line. There are no accurate signals.
Trading recommendations
Support levels: 1.30650, 1.30300, 1.30000
Resistance levels: 1.30900, 1.31200, 1.31500
If the price fixes below 1.30650, the USD/CAD quotes are expected to decline further. The movement is tending to 1.30300-1.30000.
Alternative option. If the price fixes above the resistance of 1.30900, it is necessary to consider buying USD/CAD. The movement is tending to 1.31200-1.31500.
The USD/JPY currency pair:
Technical indicators of the currency pair:
Prev Open: 110.549
Open: 111.229
% chg. over the last day: +0.73
Day's range: 111.305 – 111.350
52 wk range: 104.56 – 114.74
Yesterday, aggressive purchases were observed on the USD/JPY currency pair. The quotes rose by more than 90 points. At the moment, the key levels of support and resistance are 111.200 and 111.450, respectively. The positions must be opened from these marks. In the near future, technical correction is not ruled out.
The news feed on Japan's economy is calm.
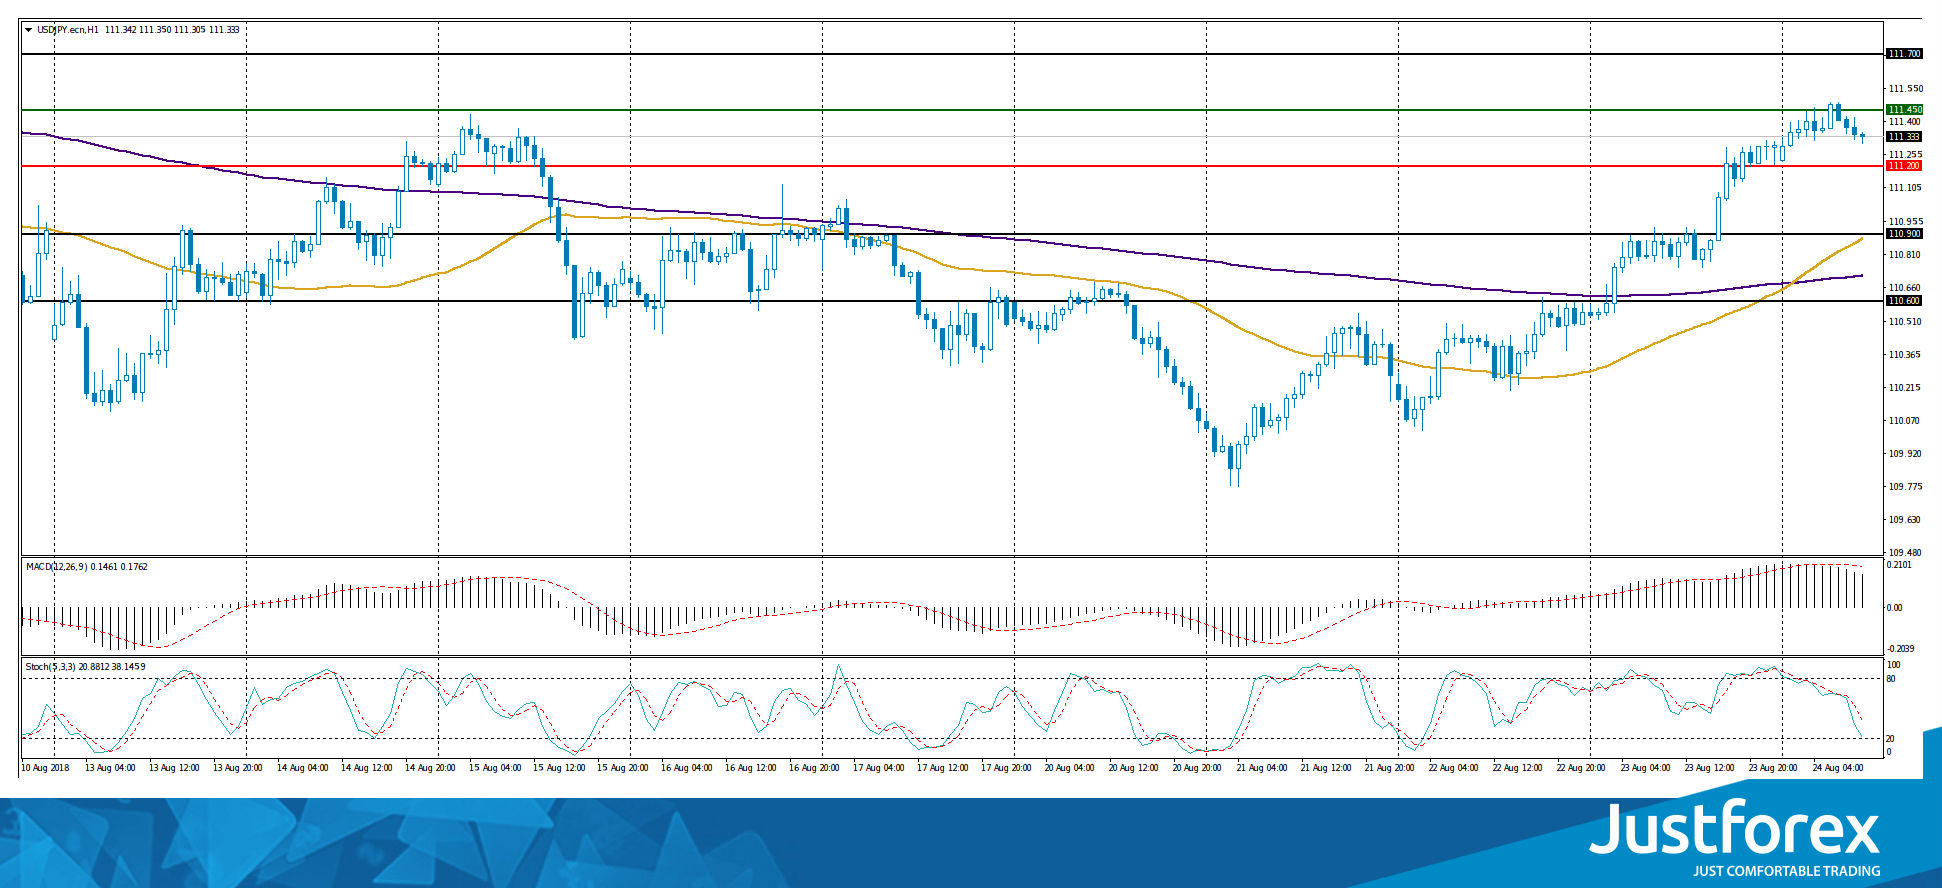
Indicators point to the power of buyers: the price is above 50 MA and 200 MA.
The MACD histogram is in the positive zone, but below the signal line, which gives a weak signal to buy USD/JPY.
Stochastic Oscillator is located in the neutral zone, the %K line is below the %D line, which indicates a decrease in quotes.
Trading recommendations
Support levels: 111.200, 110.900, 110.600
Resistance levels: 111.450, 111.700
If the price fixes above the resistance level of 111.450, it is necessary to consider buying USD/JPY. The movement is tending to 111.700-112.000.
Alternative option. If the price fixes below the level of 111.200, the correction of the USD/JPY currency pair is expected. The movement is tending to 110.900-110.600.
Dollar Is Waiting For What Powell Says Today
The U.S. dollar has returned to growth on the comments from the Fed officials about the need of further rates increases this year and next one. At the end of the day, the dollar index added 0.5% to 95.50. Robert Kaplan and Easter George, the heads of the Fed's regional Reserve Banks, said on Thursday that Trump's comments would not affect the central bank's policy. Those statements made by the Fed representatives strengthened the confidence of the markets in the September hike. The markets also expect a similar rhetoric from today's Jerome Powell's speech at the Jackson Hole symposium.
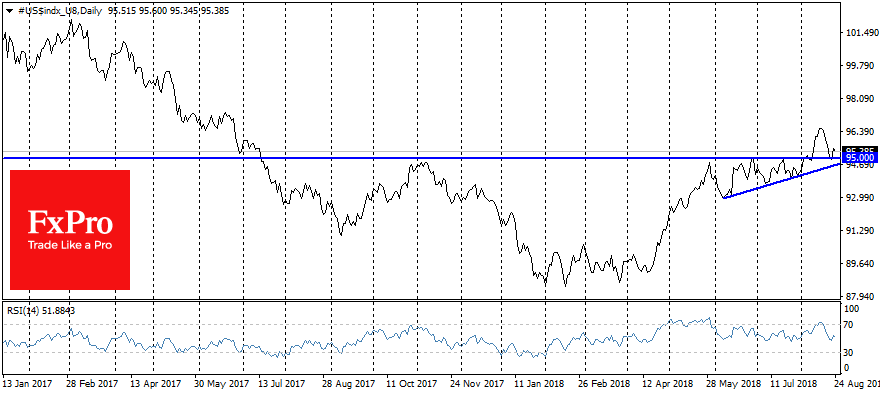
The two ways for FOMC
Market participants will try to assess how much the Fed's head is concerned about the state of international markets. The consequences of trade conflicts can be assessed from different perspectives.
The new tariffs increase inflationary pressure that will require from the Fed to intensify its rate hikes. In this case, the U.S. currency can return to active growth.
On the other hand, in previous years, the American central bank had corrected its plans considering the state of the world markets. The turbulence of China's markets in 2015 forced to postpone the tightening of the policy. Such caution is favourable for the stock markets and the demand for risks but it can cause a weakening of the dollar. The tactics of monetary policy and the nearest prospects of the dollar depend on the long-term Fed head's perspective.
The U.S. Dollar continues its growth
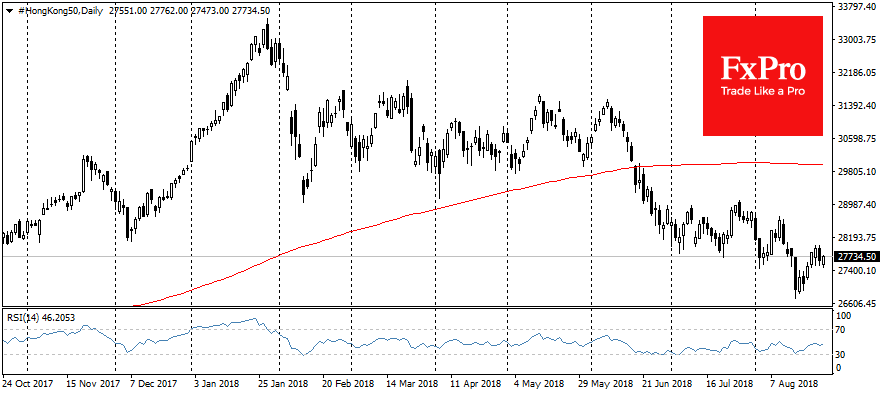
The meeting on trade talks between the U.S. and China did not bring breakthroughs, which also puts pressure on Asian stock markets on Friday morning, as MSCI loses 0.6%, and Hong Kong's largest companies lose 0.8%. The decline in stocks hampers the demand for the emerging market currencies and supports the dollar.
The strong level of support, which the dollar index approached in the first half of the week, can also explain the reversal to growth. The American currency had experienced an increased demand on falls to the former upper bound of the trading range for the previous three months. The increase above 95.0 level by DXY earlier in August marked the probable beginning of a new American currency rally, which was stopped by Donald Trump's comments at the beginning of the week.
The dollar purchases on its fall confirm the hypothesis that the former strong resistance is now becoming a significant support level. The EURUSD pair again backs down, unable to catch the levels above 1.1600, and starts Friday with the marks near 1.1530.