Sample Category Title
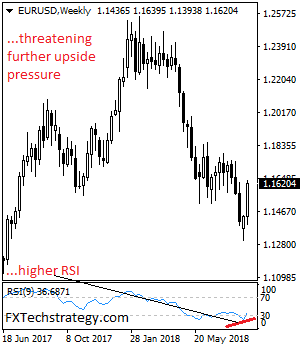
EURUSD – Sets Up To Recover Further Higher
EURUSD - The pair looks to recover further higher following its past week strength. On the upside, resistance comes in at 1.1650 level with a cut through here opening the door for more upside towards the 1.1700 level. Further up, resistance lies at the 1.1750 level where a break will expose the 1.1800 level. Conversely, support lies at the 1.1600 level where a violation will aim at the 1.1550 level. A break of here will aim at the 1.1500 level. Below here will open the door for more weakness towards the 1.1450. All in all, EURUSD faces further upside pressure
GOLD – Bullish, Eyes Further Upside Pressure On Correction
GOLD - The commodity continues to hold on to its upside pressure closing higher the past week. On the downside, support comes in at the 1,200.00 level where a break will turn attention to the 1,190.00 level. Further down, a cut through here will open the door for a move lower towards the 1,180.00 level. Below here if seen could trigger further downside pressure targeting the 1,170.00 level. Conversely, resistance resides at the 1,220.00 level where a break will aim at the 1,230.00 level. A turn above there will expose the 1,240.00 level. Further out, resistance stands at the 1,250.00 level. All in all, GOLD looks to strengthen further higher.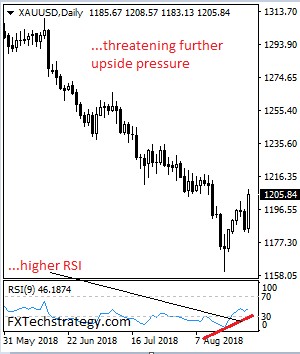
Eco Data 8/27/18
[php_everywhere instance="1"]
Trading the Higher Timeframes
Is spending countless hours at your trading desk the kind of freedom you had in mind when you first voyaged into the trading world?
If you are one of those unfortunate souls scrutinizing each pip movement with little to show for it, switching things up to the higher timeframes could be an option. Remember the old adage that ‘less is more’?
What can the higher timeframes offer you?
Some of the best traders in the world used the higher timeframes to profit from market movements. Nicolas Darvas earned millions of dollars placing trades after the market close. Ed Seykota produced incredible returns for decades using end-of-day data.
Less stressful
Rather than spending all of your waking hours observing the short-term gyrations of the market, trading the higher timeframes would be far less taxing. An hour in the morning and perhaps an hour in the evening to check any trades or alter any levels should be sufficient.
We find that most intraday traders are stressed due to the NEED to make money! Moving your trading up to the higher timeframes would allow one to keep their day job.
Helps avoid overtrading
Arguably the most common pitfall in this business is overtrading. Using the higher timeframes will help eliminate this, since you should have minimal interaction with the market.
Teaches patience
Trading the higher timeframes can sometimes require one to wait days, or even weeks, for a setup to appear on the radar. Having the patience to remain on the bench when there’s little going on is vital to a traders success, both in intraday and longer-term settings.
Lower timeframes are just noise?
There are plenty of traders that strictly follow the larger timeframes. Some also claim that lower-timeframe structure is nothing more than noise. While we understand and respect their opinion, we would have to humbly disagree.
Trading intraday timeframes as opposed to the higher timeframes requires a completely different mind-set. Traders using the higher timeframes have to adopt more of a longer-term view, similar to that of an investor. Intraday traders, however, typically look to be in and out of the market within the day, requiring more of a speculative mind-set.
Also noteworthy, entry is crucial on the lower timeframes, while on the higher timeframes entry is a little more flexible as you tend to have more space to work with.
The higher timeframes can also benefit intraday traders!
Here is an example on the AUS200 CFD chart. Ok, we know this is not an intraday view, but it serves well as an introductory case:
See how Aussie shares were recently confined to a four-month range on the daily timeframe. Just looking at this timeframe, one could conclude that there’s equal opportunity to trade both long and short here, right?
Reading the higher timeframes, nevertheless, allowed us to observe a monthly demand in play. In fact, the four-month daily consolidation formed around the top edge of the monthly demand! Knowing this, what direction would you think the market is likely to trade once the range has broken down? North!
This could just as easily have been the M15 chart forming a range around the top edge of a H1 demand or support, it’s all the same thing. Knowing where you are trading in the bigger picture will help avoid traps. For example, buying into a higher-timeframe supply (usually not visible on the lower timeframes) from a lower-timeframe support would likely force an unnecessary loss.
In closing…
To be frank, we do not personally place special value on any timeframe. We just know that a trading style has to fuse with one’s personality and lifestyle. For instance, trying to cram 4 hours of intraday trading spread between your lunch break, the train journey home and when you’re eating dinner is not ideal trading conditions. In this case, it would be far simpler to switch to the higher timeframes. If, however, you have reasonably stable financials, have free time and have more of a speculative mind-set, then intraday trading could be the path to take.
What Does Fearful Money Mean to Traders?
Fearful money, or as we like to refer to it as ‘hot money’, is capital that a trader has a strong emotional attachment to. In other words, it is money that one CANNOT afford to lose, and therefore, should not really be using it to trade the markets with. An example of hot money is one’s rental funds or grocery budget.
You may not know this, but trading with hot money has an incredibly detrimental effect on your trading.
Trading with hot money
Attempting to justify the use of funds needed for living expenses is a catastrophic mistake! Almost in all cases, the emotional impact will not only adversely affect your ability to pin down high-probability trading opportunities, it’ll also affect how you actually manage the trades. According to the late Mark Douglas, author of The Disciplined Trader, the fear of losing one’s fortune is every bit as intense as the fear of losing one’s life.
It’d be challenging to find a better analogy than this!
How can hot money affect your ability to trade?
Maintaining a neutral mind-set is crucial in this business. In fact, it is perhaps one of the key elements that can determine whether one succeeds or not. For the most part, you need to be at a complete ease when trading. Worrying about the outcome of the next trade, or the next five trades, is NOT how professional traders operate. Unfortunately, this is precisely what you’ll be doing should you trade with hot capital.
Assume for a moment that you have been having success trading with a small live account, which is funded using ‘cold money’ – essentially the opposite of hot money. Your trading strategy is simple to follow and your bottom line is steadily increasing. If you were to increase the account’s value with hot money, you will likely begin second guessing perfectly valid setups. You may even begin hesitating and not pulling the trigger when you’re supposed to. It can also, as briefly mentioned above, affect the way you manage your trades. You may, given the risk associated with hot money, close winning trades out too early and give losing trades the space to run.
Trading with cold money
An easy way to determine if you’re trading with cold money is to imagine that you lost all of the money in your account. Would it affect your standard of living or wipe out your entire life savings? If the answer is no, then you’re probably trading with cold funds. If you answered yes, however, then you may want to reconsider your account size. While we understand that no one likes to lose money, hot or cold, the point we’re trying to get across here is that the emotional connection to your account value will be far less gripping if you trade with cold money.
A cool, yet conservative, way of building an account funded with cold money is to construct a ‘ladder’. What we mean by this is simply start by investing an amount of capital that you feel is cold. From that point, only add funds (again preferably cold money) to this account once you’re able to establish some consistency. This helps build one’s confidence.
An example of the ladder formation could be a $500 account to begin with, which will only be increased ONCE the bottom line shows a 10% gain. This could take a month or a year. It does not matter. If 10% is your target and this has been achieved, you’re then permitted to add additional funds. This can be continued until you’ve attained a satisfactory account. This way, you’re building your account in a controlled manner using only cold money.
In closing…
To trade successfully, you not only need to have a well-defined trading plan and methodology, you also need to reduce fear to a level where it is considered healthy. To put it another way, you need to respect the reality of risk but not let your judgement be impaired by FEAR. Trading with cold capital will help position you in this state of mind.
Using Psychological Levels in your Trading
Plotting support and resistance levels is often a challenging and subjective task. It is also commonly one of the first areas of price action new traders attempt to tackle.
Support and resistance can be established in numerous ways, such as: trendlines, moving averages, pivot point levels, Fibonacci levels, key high/low points etc. A common complaint with a lot of these methods though is subjectivity.
This is why we believe psychological levels are appealing, as the numbers are effectively embedded within market structure and are entirely objective, as you’ll see going forward.
What are psychological levels?
Say that you’re the proud owner of new car, and a buddy down the pub asks how much it cost. Assuming it set you back $10,999, it’s unlikely that you would tell him that exact figure. Instead, to keep things simple, you’d probably round the number to the nearest thousand i.e. $11,000. And this is exactly what happens in the financial markets! It is far more likely that a trader will select 1.2500 over 1.2493, for example.
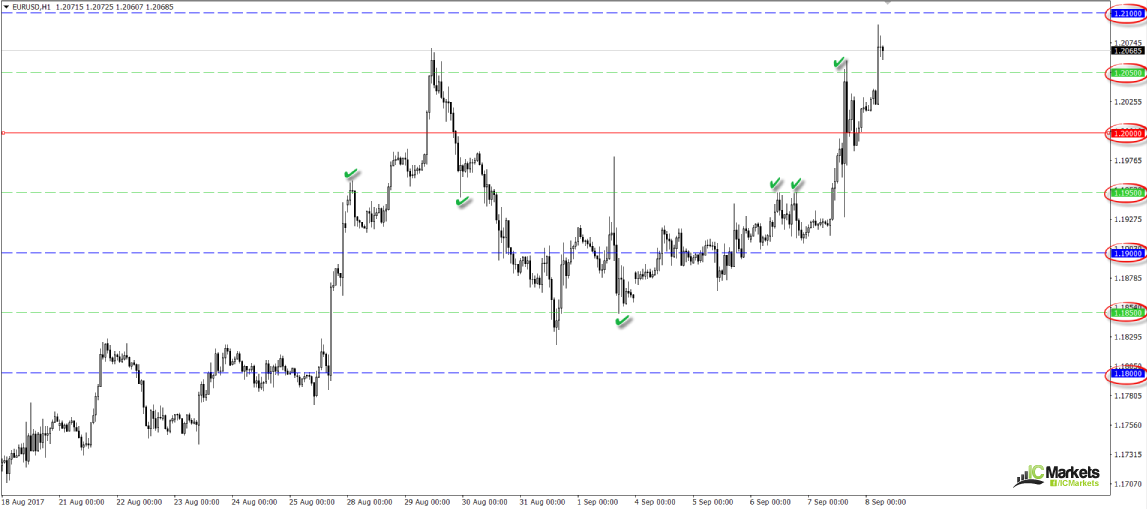
Take a look at the EUR/USD H1 chart below.
The red line signifies a key psychological boundary: 1.2000. Personally, we label these numbers ‘full levels’. Apart from parity, they’re the biggest round numbers in the market. For those who do not know what parity is, it is simply when 1 unit of a base currency equals 1 unit of the quote, or counter, currency. The EUR/USD trading at 1.0000 would be parity, for example.
The blue lines highlight additional key levels in the market: 1.2100/1.1900/1.1800. While these barriers do garner attention, they, in our humble view, do not pack as much of a punch as the ‘full levels’ noted above. Traders often label these numbers as ‘whole levels’ or ‘double zeros’.
The green lines show mid-level numbers: 1.2050/1.1950/1.1850. Although price action does respond to these lines, we tend to give them less weight than their bigger brothers mentioned above.
How can I trade psychological levels?
There are a number of techniques that employ these levels, with the most obvious leaning toward either fading or attempting to trade a breakout. Although there are traders out there that do make this work successfully, we found it incredibly challenging.
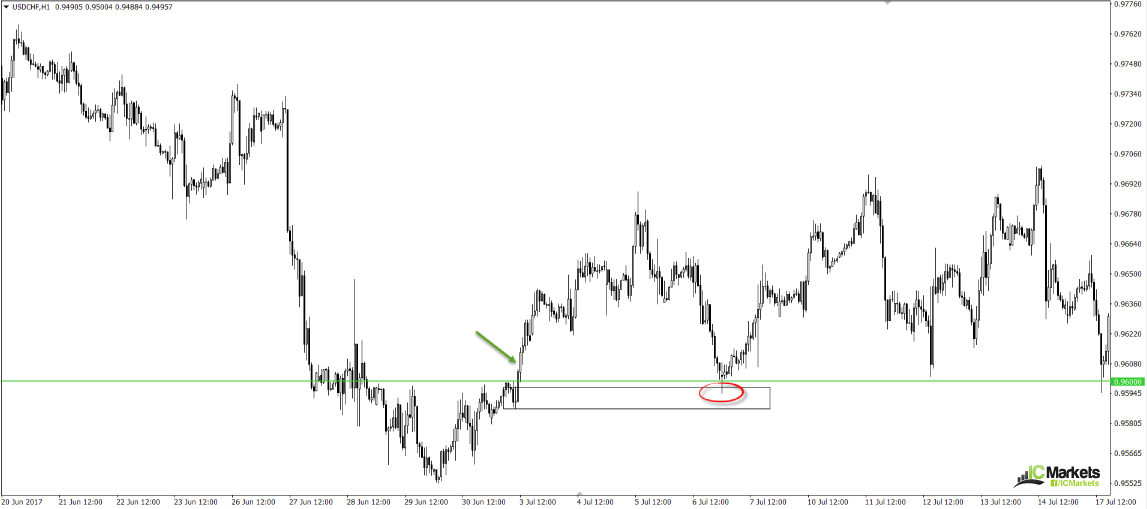
How we make use of these levels is simple. They form part of our ‘confluence toolbox’ used to confirm an area’s weight. For instance, the H1 demand area shown on the USD/CHF chart below boasts fantastic momentum to the upside (green arrow), thus easily noticeable for the majority of price action traders. But before labelling this as a valid trading zone, it’s essential that the base be confirmed with additional technical tools. As you can see, a few pips above the area there is a psychological level. This, along with the eye-catching demand, increases the odds of a successful trade. With that being said, however, we would not stop there. Further confirming the area using: Fib levels, trendlines and Harmonic patterns add to an area’s tradability.
Be wary of fakeouts around psychological price points
We personally have found no currency to respect round numbers any more than others. What we have seen over time though is how price whipsaws through these levels time and time again.
We’ve all been there (especially in the early stages of our journey) – a large round number approaches and the urge to trade it is strong. We remember back to the countless times these levels held and reversed price 100s of pips. So, we place a pending order with stops pegged 10-15 pips beyond the number. Price then steamrolls its way into the order and then takes our stop. Following this, price painfully reverses and trades in favour, typically leaving the trader frustrated.
You see, these levels are a magnet for orders! It is our belief that the big players in the market know this and, at times, use it to their advantage.
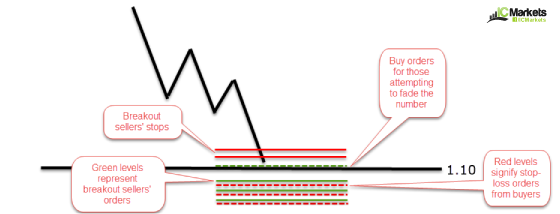
Imagine you’re an institutional trader with deep pockets. Price is approaching a large round number support (1.1000). You know that there are often both buyers looking to fade the level, and sellers looking to sell the breakout. Now say that you and a few other banks collectively begin selling at 1.1020. This forces the market to cross swords with 1.10, which fills buy orders.
Remember, it is at this point that the banks have only sell orders in the market, and in this scenario they need to be long. So, a well-known method in this situation is to run stops below the psychological level, also known as ‘stop hunting’.
With that, upon connecting with 1.10 more bank shorts are pumped into the market to push price into the stop losses, which are in fact sell orders. As these stops are being filled, the banks can then begin unloading shorts (closing a sell position requires liquidity in the form of buy orders: buyers’ stops). Do bear in mind though that there’s not only stops from the buyers below the round number, there’s also sell orders from the breakout sellers! Once bank short positions are liquidated, they can then begin buying.
Depending on how much liquidity is available (buyer stops and breakout sells) this could see price exceed the round number by several pips before the big boys have all, or at least some of their orders filled for a move north, which will at some point also fill the breakout sellers’ stops (buy orders).
We know this is a bit of mouthful to digest, so here is a basic pre-drawn chart for reference:
Just to be clear, we are certainly not saying that this is how price action moves each time a psychological level is in play. It is merely our reasoning behind why fakeouts occur at these price points.
In closing…
Put simply, psychological levels are a wonderful addition to a technician’s toolbox. Using the numbers to add weight to an area has a great deal of value. However, as highlighted above, do keep in mind that the levels are prone to fakeouts, and therefore should not be located near one’s stop loss.
Forex Forecast and Cryptocurrencies Forecast
First, a review of last week’s events:
EUR/USD. As expected, the US-China talks did not bring clarity: the only information came from the PRC Ministry of Commerce, which reported that the talks were frank and useful. Such a wording can be considered as the absence of specific results. Speech by Fed Chairman Jerome Powell was not revolutionary either and dropped the dollar by just 30 points.
In general, over the week, the euro rose by almost 200 points, which, in the first place, was caused by serious problems around the US president and his surrounding, which could turn into prison terms for his assistants and the criminal prosecution of Trump himself. The US decision to postpone the question of raising duties on cars from the EU played in favor of the euro as well. As a result, the pair completed the week session where 45% of experts had expected - at 1.1622, close to resistance 1.1630;
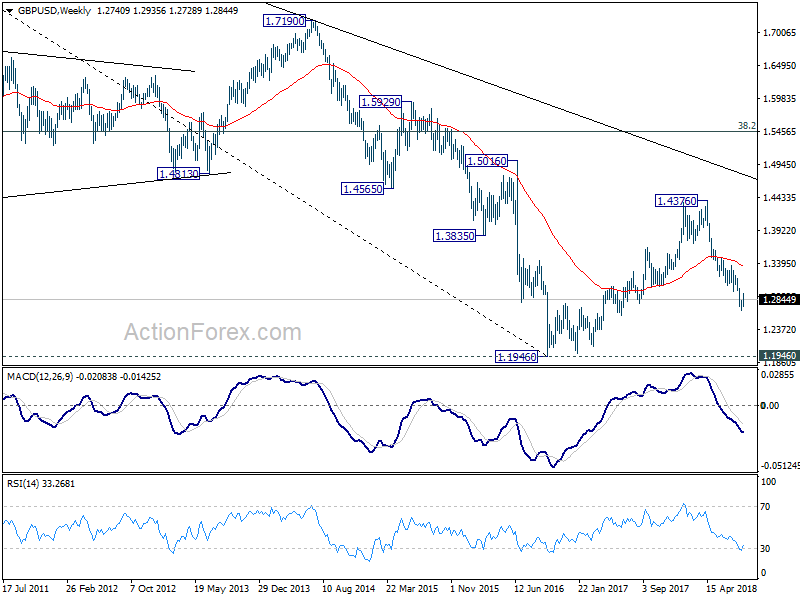
GBP/USD. Following the euro, the British pound grew against the dollar, reaching the middle of the medium-term downtrend, which began back in spring. The pair reached the marks of the beginning of August and met the end of the five-day period at 1.2845;
USD/JPY. Recall that 75% of analysts expected the pair to fall into the 109.00 zone, and 25% voted for its return to the levels of 111.00-112.00. The pair, according to the expectations of the majority, really went down and on Tuesday, August 21, it dropped to the level of 109.75. However, the drop ceased, and then the forecast of the remaining 25% of the experts was implemented: the pair rose to the area of 111.00-112.00, reaching the height of 111.50.The final chord sounded a little lower - at around 111.25;
Cryptocurrencies. The main bad news of the week is that the US Securities and Exchange Commission (SEC) has rejected five more (nine in total) applications to launch Bitcoin -oriented investment funds (Bitcoin-ETF). The main reason for the rejection is the same - the problems of crypto-exchanges with fraud and price manipulation. The good news is that the SEC can still reconsider its decision. The bulls were also pleased with the news that the world's first blockchain-based bonds issued by Bank of Australia, are actively bought by investors.
As for the crypto market capitalization, it has grown slightly and amounted to just over $210 billion.
In this situation, the pair BTC/USD continued to move almost all the time in a rather narrow range of $6,230-6,65 0. As we assumed, it was difficult enough for bitcoin to gain a foothold above the resistance of $6,830. The attempt on August 22 failed: reaching $6,885, the pair quickly turned around and returned to the weekly range. The next attempt occurred on Friday night, when the thin market becomes even thinner.
The breakdown of support $6,230 is hampered by the fact that it is already now that most miners are working on the verge of payback. And if there is a fall below the $6,000-6,100 zone, mining becomes almost unprofitable.
Litecoin (LTH), ripple (XRP) and many other top coins, have followed the bitcoin into a flat state. But the Ethereum (ETH) has once again demonstrated negative dynamics, having lost about 15% during the week.
As for the forecast for the coming week, summarizing the opinions of a number of analysts, as well as forecasts made on the basis of a variety of methods of technical and graphical analysis, we can say the following:
EUR/USD. No results in the US-China talks, possible impeachment of President Trump. One can also add the attacks of the US president towards the head of the Federal Reserve. The latter fell out of favor with Trump because of an excessively tight financial policy and an increase in lending rates. All this still creates uncertainty in the market, as a result of which the opinions of experts are divided as follows:
- 45% of them, supported by most oscillators and graphical analysis for H4, are in favor of further weakening of the dollar and the pair's transition to the zone 1.1630 -1.1750. The next resistance is 1.1840;
- 30% of analysts still believe in the dollar and are waiting for the pair to return to the mid-August low. The nearest support is 1.1430, the target is 1.1300. Graphical analysis on D1 and 15% of oscillators, signaling that the American currency is overbought, side with these analysts;
- and, finally, the remaining 25% of experts simply could not make a decision in this situation.
If we move to longer-term forecasts, more than 60% of experts give preference to the dollar. Thus, for example, while the EU is deciding whether to continue or not stimulating monetary policy, JP Morgan analysts forecast the euro/dollar rate at the level of 1.1000-1.1200 by the end of the year. The reasons are the same: Brexit, Italy and Turkey, along with other countries on the perimeter of the European Union. However, JP Morgan analysts do not exclude the rise of the European currency to the level of 1.1900 afterwards, but this will not happen until spring 2019;
GBP/USD. According to the graphical analysis, the future of this pair looks as follows: first growth to the upper boundary of the descending channel (zone 1.3000-1.3080), then rebound and fall first to support 1.2660, and then even lower, to the level of 1.2585. As for the indicators, there is a complete confusion among them. Some signal that the pair is overbought, some say it is oversold, some are painted red, others are green or neutral gray. A similar confusion can be seen among the experts as well. However, when we look at forecasts for autumn, the picture becomes more clear - here it is already more than 65% of analysts who talk about the growth of the pair. The targets, however, are still rather vague - from 1.3100 to 1.3500;
USD/JPY. The yen continues to be pressured by low inflation, which speaks of weak demand and hinders the GDP growth. The head of the Central Bank of Japan Haruhiko Kuroda has once even promised to commit hara-kiri if inflation does not reach the target of 2%. But the price increase is still extremely weak and has not even reached 1%. However, let's hope that Mr. Kuroda will not rush to fulfill his deadly promises.
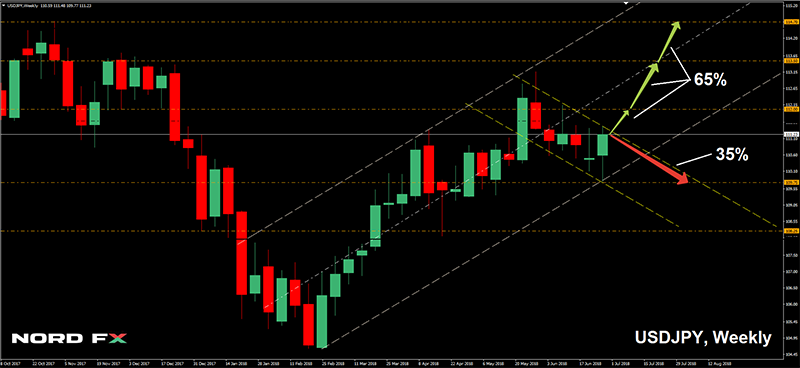
Meanwhile, the regulator continues the stimulating policy of negative rates and large-scale buying up of assets. Against this background, even despite the US-China trade wars and other US problems, the dollar may continue its growth. At least that's what 65% of experts think, indicating 112.00, 113.50 and 114.70 as targets.
An alternative point of view is represented by 35% of analysts, graphical analysis on D1 and 20% of oscillators giving signals that the pair is overbought. If this bearish scenario gets a continuation, the pair is expected to go down to the area of 109.75-110.10. The nearest support is 110.75;
Cryptocurrencies. Both bitcoin and major altcoins are close to their lows, and the crisis of confidence in the sector and the lack of positive news impedes the development of a strong bullish impulse. Although, as we noted earlier, such news most often does not entail any serious economic consequences and are only a reason for the next speculation.
The targets for the BTC/USD are the same. The target for the bulls is taking the height of $6,850, and then $7,760, for the bears it is to break the support of $6,230, then $6,000 and to go down to a low of $5,760. A fall below this mark may become a strong signal for a massive sell-off of cryptocurrencies and lead to a complete market collapse. And this is against the interests of all its participants, even those who are currently playing on the decline. Therefore, if the breakdown occurs, it is likely to be short-lived, and the pair will again return to the zone above $6,000. Although some analysts predict a drop to the level of $4,700.
And now, here is news for super-optimists and long-term investors, who are prepared to keep bitcoin until complete victory. The Telegram Channel What's on Crypto noted that after each halving of the mining award, the bitcoin price increased by dozen times. At the first reduction of fees on November 28, 2012, the pair BTC/USD traded at $12.With the second reduction on July 9, 2016, the rate was about $657. The third decline (from 12.5 BTC to 6.25 per block) should occur in the middle of 2020 and, if the forecast goes right, by 2023 the rate of this cryptocurrency can reach $10 million per coin. Whether it is true or not, we will learn "soon" - it's "only" about five years to wait.
EUR/USD Weekly Outlook
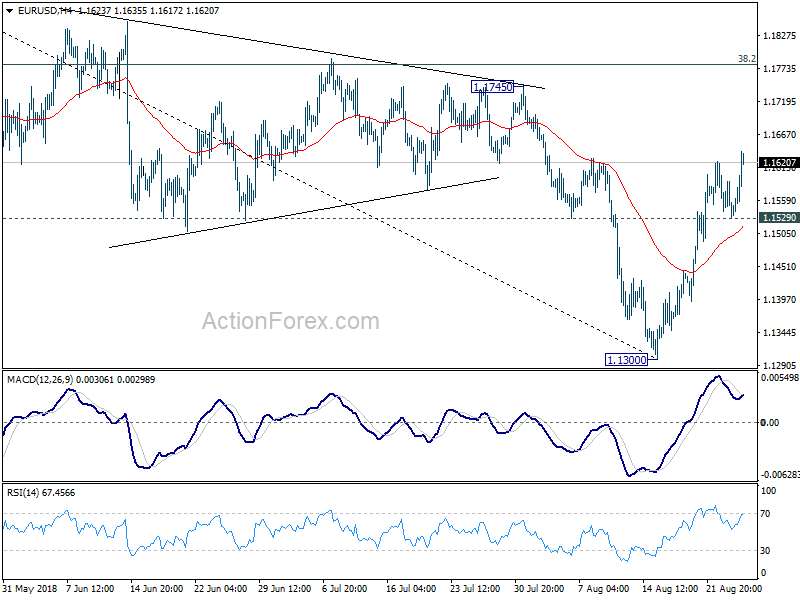
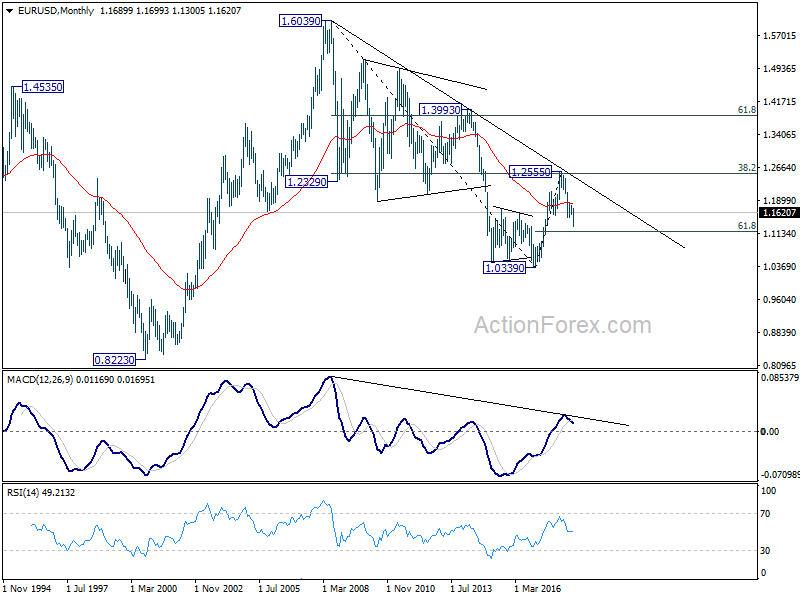
EUR/USD rebounded to as high as 1.1639 last week. The break of medium term channel resistance, with bullish convergence condition in daily MACD, suggests medium term bottoming at 1.1300. Initial bias is on the upside this week for 38.2% retracement of 1.2555 to 1.1300 at 1.1779. We'd expect upside to be limited there, at least on initial attempt, to bring near term reversal. On the downside, below 1.1529 minor support will turn bias back to the downside for retesting 1.1300 low. But after all, consolidation from 1.1300 will extend for a while before completion.
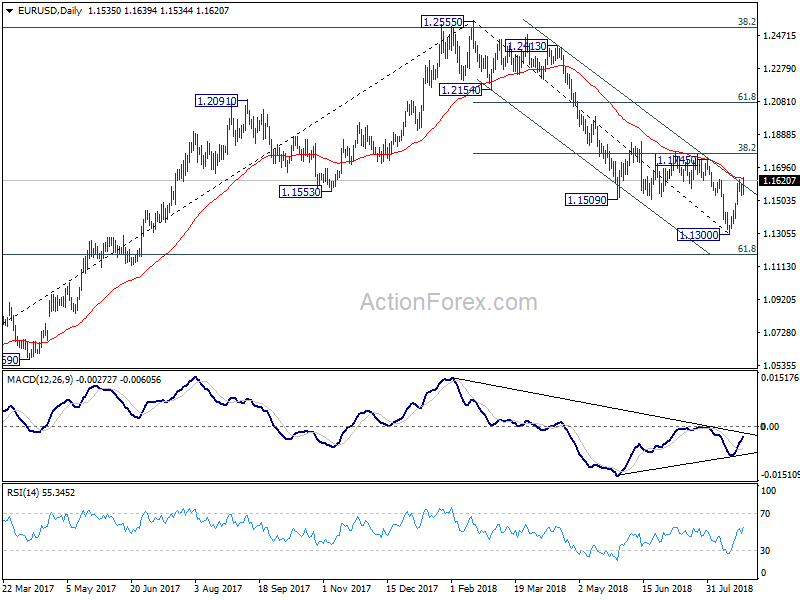
In the bigger picture, a medium term bottom should be in place at 1.1300 and some consolidations would be seen. But still, note that EUR/USD was rejected by 38.2% retracement of 1.6039 (2008 high) to 1.0339 (2017 low) at 1.2516. That carries some long term bearish implications. Thus, we'd expect fall from 1.2555 high to resume after consolidation completes. Below 1.1300 should send EUR/USD through 61.8% retracement of 1.0339 to 1.2555 at 1.1186. And, in that case, EUR/USD would head to retest 1.0339 (2017 low).
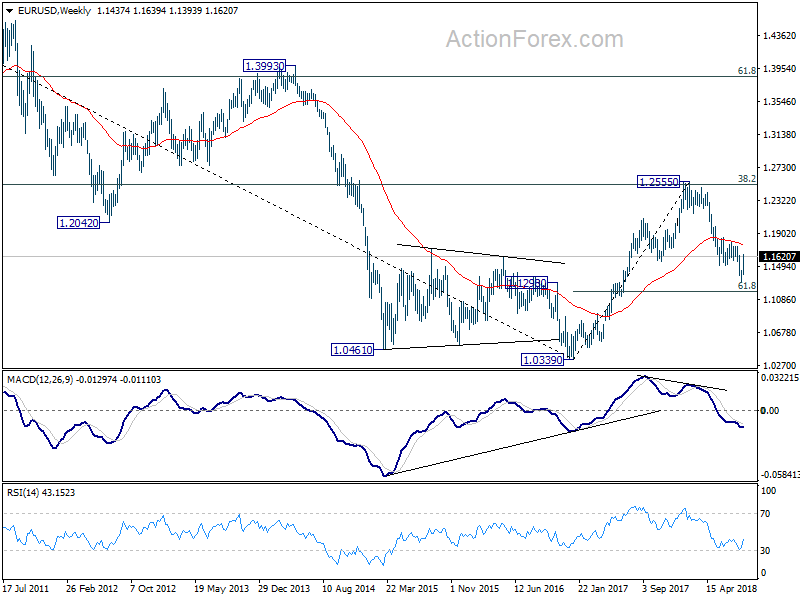
In the long term picture, the rejection from 38.2% retracement of 1.6039 to 1.0339 at 1.2516 argues that long term down trend from 1.6039 (2008 high) might not be over yet. EUR/USD is also held below decade long trend line resistance. Sustained trading below 55 week EMA adds bearishness to the case. Firm break of 61.8% retracement of 1.0339 to 1.2555 at 1.1186 should at least bring a retest on 1.0339 low.
USD/JPY Weekly Outlook
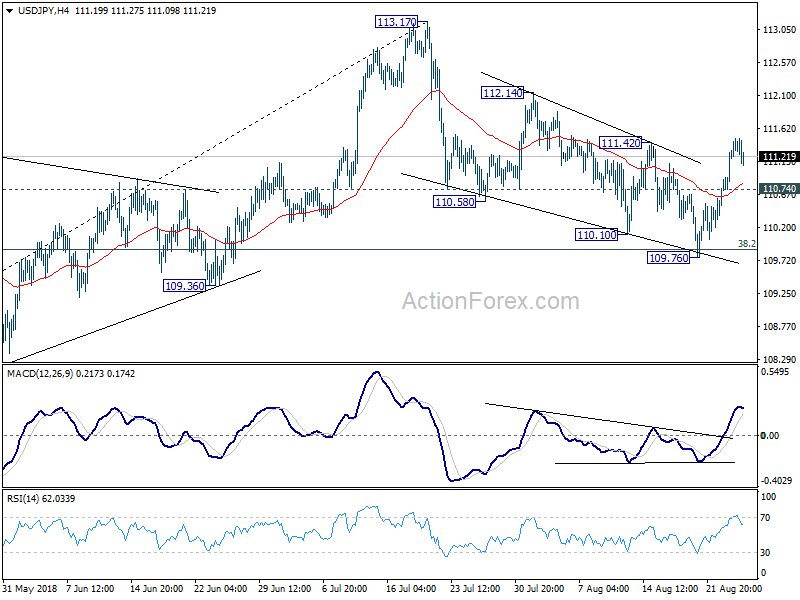
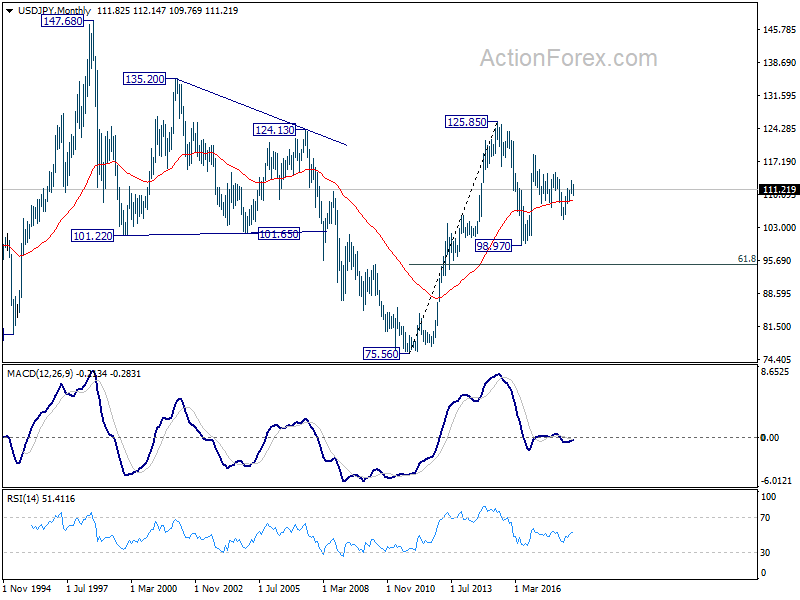
Despite dipping to 109.76 last week, USD/JPY drew solid support from 38.2% retracement of 104.62 to 113.17 at 109.90 and rebounded. break of 111.42 suggests that correction from 113.17 has completed at 109.76 already. Initial bias stays mildly on the upside this week for 112.14 first. Break will target a test on 113.17 high. Meanwhile, below 110.74 minor support will dampen the bullish case and turn focus back to 109.76 instead.
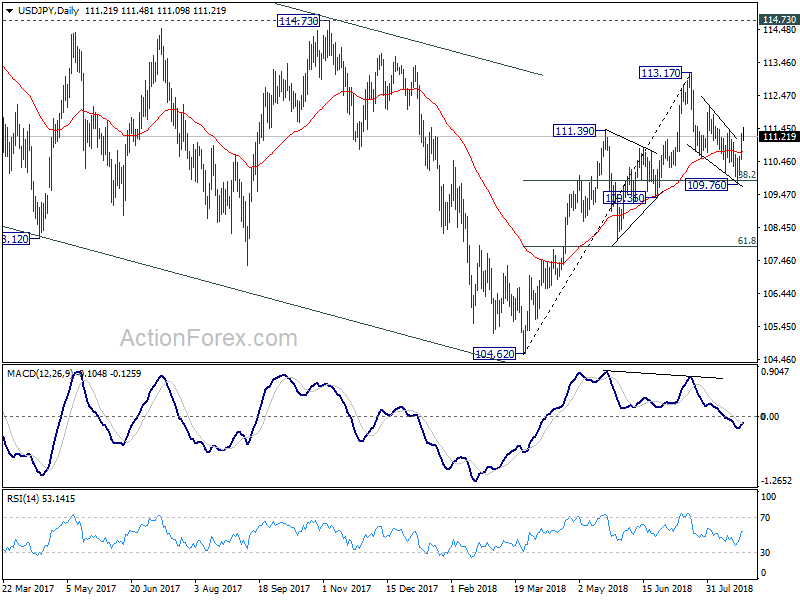
In the bigger picture, corrective fall from 118.65 (2016 high) should have completed with three waves down to 104.62. Decisive break of 114.73 resistance will likely resume whole rally from 98.97 (2016 low) to 100% projection of 98.97 to 118.65 from 104.62 at 124.30, which is reasonably close to 125.85 (2015 high). This will stay as the preferred case as long as 109.36 support holds. However, decisive break of 109.36 will mix up the outlook again. And deeper fall should be seen back to 61.8% retracement of 104.62 to 113.17 at 107.88 and below.
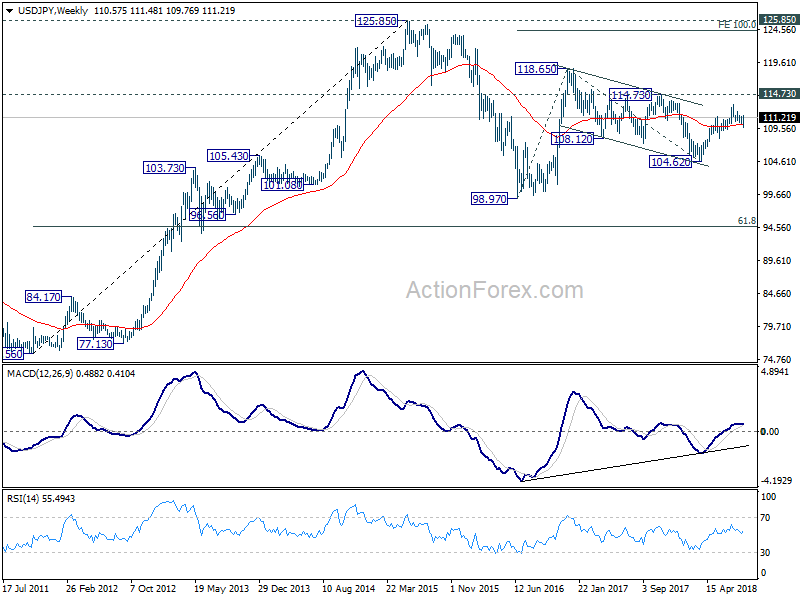
In the long term picture, the rise from 75.56 (2011 low) long term bottom to 125.85 top is viewed as an impulsive move, no change in this view. Price actions from 125.85 are seen as a corrective move which could still extend. In case of deeper fall, downside should be contained by 61.8% retracement of 75.56 to 125.85 at 94.77. Up trend from 75.56 is expected to resume at a later stage for above 135.20/147.68 resistance zone.
GBP/USD Weekly Outlook
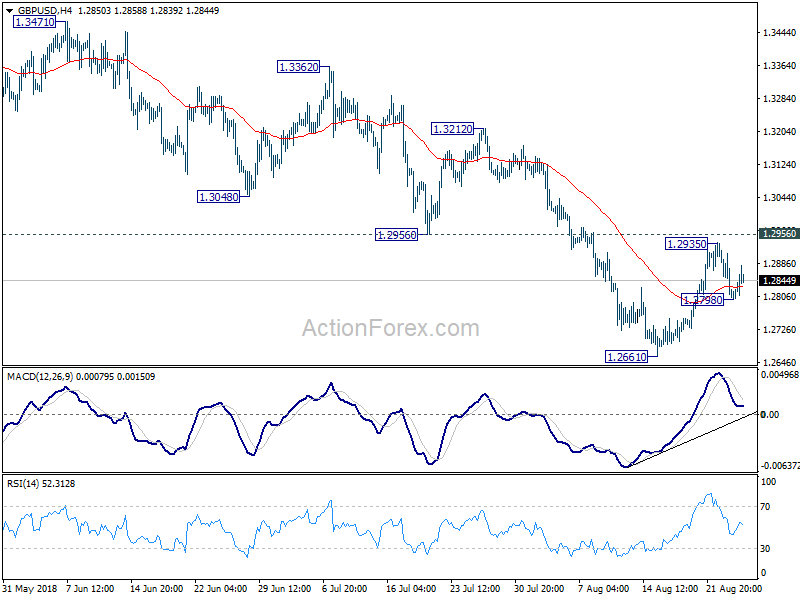
GBP/USD's strong rebound last week suggests short term bottoming at 1.2661. As upside was limited below 1.2956 support turned resistance, near term outlook stays bearish. Below 1.1798 minor support will target 1.2661 low first. Break will resume larger fall from 1.4376. However, considering bullish convergence condition in daily MACD, break of 1.2956 will indicate medium term bottoming. And stronger rebound would be seen back to 55 day EMA (now at 1.3074) and above.
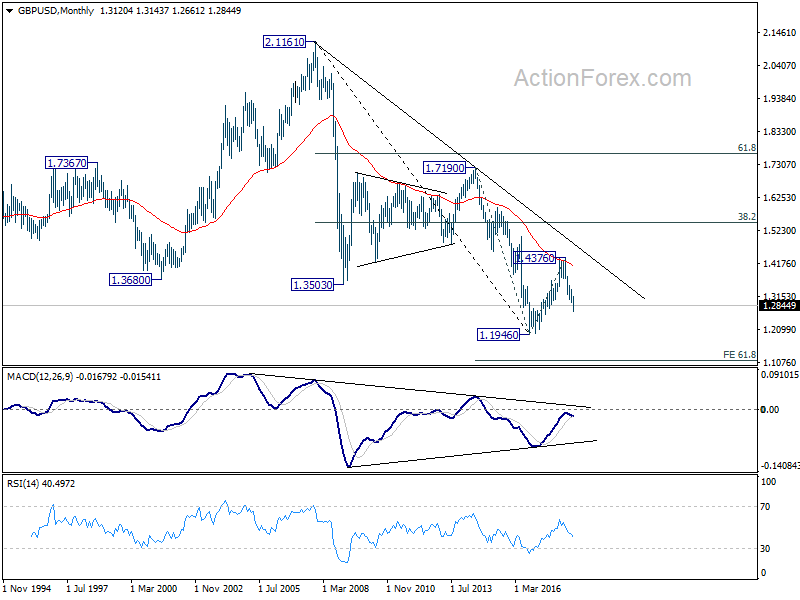
In the bigger picture, whole medium term rebound from 1.1946 (2016 low) should have completed at 1.4376 already, after rejection from 55 month EMA (now at 1.4091). Current downside acceleration argues that it's possibly resuming long term down trend. In any case, outlook will stay bearish as long as 38.2% retracement of 1.4376 to 1.2661 at 1.3316 holds. Retest of 1.1946 should be seen next.
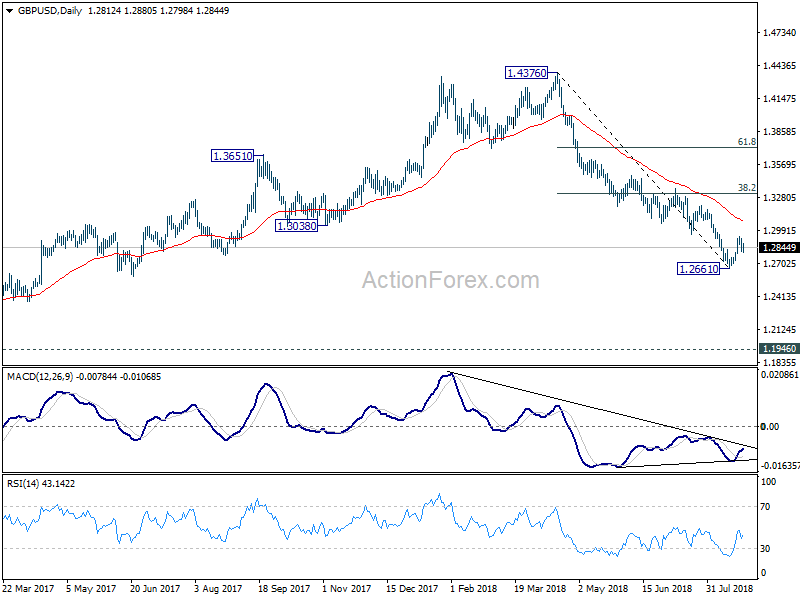
In the longer term picture, outlook in GBP/USD is held bearish. Rebound from 1.1946 was rejected solidly by falling 55 month EMA. The pair was limited well below 38.2% retracement of 2.1161 (2007 high) to 1.1946, as well as the decade long falling trend line. On break of 1.1946, next target will be 61.8% projection of 1.7190 to 1.1946 from 1.4376 at 1.1135.