Sample Category Title
UK CPI rose to 2.5%, core CPI unchanged at 1.9%, Sterling steady
Sterling is steady after consumer inflation data met expectations.
UK headline CPI rose to 2.5% yoy in July , up from 2.4% yoy and met expectation.
Core CPI was unchanged at 1.9% yoy, met expectation.
RPI, however, slowed notably to 3.2% yoy, down from 3.4% yoy and missed expectation of 3.6% yoy.
PPI input rose to 10.9% yoy, up from 10.3% yoy, above expectation of 10.8% yoy.
PPI output slowed to 3.1% yoy, down from 3.3% yoy and missed expectation of 3.2% yoy.
PPI output core dropped to 2.2% yoy, down from 2.4% yoy, missed expectation of 2.2% yoy.
House price index slowed to 3.0% yoy in June, slowed from 3.5% yoy, above expectation of 2.8% yoy.
Demand For The US Dollar Is Still HIgh
Yesterday, the US currency continued to strengthen against the basket of major currencies. The US dollar index (#DX) closed in the positive zone (+0.31%). Demand for the US currency is still high. The Turkish lira has begun to cover losses after the conflict with the US. The Central Bank of Turkey provided a list of measures to prevent a financial crisis in the country.
The British pound weakened after the publication of weak reports on the UK labor market. The average wage level, taking into account bonuses, slowed down to 2.4% in June, while experts expected 2.5%. The number of jobless claims rose to 6.2K instead of the forecasted value of 3.8K in July. Also, the value for June was revised from 7.8K to 9.0K. At the same time, the unemployment rate fell from 4.2% to 4.0%. German ZEW economic sentiment index counted to -13.7 and was better than the forecasted value of -20.1.
The "black gold" prices are declining. At the moment, futures for the WTI crude oil are testing a mark of $66.85 per barrel. At 17:30 (GMT+3:00) data on the US crude oil inventories will be published.
Market Indicators
Yesterday, the bullish sentiment was observed in the US stock market: #SPY (+0.64%), #DIA (+0.46%), #QQQ (+0.63%).
At the moment, the 10-year US government bonds yield is at the level of 2.88%-2.89%.
The news feed on 2018.08.15:
Consumer price index in the UK at 11:30 (GMT+3:00);
Data on retail sales in the US at 15:30 (GMT+3:00).
EURUSD Monthly Support Retest Is Possible Only Above 1.1350
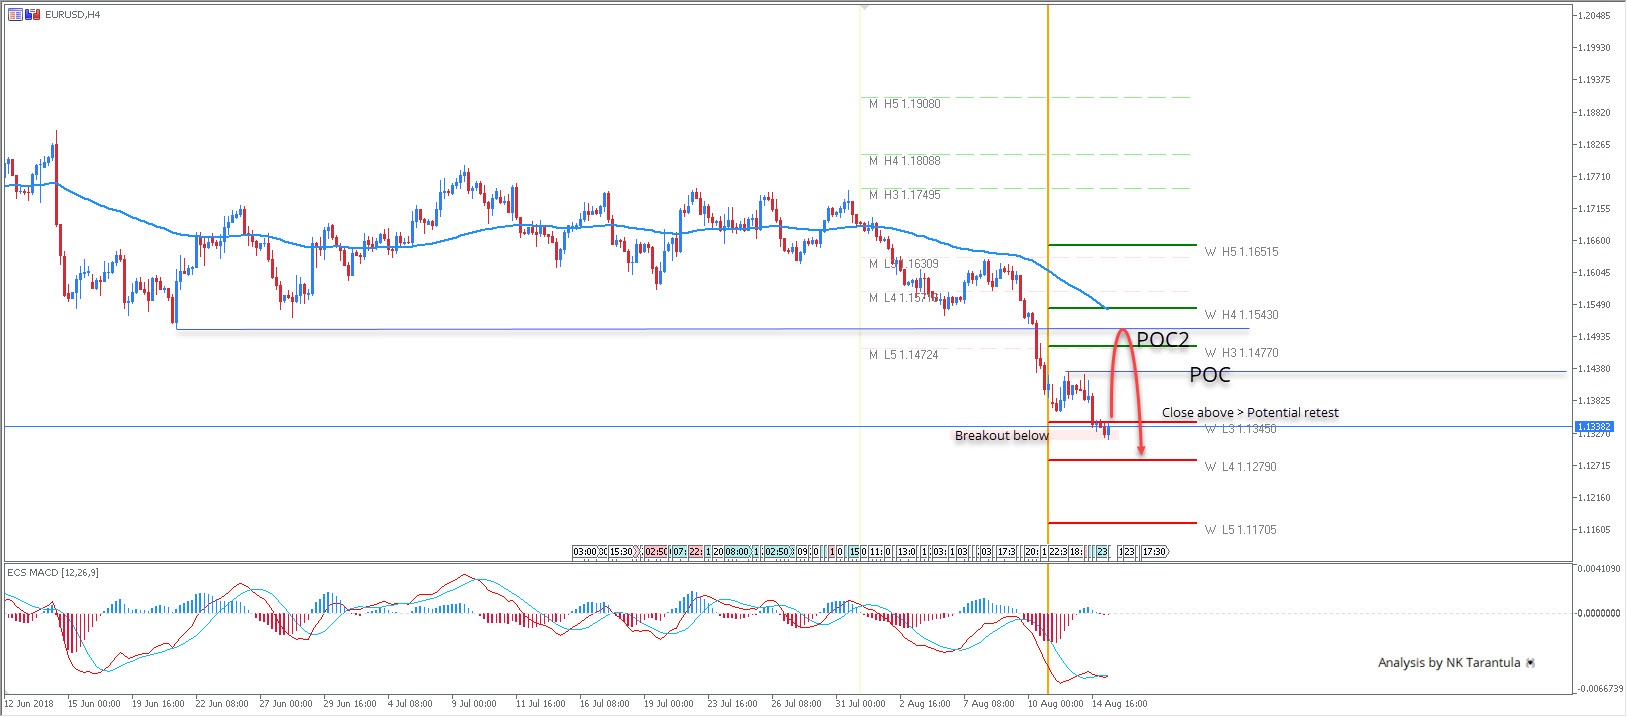
The EUR/USD dipped way below M L5 Pivot ( Strongest Monthly Support) and currently it is below the Weekly L3 pivot. This indicates a strong downtrend with a potential for further bearish pressure. Only a close above 1.1350 might initiate a bullish correction towards POC (1.1420-30) and POC 2 (1.1470-1.1508). However further weakness is likely as the price should reject from any of POC zones. Additionally a break below 1.1316 targets 1.1279, Weekly Support level. This breakout could happen even before any retracement to POC zones.
W L3 - Weekly Camarilla Pivot (Weekly Interim Support)
W H3 - Weekly Camarilla Pivot (Weekly Interim Resistance)
W H4 - Weekly Camarilla Pivot (Strong Weekly Resistance)
D H4 - Daily Camarilla Pivot (Very Strong Daily Resistance)
D L3 – Daily Camarilla Pivot (Daily Support)
D L4 – Daily H4 Camarilla (Very Strong Daily Support)
POC - Point Of Confluence (The zone where we expect price to react aka entry zone)
Relief Rally In EM Currencies Temporary, USD Charges To New 2018 Highs
The relief rally that allowed emerging market currencies to regain their composure after a very nervous reaction from investors to the Turkish Lira crisis appears to have been temporary. The majority of emerging market currencies across Asia are trending lower at time of writing, as the political dispute between Turkey and the United States heats up and the US Dollar charges to another milestone high for 2018. The softness in the emerging market currencies will likely spread into the EMEA region when European markets open today and possibly Latin America FX when Wall Street opens this afternoon.
The only real exception to the weakness in the emerging market FX space in Asia has been the Indian Rupee, which is marginally higher against the US Dollar after hitting a new all-time low earlier in the week. When you consider that the Dollar is charging ahead against the majority of its counterparts after reaching another 2018 high, suspicions will be present in the market that the Reserve Bank of India (RBI) might have intervened in the FX market to strengthen the Indian Rupee. Bank Indonesia (BI) have only moments ago raised interest rates in an effort to defend the Indonesian Rupiah from further weakness. Previous attempts from BI to change monetary policy have previously been rejected by investors, mostly because of the continued USD buying drive.
Elsewhere, the Turkish Lira continues to rapidly seesaw in momentum, but appears on track to be attempting its third successive day of gains against the US Dollar after the Turkish Lira crisis attracted the world’s attention. The gains in the Lira have come in spite of Turkey increasing tariffs on imports across a range of different US products. It will be interesting to monitor whether a potential response to this from the Trump administration later down the line rattles the markets.
The escalation of both diplomatic and trade tensions between the United States and Turkey has reminded investors that it is not just the United States and China that stand at the heart of the global trade war concerns. There are many other economies across the globe that feel aggravated by the protectionist nature of the Trump administration.
One question that is emerging across the headlines for investors to take into accountas the Dollar hits another high for 2018 is - exactly how long can the Dollar rally continue? A stronger Dollar is the opposite of what the Trump administration wants to see, and there is an argument to be made that it offsets both the fiscal stimulus that Trump has encouraged alongside the protectionist policies as the price of imports into the United States increases.
I would be very surprised if President Trump himself doesn’t repeat his discontent with USD strength in the near future.
Markets Decline Resumes, Dollar Updates Its 13-Month Highs
The strengthening of financial markets on Tuesday has not been unsustainable and prolonged. Recent shots in the U.S. trade conflicts are: a China’s claim to the WTO about US tariffs on renewable energy imports and subsidies to their own producers; Turkey has put obstruction duties on a number of goods from the United States, including passenger cars, and has announced a boycott of American electronics.
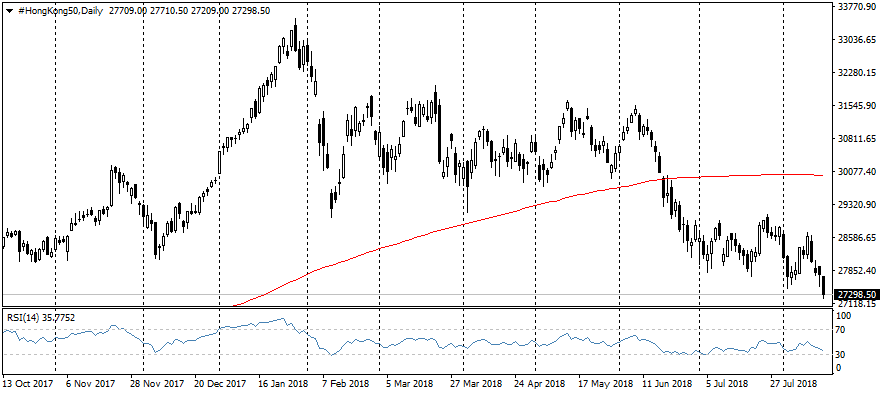
On Wednesday morning, the markets are again under pressure on new episodes of U.S. trade conflicts. Again, at the epicentre of the fall are the Asian exchanges as MSCI lost 0.8% and Hong Kong’s Hang Seng fell by 1%.
At the same time, we saw almost an uninterrupted demand for dollars in the currency market. Despite yesterday’s rollback at the stock exchanges, the U.S. currency continued to strengthen its main competitors. The dollar index added 0.4% on Tuesday, and continues strengthening on Wednesday morning adding another 0.1% and trading at the level of 13-month highs. 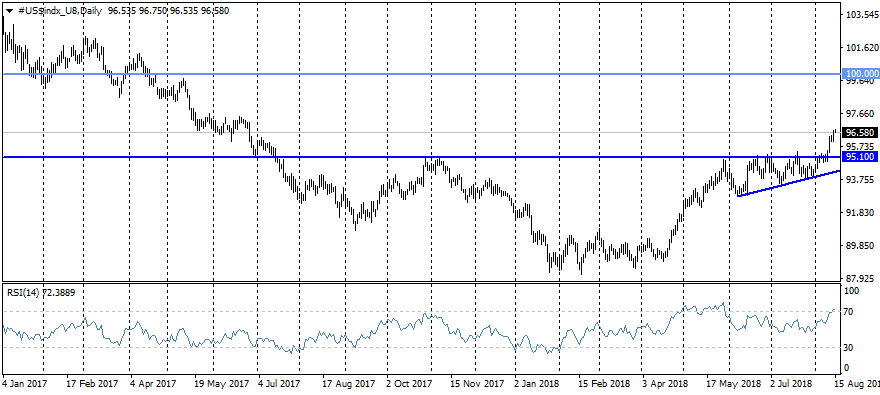
EURUSD sank to 1.1320 in the morning, having lost more than 2.5% over the past week when the pair traded above 1.1600. The sales in pairs intensified after the exit from the trading range since May on fears around the stability of the eurozone banking sector against the backdrop of Turkey’s problems. Cravings in dollars can be saved for the next few days against the wave of stop-orders. The goals of bears in EURUSD pair in the course of the current impulse decline may become 1.1150, the levels of previous local lows. The longer-term targets for the next months could become the levels around 1.04, at which the pair had traded in early 2017. 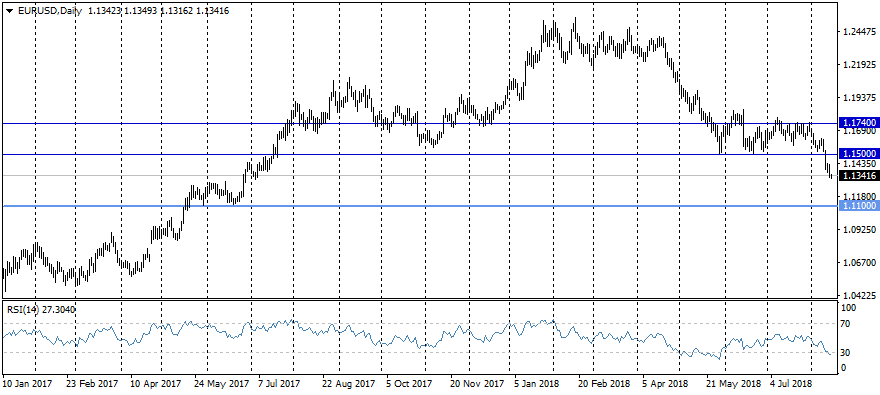
Sterling also continues its falling, dropping to 1.2700 on Wednesday morning. Here the nearest local lows are the levels of 1.2630, the capture of which opens the way to 1.21 – to the global lows after Brexit.
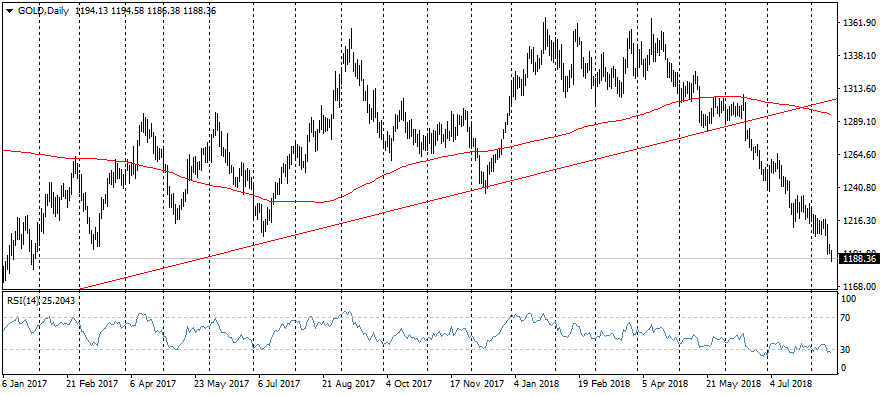
The gold is keeping its way down. In the morning, it rewrote the lows of January 2017, dropping to $1186 per ounce. Amid the growth of the dollar and the fears of problems in key consumer markets for this metal (China, Turkey), the gold has yet sought support unsuccessfully
Since the situation with trade and diplomatic conflicts between the United States and other countries is far from being resolved and is only gaining momentum, the craving for dollars can also be intensified. Perhaps, the most significant risk for the dollar may be another verbal intervention of Trump against the strengthening of the dollar. It is impossible to exclude changes in the rhetoric of the Fed policymakers. In previous years, weakening in the foreign markets forced FOMC under chair Yellen to review its plans for the tightening the policy. We have to see if the Fed’s views would be reconsidered under Powell’s administration.
Bitcoin Meltdown: Fake Alarms Or Real Concerns
- Traders have been waiting for the bull rally since early June
- Investors are losing hope for a bull run
- The Bitcoin price may form a bottom in Q3
There was only one dominant colour for cryptocurrencies, it was red. The crypto king, Bitcoin dropped below the $6,000 mark yesterday (back above that vital level today with a gain of 4.64%, last price, $6,310). However, there are some serious concerns that we may actually make another new low for the year because of the sturdy bearish sentiment. Bitcoin is down nearly 55% year to date and it is down -66% from its all-time high.
Traders have been waiting for the bull rally since early June, although there have been two different occasions where we have seen the price action showing some serious strength, but in actual reality, bears have shown their brutal strength over the bulls.
The first bullish signal for the bitcoin price came fairly recently on the back of the speculations that the SEC (U.S. Securities and Exchange Commission) may approve the first Bitcoin ETF (Exchange Traded Fund). The price moved all the way to $8,230 but it failed to break above the $10,000, a major key level for the bulls. The second strong signal came back in early May this year when the price confirmed the bull strength and made a high of $9,734 however it failed to break above the key resistance of $10,000.
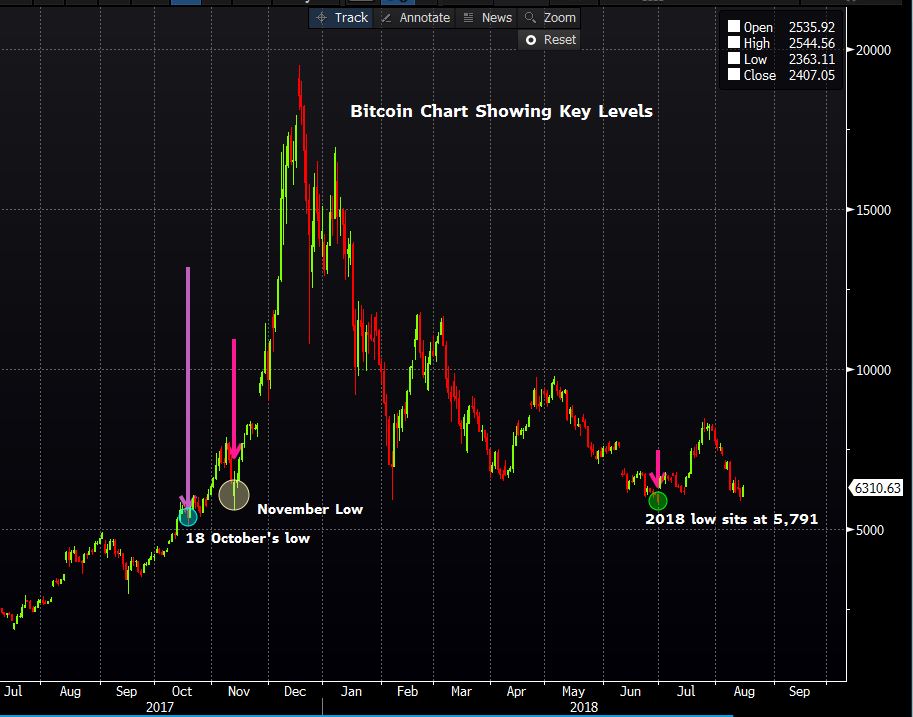
The only reason that we are seeing the cryptocurrencies selling off so badly is that traders are losing hope of a bull run. Yes, we are back above the key level of $6,000, but as long as the price keeps on having a stab at the lows of this year $5,791, we are not out of woods.
It is true that the actual bull run starts from September or October (looking at the previous year chart) and we still have time for that, however, the expectations have been that price may form its bottom in the Q2 of this year and from there onwards, it is only green light for Bitcoin. However, we are in the third quarter of this year and it appears that the price may be looking to form some sort of bottom during this quarter. Hopefully, the current sell-off would mark the bottom for the Bitcoin price.
So just how far the current move can extend to? Speaking from a technical perspective, there are some important key levels which I am watching carefully. If the downtrend continues, the following are the key levels:
November 13th low: $5,605
October 18th low: $5,109
Psychological level: $5,000
As of today, the Bitcoin has broken yesterday's high of $6,298, so there is a possibility that we may just have a false alarm and the price may not form another new low for 2018. If that happens, then there is a strong hope for the bull run continue for this year.
Euro-Zone’s 2Q GDP Growth Revised Higher From The Initial Estimate
For the 24 hours to 23:00 GMT, the EUR declined 0.50% against the USD and closed at 1.1349.
Data indicated that the Euro-zone's seasonally adjusted flash gross domestic product (GDP) advanced 0.4% on a quarterly basis in 2Q 2018, more than the initial estimate of 0.3% and beating market expectations for a rise of 0.3%. In the previous quarter, GDP had recorded a similar rise. On the other hand, the region's seasonally adjusted industrial production retreated 0.7% on a monthly basis in June, driven by a collapse in machinery and equipment investment and more than market expectations for a drop of 0.4%. In the prior month, industrial production had recorded a revised climb of 1.4%. Meanwhile, the economic sentiment index improved to -11.1 in August, compared to a reading of -18.7 in the prior month.
Separately, in Germany, seasonally adjusted preliminary gross domestic product (GDP) rose 0.5% on a quarterly basis in 2Q 2018, driven by consumption and state spending and beating market expectations for a rise of 0.4%. In the prior quarter, GDP had recorded a revised rise of 0.4%. Moreover, the nation's final consumer price index (CPI) climbed 2.0% on an annual basis in July, in line with market expectations and confirming the preliminary print. In the previous month, the consumer price index had climbed 2.1%.
Additionally, in Germany, the ZEW economic sentiment index surged to a level of -13.7 in August, compared to a level of -24.7 in the prior month. Further, the current situation index unexpectedly rose to a level of 72.6 in August, defying market expectations for a fall to a level of 72.1. In the prior month, the index had registered a level of 72.4.
In the US, data showed that US small business optimism index surprisingly advanced to a level of 107.9 in July, following market expectations for a decline to a level of 106.8. The index had registered a level of 107.2 in the previous month.
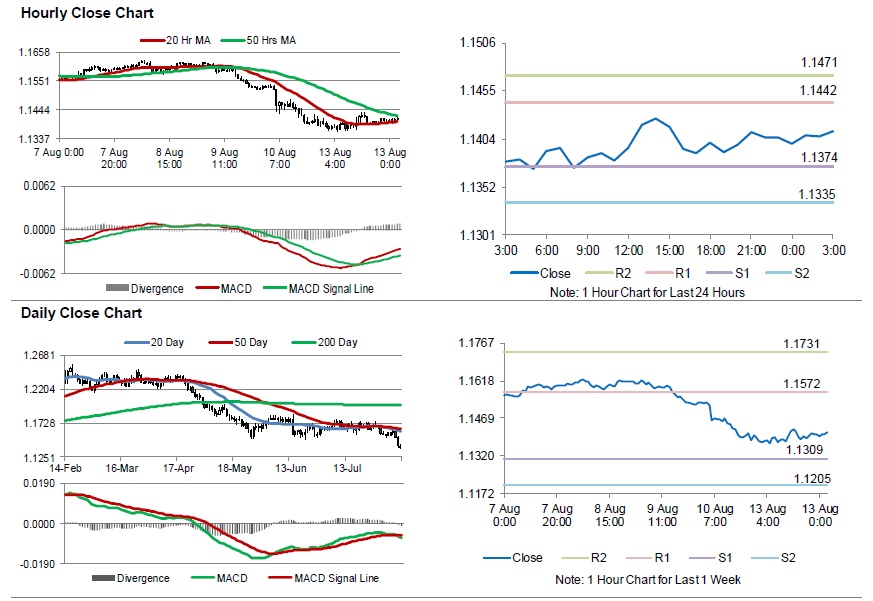
In the Asian session, at GMT0300, the pair is trading at 1.1325, with the EUR trading 0.21% lower against the USD from yesterday's close.
The pair is expected to find support at 1.1290, and a fall through could take it to the next support level of 1.1256. The pair is expected to find its first resistance at 1.1394, and a rise through could take it to the next resistance level of 1.1464.
Amid no major economic releases in the Euro-zone today, investor would focus on the US MBA mortgage applications followed by retail sales, industrial production, manufacturing production and capacity utilisation, all for June, slated to release later in the day. Additionally, the NY Empire State manufacturing index and the NAHB housing market index, both for August, along with business inventories for June, will keep investors on their toes.
The currency pair is trading below its 20 Hr and 50 Hr moving average.
Britain’s Unemployment Rate Unexpectedly Fell To A New 43-Year Low In 2Q
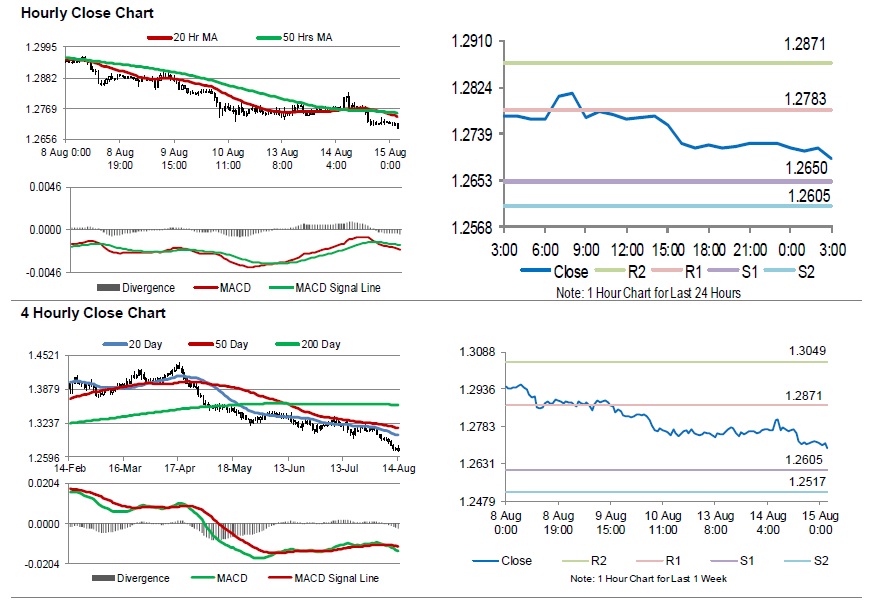
For the 24 hours to 23:00 GMT, the GBP declined 0.37% against the USD and closed at 1.2720.
On the data front, UK's ILO unemployment rate unexpectedly fell to a rate of 4.0% in the April-June 2018 period, marking its lowest rate since February 1975. In the March-May 2018 period, the ILO unemployment rate had recorded a reading of 4.2%. Average earnings including bonus rose 2.4% on an annual basis in the April-June 2018 period, undershooting market expectations for a rise of 2.5%. Average earnings rose 2.5% in the March-May 2018 period. Meanwhile, claimant count rate remained steady at 2.5% in July.
In the Asian session, at GMT0300, the pair is trading at 1.2694, with the GBP trading 0.20% lower against the USD from yesterday's close.
The pair is expected to find support at 1.2650, and a fall through could take it to the next support level of 1.2605. The pair is expected to find its first resistance at 1.2783, and a rise through could take it to the next resistance level of 1.2871.
Moving ahead, all eyes would be on UK's consumer price index, producer price index, retail price index, all for July, slated to release in a few hours.
The currency pair is trading below its 20 Hr and 50 Hr moving averages.
Japanese Yen Trading On A Negative Footing This Morning
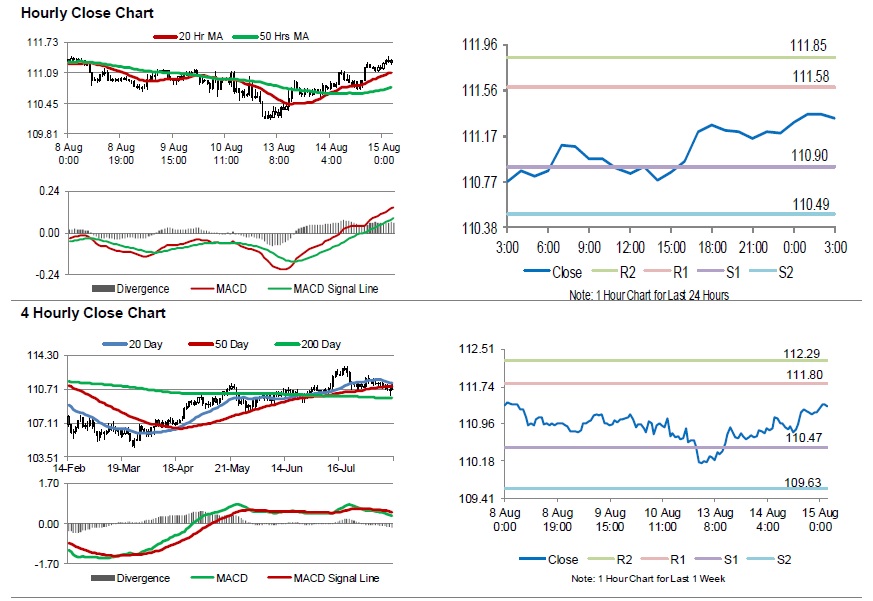
For the 24 hours to 23:00 GMT, the USD rose 0.35% against the JPY and closed at 111.19.
In the Asian session, at GMT0300, the pair is trading at 111.32, with the USD trading 0.12% higher against the JPY from yesterday’s close.
The pair is expected to find support at 110.90, and a fall through could take it to the next support level of 110.49. The pair is expected to find its first resistance at 111.58, and a rise through could take it to the next resistance level of 111.85.
Trading trend in the Japanese yen today is expected to be determined by the release of Japan’s trade balance data for July, due to be released overnight.
The currency pair is trading above its 20 Hr and 50 Hr moving averages.
Swiss Franc Trading Lower In The Morning Session
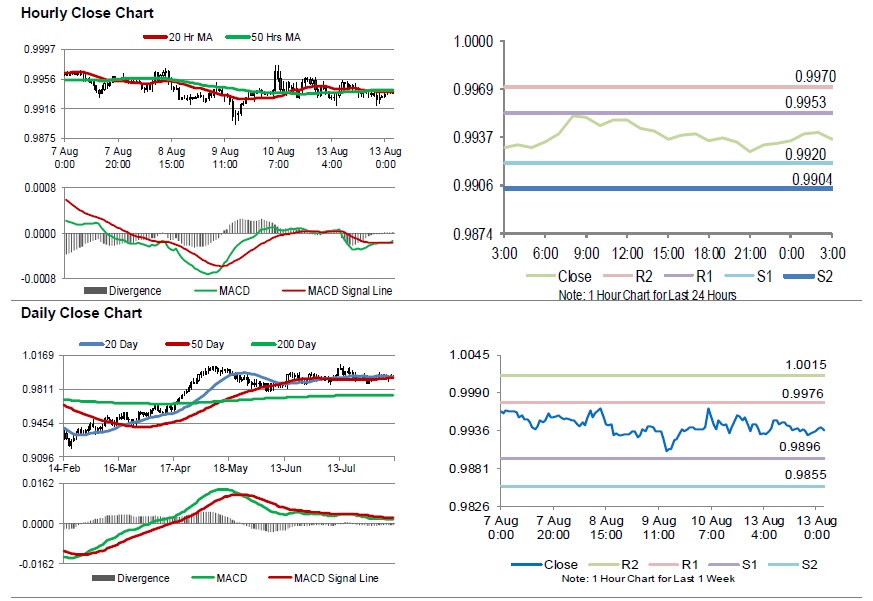
For the 24 hours to 23:00 GMT, the USD traded flat against the CHF and closed at 0.9940.
Macroeconomic news indicated that the producer and import price index climbed 3.6% on an annual basis in July, following a rise of 3.5% in the previous month.
In the Asian session, at GMT0300, the pair is trading at 0.9963, with the USD trading 0.23% higher against the CHF from yesterday’s close.
The pair is expected to find support at 0.9921, and a fall through could take it to the next support level of 0.9880. The pair is expected to find its first resistance at 0.9984, and a rise through could take it to the next resistance level of 1.0006.
With no macroeconomic releases in Switzerland today, traders will look forward to global macroeconomic events for further cues.
The currency pair is trading above its 20 Hr and 50 Hr moving averages.