Sample Category Title
European, US Data In The Spotlight On Wednesday
Economic data is back in the spotlight on Wednesday, with market-moving reports from both sides of the Atlantic scheduled for release. Currency traders are keeping close tabs on the US dollar, which rose on Tuesday to fresh yearly highs.
The United Kingdom will headline the European economic calendar on Wednesday. At 08:30 GMT, the Office for National Statistics will release three inflation gauges: consumer price index, producer price index and retail price index.
Shifting gears to North America, the US Department of Commerce will report on retail sales at 12:30 GMT. Receipts at retail stores are projected to rise 0.1% in July after climbing 0.5% the month before. Excluding automobiles, sales are projected to rise by 0.3%.
In a separate release, the Federal Reserve Bank of New York will release the Empire State Manufacturing Index for August. The monthly indicator is forecast to come in at 20.0 from 22.6 in July.
Forty-five minutes later, the Federal Reserve will release its monthly industrial production report. The July indicator is expected to show growth of 0.3%. Output at US factories climbed 0.6% in June.
At 14:00 GMT, Commerce will report on business inventories for June. Stockpiles likely rose 0.1% month-on-month, according to a median estimate of analysts.
EUR/USD
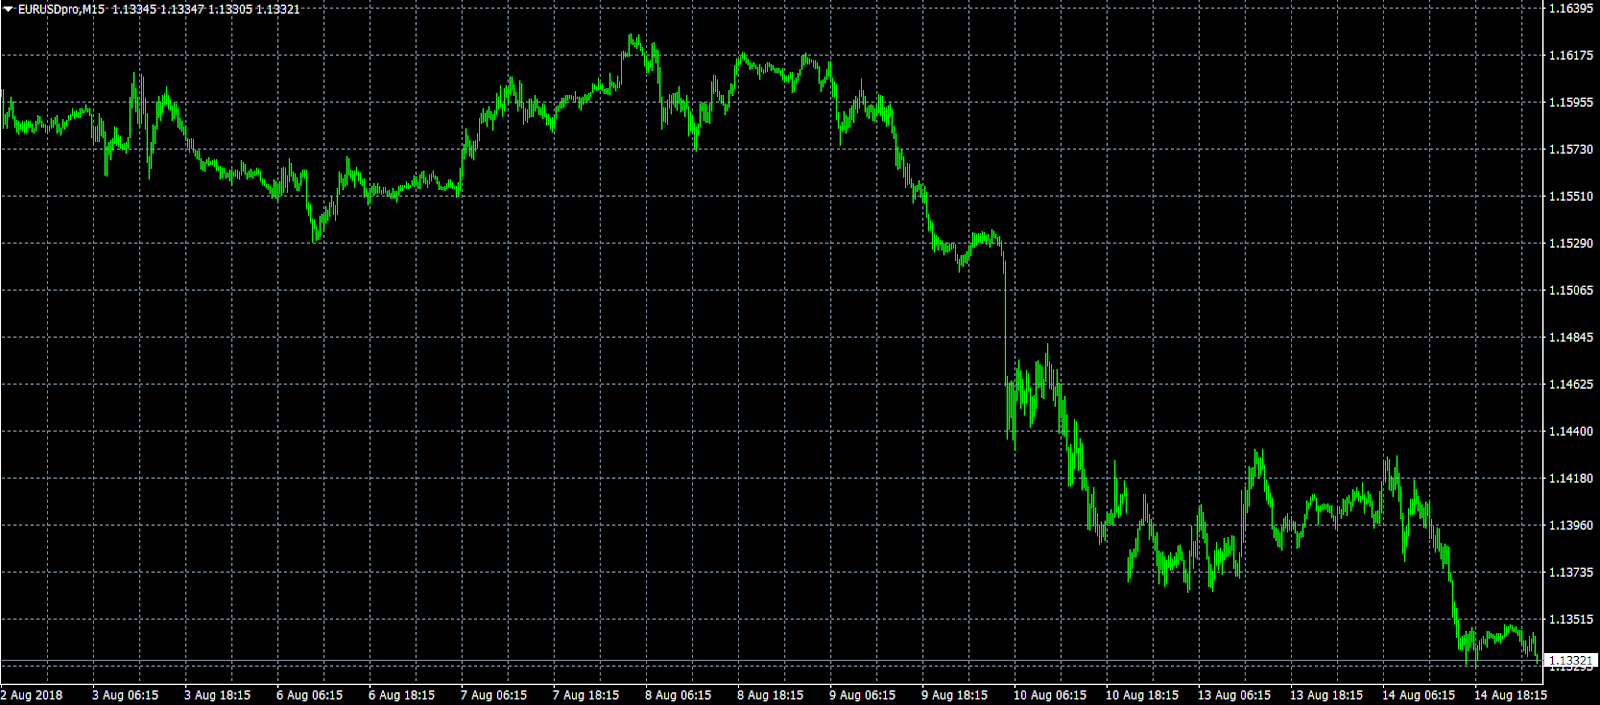
Europe's common currency plunged to fresh 2018 lows on Tuesday, as the dollar continued to assert its dominance on the global currency system. The EUR/USD exchange rate settled in the 1.1350 range on Tuesday and has since fallen to 1.1335. According to analysts at Danske Bank, further downside should not be ruled out, which means more yearly lows are likely over the short term. From a technical perspective, the pair is now eyeing immediate support at 1.1300. On the opposite side of the spectrum, immediate resistance is located at 1.1365, the low from Tuesday.
GBP/USD
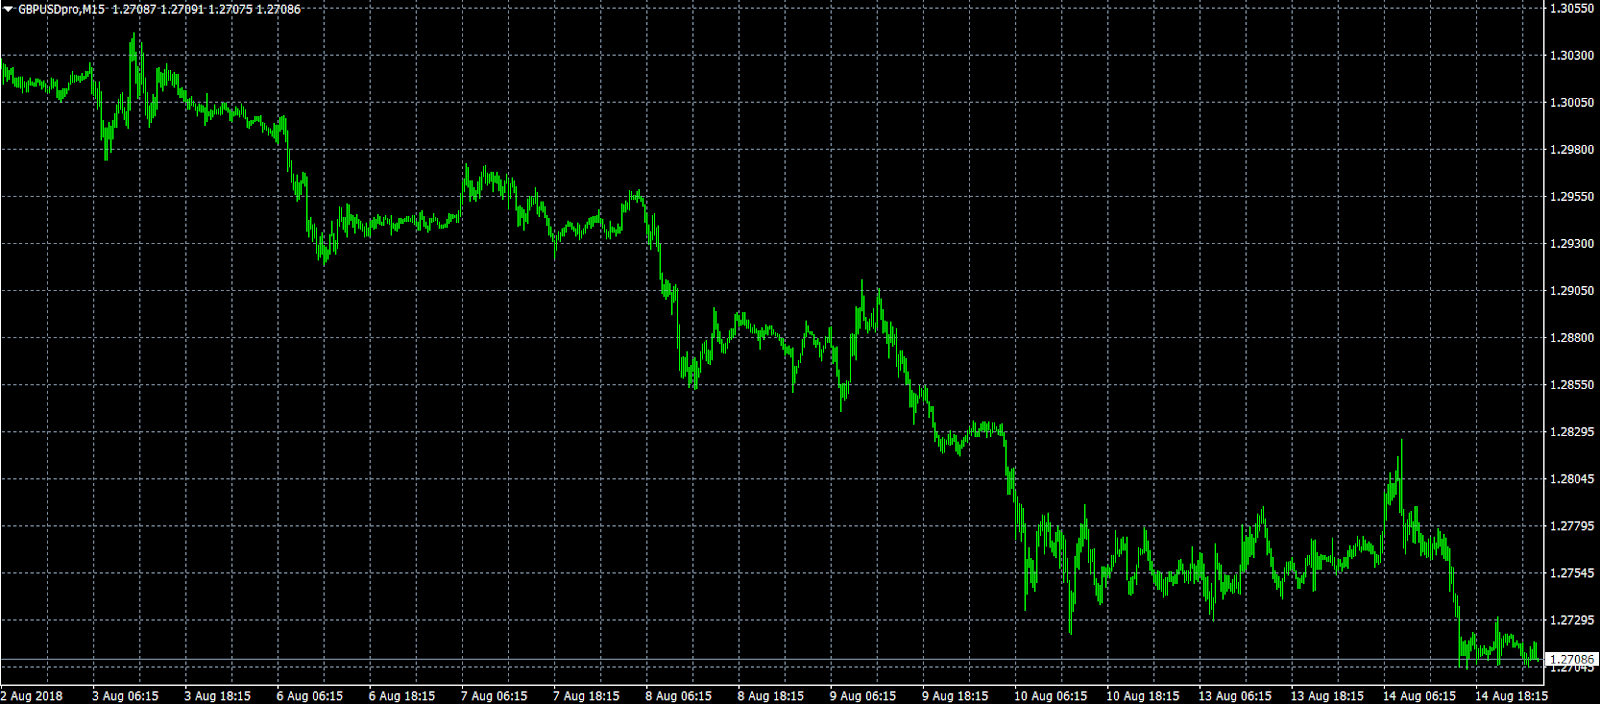
Cable also experienced a sharp selloff on Tuesday, as prices bottomed in the low 1.2700 range. GBP/USD was last seen trading at 1.12709, where it was down 0.1% from Tuesday's close. With the pair plumbing new 13-month lows, immediate support is located at the psychological 1.2700 level. Below that, the bears are eyeing 1.2640 as the next breaking point. On the opposite side of the ledger, immediate resistance is located at 1.2825, the high from Wednesday, followed by 1.2910.
USD/JPY
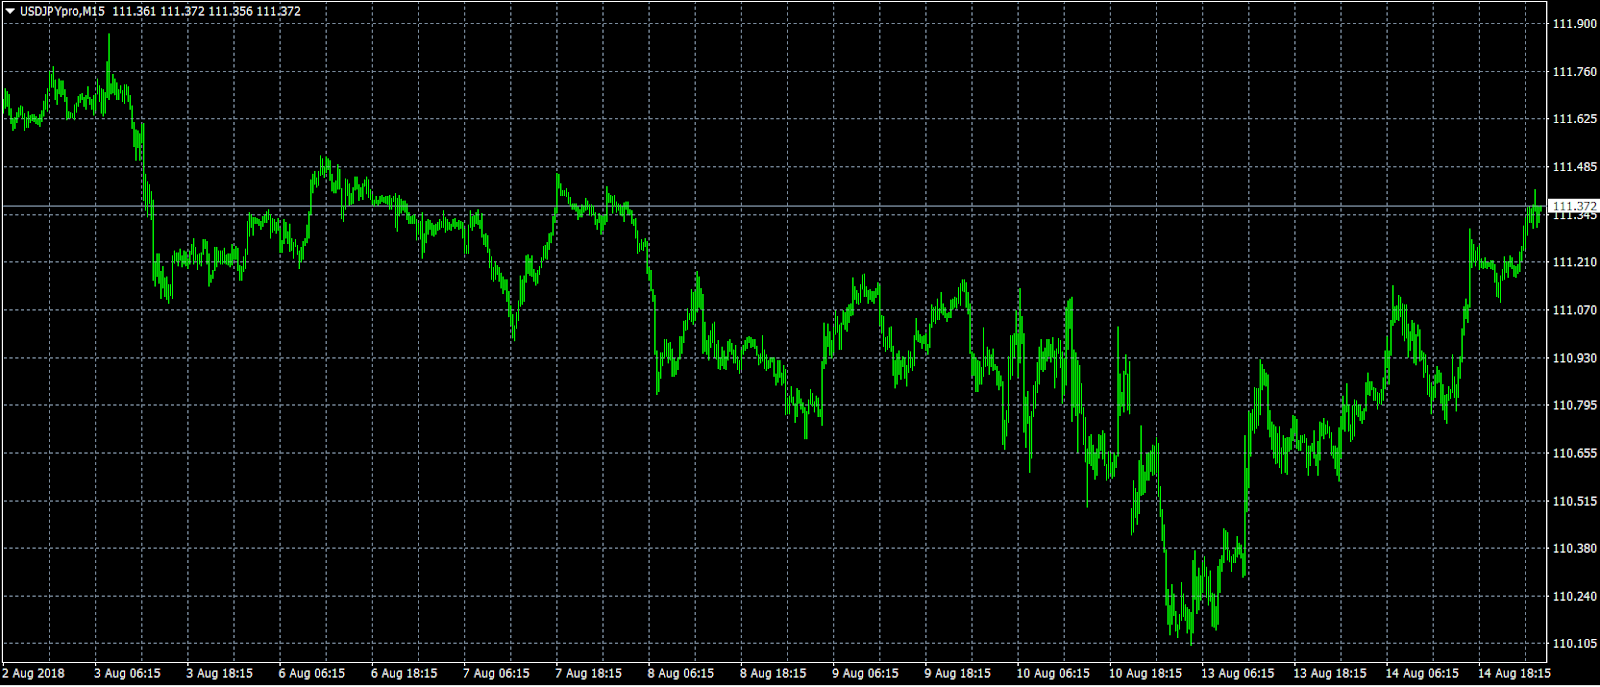
The dollar lost ground against the yen on Tuesday but has since recovered to trade at one-week highs. After bottoming at 110.19 on Tuesday, the USD/JPY exchange rate has recovered to 111.38. In terms of technical indicators, the pair faces immediate support at 111.00, followed by 110.58. USD/JPY is currently testing the 111.36 resistance, which corresponds to the 61.8% Fibonacci retracement. Above that level, 112.14 is the next major target.
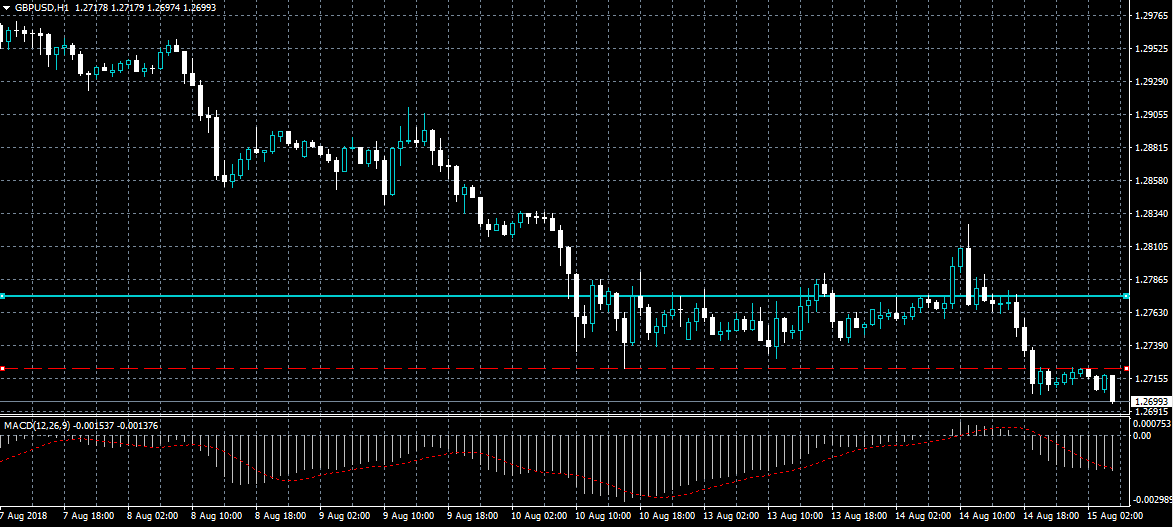
GBPUSD Strongly Bearish Below 1.2722 Level
The British pound has tumbled below the 1.2700 level against the greenback, as Brexit concerns and US dollar strength weigh on sterling. The GBP/USD has also fallen to a fresh 2018 trading low and retains a strong bearish bias while trading below the 1.2722 level. Sellers will likely target the 1.2650 support level while buyers need to stabilize price above the 1.2775 resistance level.
The GBPUSD pair is strongly bearish while trading below the 1.2722 level, key support is found at the 1.2650 and 1.2610 levels.
If the GBPUSD pair moves above the 1.2722 level, key intraday resistance is found at the 1.2740 and 1.2775 levels.
EURUSD Medium Term Seller Back In Control
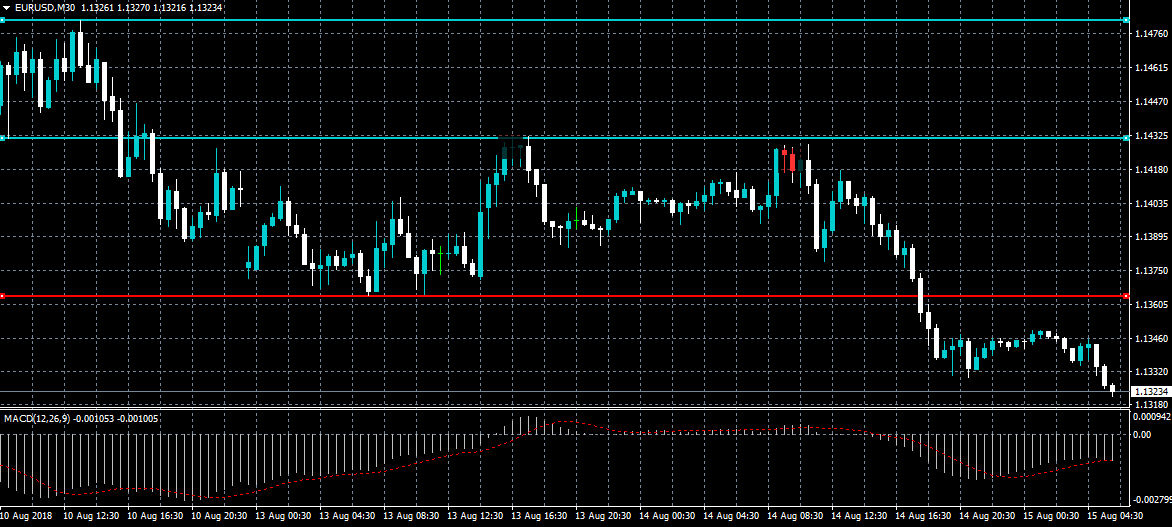
The corrective move higher in the EURUSD pair now appears over and sellers are targeting the 1.1300 level as the US dollar index soars towards to new 2018 trading highs. A bearish double-top price pattern is also putting further selling pressure on the EURUSD on Wednesday. If price breaks below the 1.1300 support level, heavy technical selling is expected towards the 1.1220 level.
The EURUSD pair is intraday bearish while trading below the 1.1365 level, key support is now found at the 1.1300 and 1.1220 levels.
If the EURUSD pair moves above the 1.1365 level key resistance is found at the 1.1400 and 1.1430 levels.
Ethereum Price Falls As Traders Abandon ICO Projects
It has been a difficult month for Ether, the currency of the Ethereum network. Month-to-date, the price of Ether has dropped by more than 40%. It is now trading at $277, which is slightly higher than yesterday’s low of $240. This was the lowest level since November last year.
Price drops have also been experienced across the crypto sector with Bitcoin plummeting to its lowest level since June and Litecoin falling to its lowest level since August last year. In total, the crypto market cap has dropped to about $190 billion. At its peak early this year, the combined market cap was more than $850 billion.
The current decline on the price of cryptocurrencies has primarily been caused by the ICO market. A report by crypto research company, Cinnober, said that the hundreds of companies that had raised billions of dollars in ICOs were cashing in by selling off the tokens. This has in turn led to an increased supply, which leads to lower prices. It also reduces the demand for ICO projects that are currently under development as traders avoid the market.
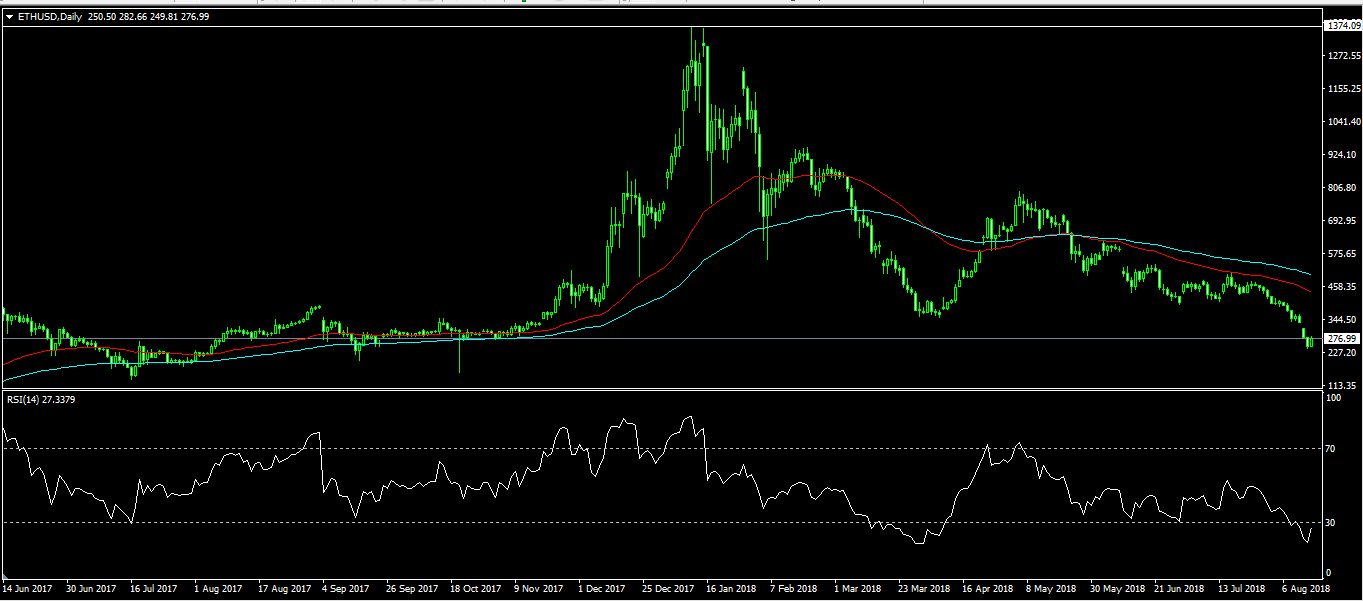
The ETH/USD pair created a double top in February when it reached an all-time high of $1374. Since then, the pair has been falling, reaching a year-to-date low of $245 yesterday. The pair’s price is below the 50 and 100-day moving average while its RSI is below the oversold level of 30. The pair is likely to continue falling and will likely test the support of $200 as traders dump Ethereum.
South Korea Moon: Relationship with North the driving force for denuclearization
South Korean President Moon Jae-in said today that the agreed summit with North Korea in September will be a further step towards denuclearization of the peninsula. The advancement in the relationship between the Koreas is the "driving force".
Moon pledged to take "take an audacious step to proceed toward the declaration of an end to the Korean War and the signing of a peace treaty as well as the complete denuclearization of the Korean peninsula."
He also emphasized that "when the deep-rooted distrust between the two Koreas and between the North and the United States is lifted, the mutual agreement can be implemented."
And, when peace is established, "economic cooperation can be carried out in earnest." The first step could be "unification economic zones" along border provinces.
China PBoC Continues To Not Drain Liquidity
General Trend:
- Asian equity markets trade mostly lower
- Shanghai and Hang Seng decline in early trade
- Tencent drops ahead of expected earnings report
- Metals and commodity currencies trade generally weaker
- US dollar trades generally firmer
- Chinese Yuan (CNY) fixed at the weakest level since May 2017
- China PBoC offers medium-term lending facility (MLF), skips daily OMO for the 19th straight session
- Australia July jobs data due for release on Thursday
Headlines/Economic Data
Australia/New Zealand
- ASX 200 opened +0.1%
- ASX 200 Resources index -1.7%, Energy -1.3%, Financials -0.5%; Utilities +1.1%
- (AU) Australia Q2 Wage Price Index Q/Q: 0.6% v 0.6%e; Y/Y: 2.1% v 2.1%e
- (AU) Australia Aug Westpac Consumer Confidence Index: 103.6 v 106.1 prior; M/M: -2.3% v 3.9% prior
- (AU) Australia sells A$1.0B in 2030 bonds, avg yield 2.6348%, bid to cover 3.2x
- (NZ) New Zealand to offer NZ$150M in April 2037 bonds on Aug 16th
China/Hong Kong
- Shanghai Composite opens -0.1%, Hang Seng -0.1%
- Hang Seng Materials index -3.9%, Services -3.3%, Info Tech -3.7%, Consumer Goods -2.7%, Utilities -2.4%, Industrial Goods -2.2%, Energy -2%, Property/Construction -1.9%, Financials -1.4%
- (CN) CHINA PBOC SETS YUAN REFERENCE RATE AT: 6.8856 V 6.8695 PRIOR (weakest CNY fix since May 12 2017)
- (CN) CHINA PBOC CONDUCTS CNY383B IN 1-YEAR MEDIUM-TERM LENDING FACILITY (MLF) V CNY502B PRIOR AT 3.30% V 3.30% PRIOR
- (CN) China Jul New Home Prices M/M: +1.1% v 1.1% prior; Y/Y: 5.8% v 5.0% prior (fastest rise since Sept 2017)
- (CN) China State Planner (NDRC) Spokesman: Reiterates there is no winner from trade war; Jan-July data showed limited impact on China's economy from trade frictions; Trade frictions will have negative impact on domestic economy
- (CN) China PBoC Open Market Operation (OMO): Skips OMO (19th straight skip)
- (CN) China sells ~127.3K tons of soybean at auction of state reserves - financial press
- Hong Kong Dollar currency (HKD) again hits the 7.8500 level, the weakest level of trading band vs US dollar
Japan
- Nikkei 225 opened flat
- TOPIX Iron & Steel index -1.7%, Information & Communications -1.1%, Electric Appliances -1.2% Marine Transportation +1%
- Japanese automakers trade generally lower
- (JP) Japan Fin Min Aso: Financial markets regaining calm, closely watching effects of the 'Turkey financial crisis'; Yen currency (JPY) did not move 'much' from Turkey Lira currency (TRY) turbulence
- (JP) Regional banks in Japan have taken losses on their sales of foreign bonds - Nikkei
- (JP) Japan barbershop chain QB House plans to raise prices amid labor shortage - Japanese Press
- (JP) Market players have varying views on the impact of the Bank of Japan's (BoJ) forward guidance, notes limited reaction in JGB prices to the recent situation in Turkey - Nikkei
Korea
- Kospi was closed for holiday
- (KR) South Korea President Moon: Heading to peace and prosperity on the Korean peninsula
Other
- (ID) Indonesia July Trade Balance: -$2.0B v -$0.6Be (widest deficit since 2013); Exports Y/Y: 19.3% v 14.2%e
- (PH) Philippines Trade Chief: Examining foreign shipping fees
North America
- US equity markets ended higher: Dow +0.5%, S&P500 +0.6%, Nasdaq +0.7%, Russell 2000 +1%
- S&P500 Consumer Discretionary +1%, Financials +0.9%
- (US) Weekly API Oil Inventories: Crude: +3.7M v -6.0M prior
Europe
- (TR) Turkey said to raise taxes on certain US goods - Turkish Press
- (TR) Turkey names Namik Kucuk as Central Bank Deputy Gov - Turkish Press
Levels as of 01:30ET
- Nikkei 225,-0.9 %, ASX 200 +0.1%, Hang Seng -1.5%; Shanghai Composite -1.5%; Kospi closed
- Equity Futures: S&P500 -0.2%; Nasdaq100 -0.2%, Dax -0.4%; FTSE100 -0.2%
- EUR 1.1351-1.1319 ; JPY 111.45-111.12 ; AUD 0.7245-0.7201 ;NZD 0.6578-0.6549
- Aug Gold -0.6% at $1,194/oz; Sept Crude Oil -0.4% at $66.77/brl; Sept Copper -1.4% a $2.647t /lb
GBP/JPY Daily Outlook
Daily Pivots: (S1) 140.77; (P) 141.58; (R1) 142.17; More...
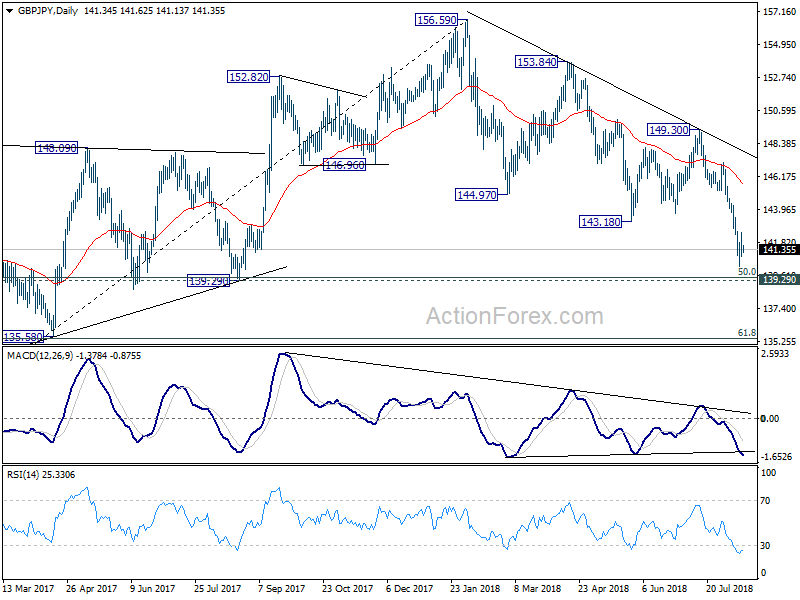
GBP/JPY is staying in consolidation from 140.23 and intraday bias remains neutral at this point. Stronger recovery cannot be ruled out. But outlook will remain bearish as long as 143.48 minor resistance holds. On the downside, break of 140.23 will extend the down trend from 156.59 to 139.29/47 key support level. We'll pay attention to bottoming signal around there.
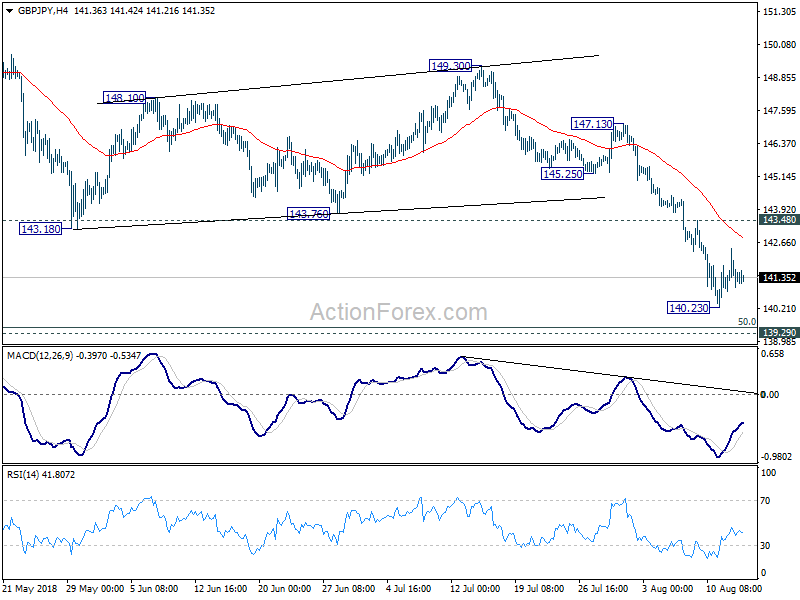
In the bigger picture, at this point decline from 156.59 is still seen as a corrective move. But the current downside accelerate makes this view shaky. Focus will be on 139.29 cluster support (50% retracement of 122.36 to 156.59 at 139.47). Strong rebound from there will re-affirm the bullish case that rise from 122.36 is still to extend through 156.59 high. However, sustained break of 139.29/47 should confirm medium term reversal. GBP/JPY would then target a retest on 122.26 (2016 low).
EUR/JPY Daily Outlook
Daily Pivots: (S1) 125.58; (P) 126.29; (R1) 126.76; More....
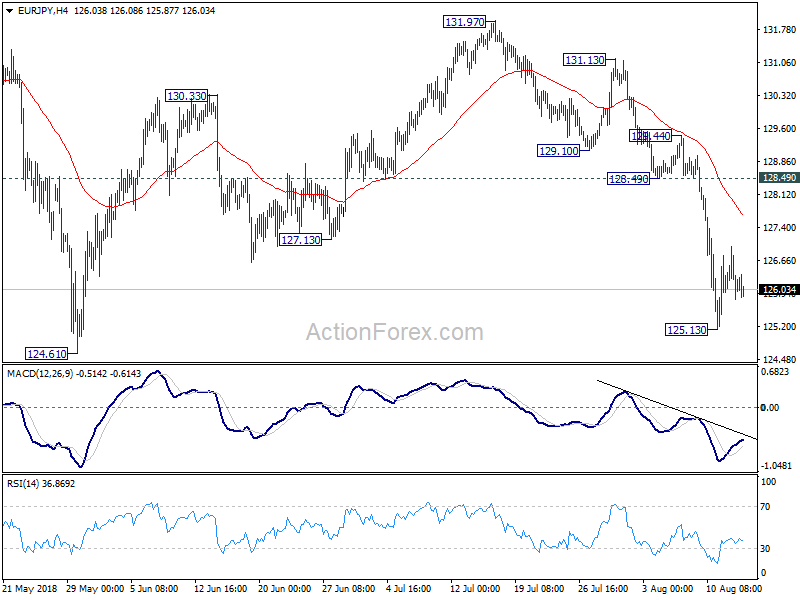
EUR/JPY is staying in consolidation from 125.13 and intraday bias remains neutral first. More corrective trading could be seen and stronger recovery cannot be ruled out. But upside should be limited well below 128.49 support turned resistance to bring fall resumption. On the downside, break of 125.13 will target 124.61 key support next.
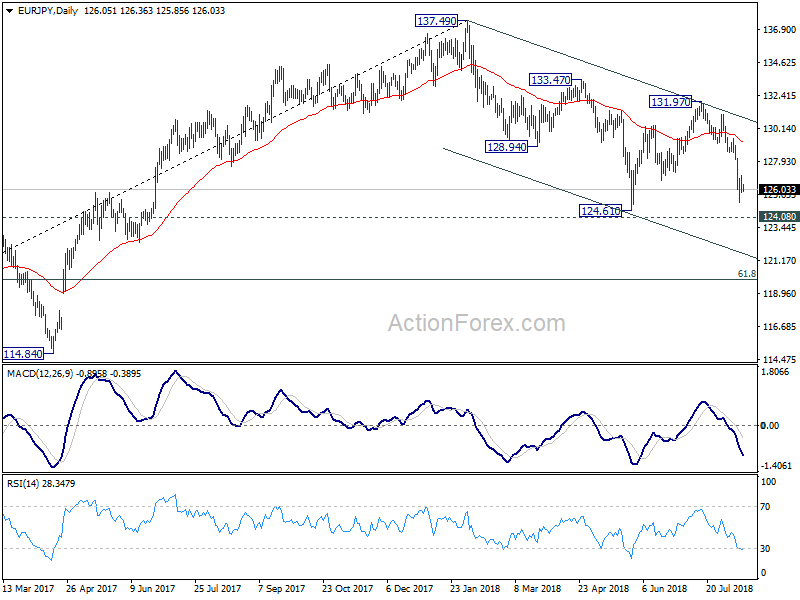
In the bigger picture, focus is back on 124.08 key resistance turned support. Decisive break there will argue that whole rise from 109.03 (2016 low) has completed at 137.49. Deeper decline would be seen to 61.8% retracement of 109.03 to 137.49 at 119.90 next. Sustained break there will pave the way to 109.03 and below. Meanwhile, rebound from 124.08 will keep medium term bullishness intact for another high above 137.49.
EUR/USD Continues Downtrend After Wave-3 Breaks Bear Flag
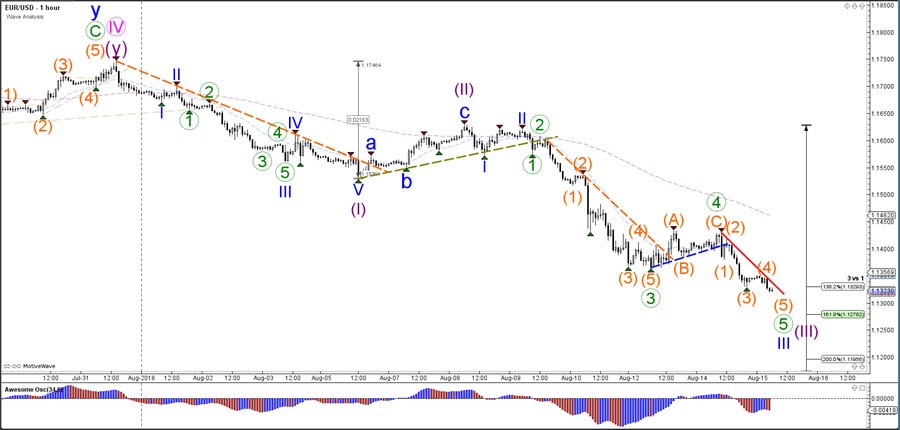
The EUR/USD downtrend is continuing lower as expected. The strong bearish momentum is confirming a wave 3 pattern, which could aim for the Fibonacci targets of wave 3 vs 1 at 1.1280 and 1.12.
The EUR/USD seems to be in a wave 3 (blue) of wave 3 (purple) at the moment. Eventually a wave 4 retracement should make a shallow pullback, probably after hitting the Fibonacci target.
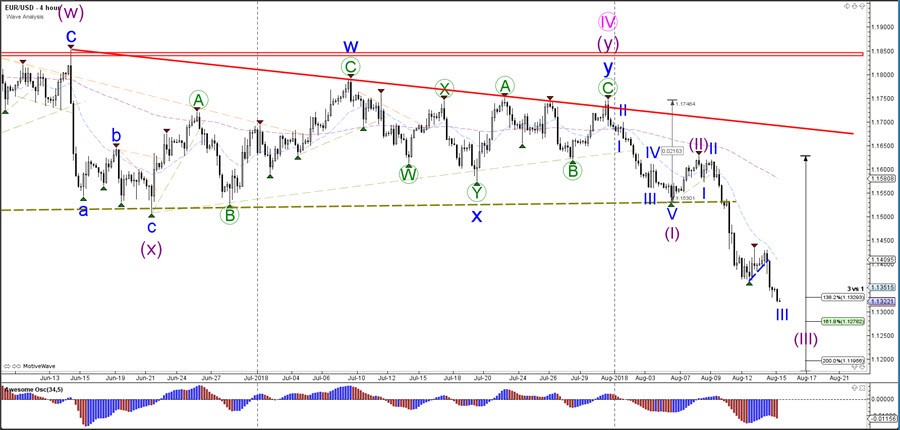
The EUR/USD completed a wave 5 pattern within wave 3 (green), then completed a classical ABC correction within a shallow wave 4 (green), before breaking the support trend line (dotted blue) of the bear flag chart pattern and continuing lower for a wave 5 (orange) of wave 5 (green) within wave 3 (blue).
EUR/GBP Daily Outlook
Daily Pivots: (S1) 0.8894; (P) 0.8922; (R1) 0.8946; More...
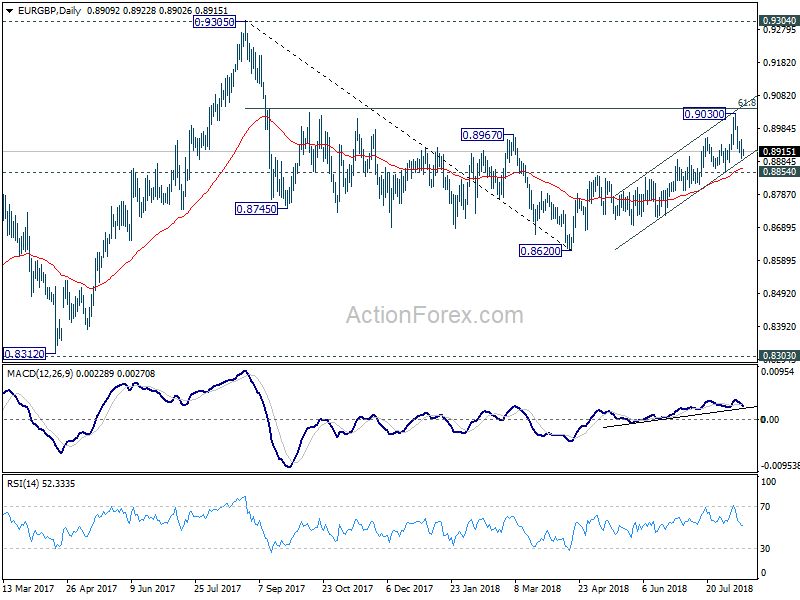
EUR/GBP is staying in corrective pattern from 0.9030 and intraday bias remains neutral first. In case of deeper pull back, downside should contained by 0.8854 support to bring rebound. On the upside, firm break of 61.8% retracement of 0.9305 to 0.8620 at 0.9043 will pave the way to retest 0.9305 key resistance. However, sustained break of 0.8854 will indicate near term reversal and turn outlook bearish.
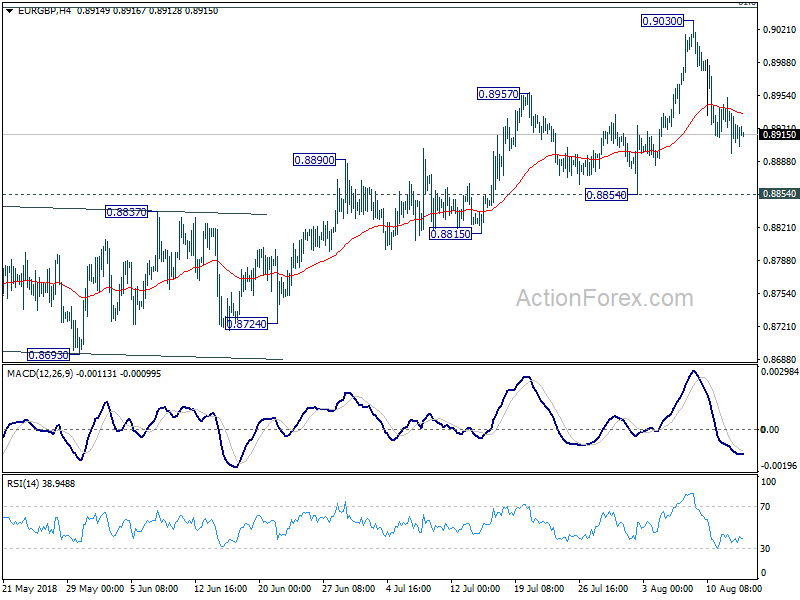
In the bigger picture, EUR/GBP is staying in long term range pattern from 0.9304 (2016 high). The corrective structure of the fall from 0.9305 to 0.8620 is raising the chance that rise from 0.8312 to 0.9305 is an impulsive move. But we're not too confident on it yet. In any case, we'd stay cautious on strong resistance from 0.9304/5 to limit upside in case of further rally. Meanwhile, if there is another medium term decline, strong support will likely be seen from 0.8303 to contain downside.