Sample Category Title
EUR/AUD Daily Outlook
Daily Pivots: (S1) 1.5644; (P) 1.5685; (R1) 1.5712; More....
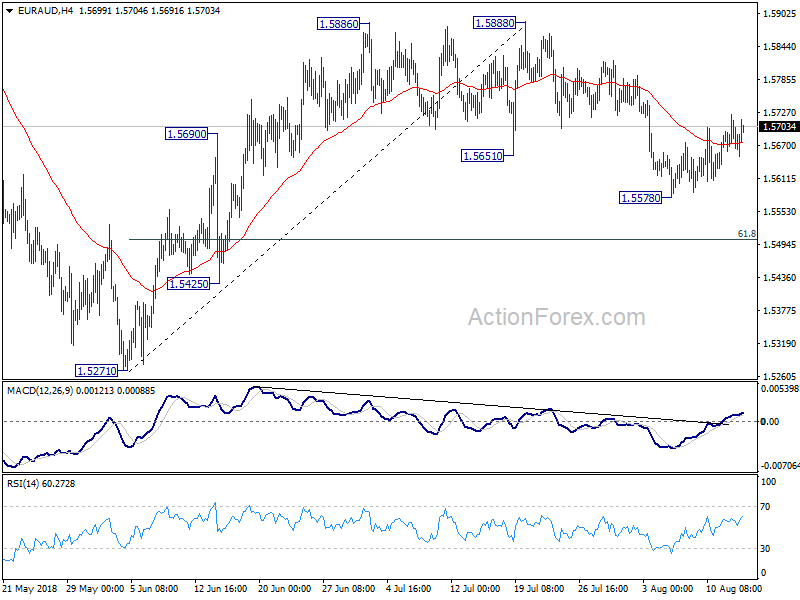
Intraday bias in EUR/AUD remains mildly on the upside for the moment. Pull back from 1.5888 could have completed at 1.5578 already. Further rise would be seen to retest 1.5888 first. On the downside, though, below 1.5578 will resume the fall from 1.5888 to 61.8% retracement of 1.5271 to 1.5888 at 1.5507.
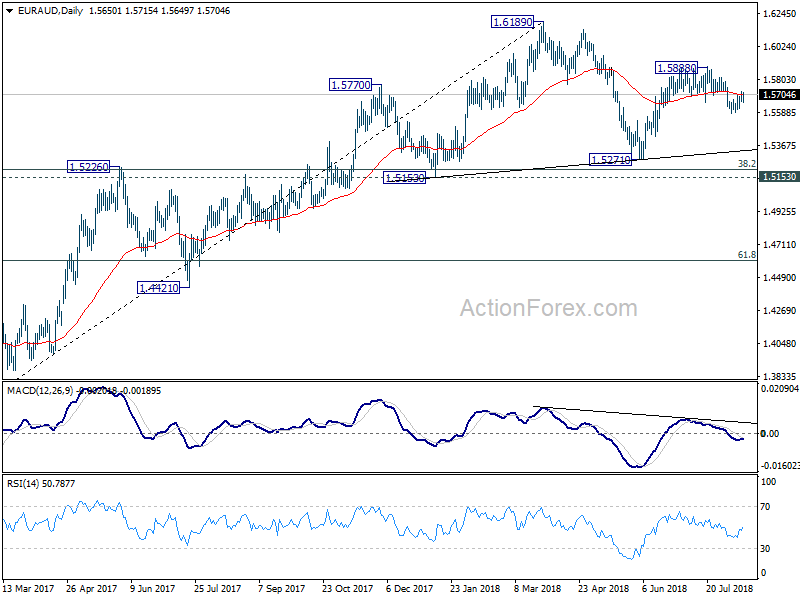
In the bigger picture, the rebound from 1.5271 was somewhat weaker than expected. EUR/AUD also failed to sustain above 55 day EMA and hints on some underlying bearishness. Though, for now, as long as 1.5271 support holds, medium term rise from 1.3624 (2017 low) is still mildly in favor to extend through 1.6189 high, to 1.6587 key resistance (2015 high). Nevertheless, firm break of 1.5271 will complete a head and shoulder top pattern (ls: 1.5770, h: 1.6189, rs: 1.5888). That would indicate medium term reversal and turn outlook bearish.
EUR/CHF Daily Outlook
Daily Pivots: (S1) 1.1243; (P) 1.1299; (R1) 1.1333; More...
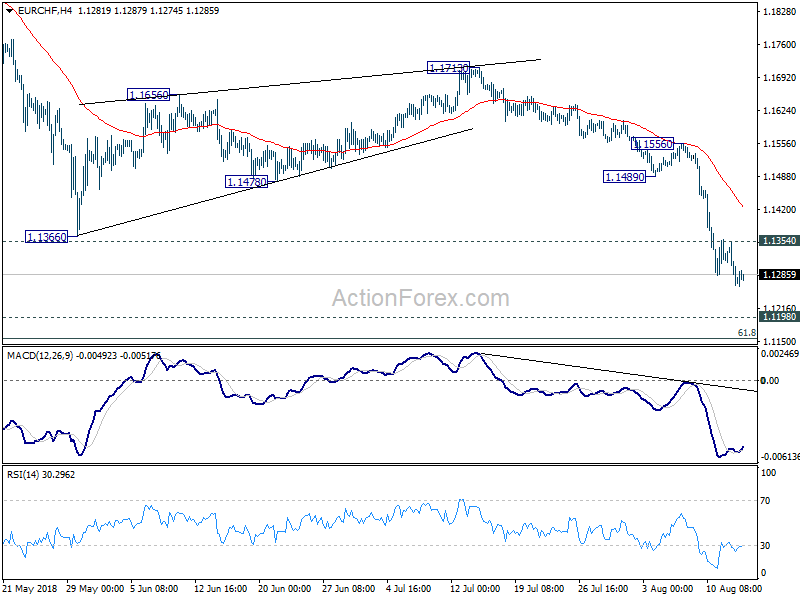
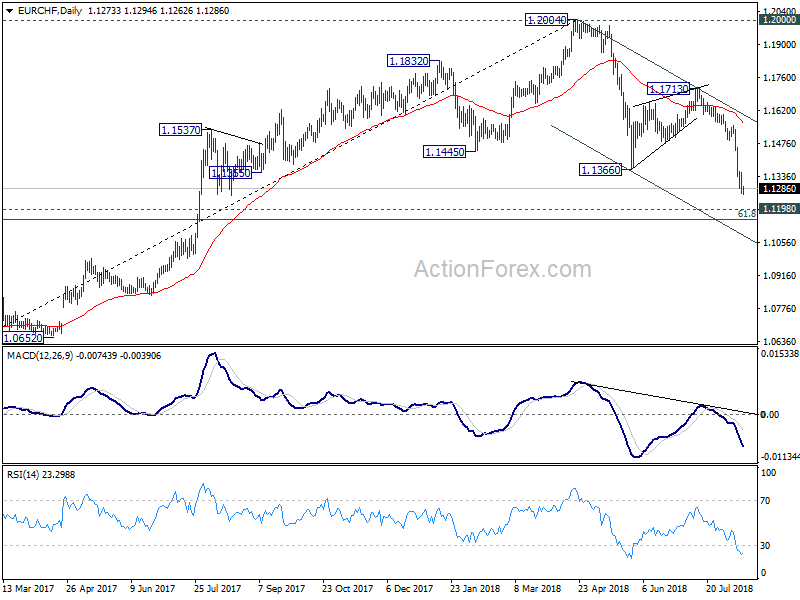
EUR/CHF's decline resumed after brief consolidation and intraday bias is back on the downside. Current fall should extend to key support zone between 1.1154/98. We'd expect strong support from there to contain downside to complete the whole decline from 1.2004. On the upside, above 1.1354 minor resistance will turn intraday bias neutral first.
In the bigger picture, for now, the price actions from 1.2004 medium term top is seen as a correction only. Downside should be contained by 1.1154/98 support zone, 1.1198 (2016 high), 61.8% retracement of 1.0629 to 1.2004 at 1.1154 to complete it and bring rebound. This cluster level is in proximity to long term channel support (now at 1.1173) too. A break of 1.2 key resistance is still expected in the medium term long term. However, sustained break of the mentioned support zone will mark reversal of the long term trend.
The UK Inflation Report For July Is The Key Release In Europe Today
Market movers today
The UK inflation report for July is the key release in Europe today, where we estimate CPI inflation fell to 2.3% y/y from 2.4% y/y in June. In general, we believe the inflation prints will be interesting to follow in H2 18, as we believe the Bank of England is too optimistic on the inflation outlook.
In the US, retail sales for July are due out, which are likely to show that private consumption remains the main growth driver in the US. Manufacturing production and the Empire Manufacturing Index are also on the agenda.
Selected market news
Turkish President Erdogan's speech yesterday brought little news apart from calling for a consumer boycott of American products and as no news is good news for markets at the moment, USD/TRY came down to the levels of last Friday. We still see it as too early for the Turkish crisis to be over just yet, also because Turkey remains in a financially weak position and the fundamental and diplomatic issues remain unresolved.
As the Turkish lira issue calmed somewhat, we also saw a reversal in the spread widening between the core EU and periphery yields yesterday. That said, the yield on Italian 2Y government bonds remains well above 1% and the 10Y yield is trading around 3%. Comments from Italy's eurosceptic head of budget committee, Claudio Borghi - that the ECB should shield Italy from market forces - did nothing to allay investor concerns about Italy's lingering political risks.
Equity markets show a mixed picture this morning as the risk-off mood lingers, with US index futures pointing to a weaker opening and Asian shares mostly edging down. EUR/USD fell to its lowest level since June 2017, despite European macro data surprising on the upside yesterday. German Q2 GDP growth rebounded to 0.5% q/q driven by stronger domestic demand, and German ZEW expectations picked up after falling for eight consecutive months driven by more upbeat sentiment in the automobile sector. Euro area GDP growth for Q2 was also revised up to 0.4% q/q on the back of the stronger German data. Overall, the data supported our view that we will see continued solid growth in the euro area in Q3 following subsiding trade risks and EUR depreciation.
For those of you returning from holiday, here is a quick wrap-up of the main themes over the past three weeks: Vacation Wrap-Up: Market themes over the past three weeks , 12 August 2018.
GBP/USD Bearish Breakout Below Bear Flag Chart Pattern
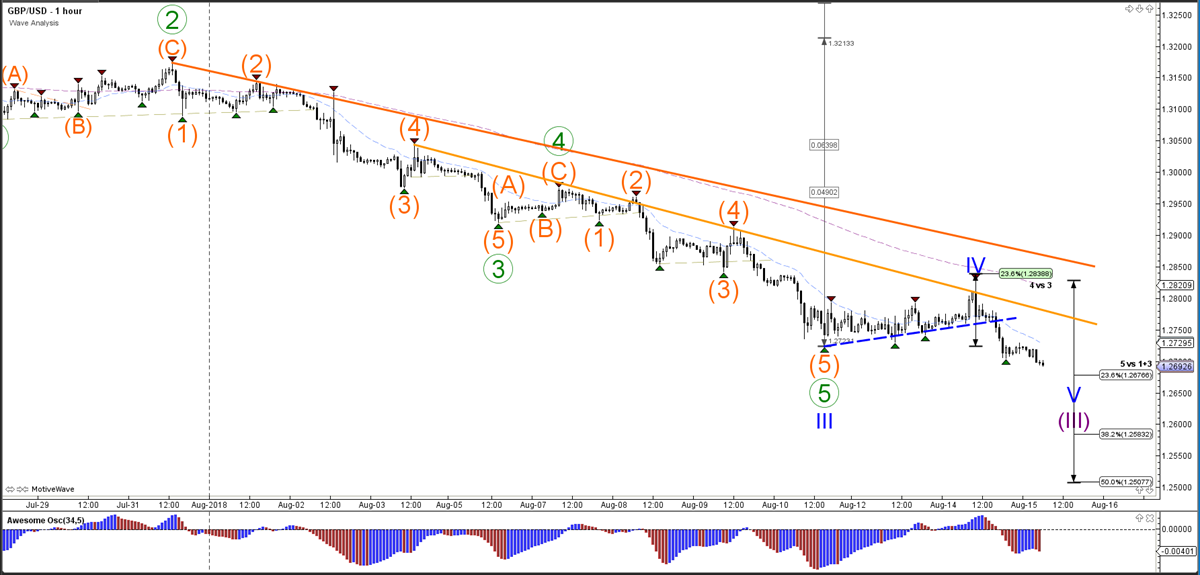
The GBP/USD made a bullish retracement and bearish continuation as expected in our wave analysis earlier this week. The GBP/USD broke below the support trend line (dotted blue) for a new low after a bearish bounce occurred at the 23.6% Fibonacci retracement level of wave 4 vs 3.
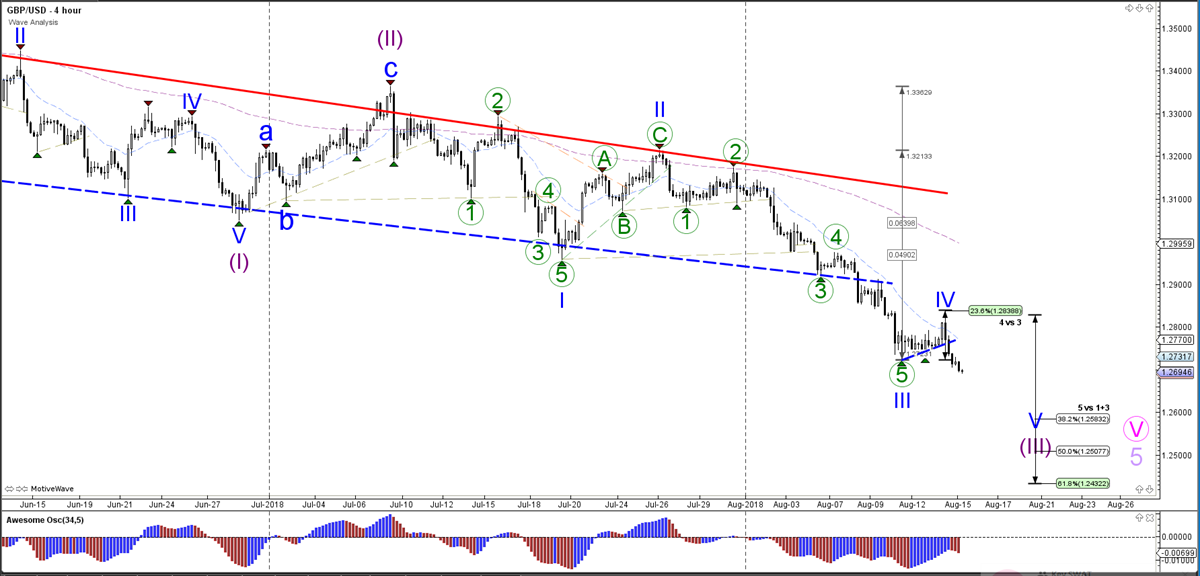
The GBP/USD broke the bear flag chart pattern and is now continuing the downtrend.
Elliott Wave View: GBPUSD Calling For More Downside
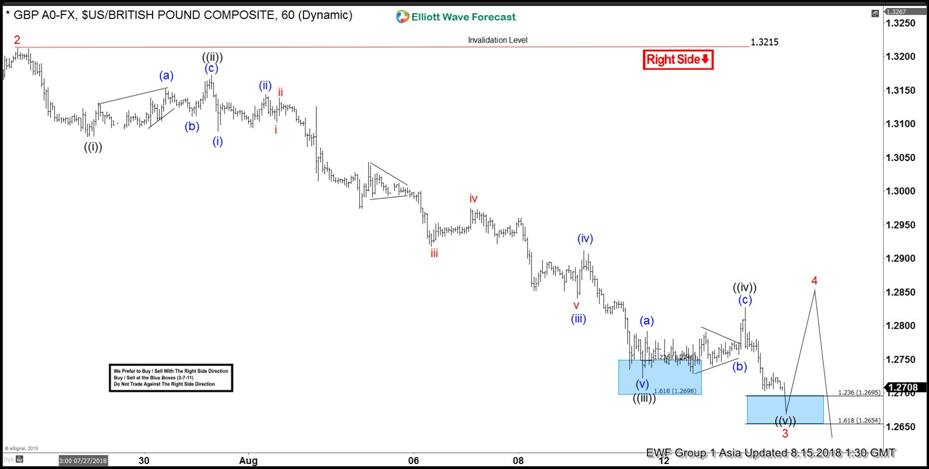
GBPUSD short-term Elliott wave view suggests that the rally to 1.3215 high ended Minor wave 2 bounce. Down from there, Minor wave 3 is taking place as impulse structure with lesser degree cycles are showing sub-division of 5 waves structure lower in it’s each leg lower i.e Minute wave ((i)), ((iii)) & ((v)). While the sub-division in Minute wave ((ii)) & ((iv)) unfolded in 3 wave corrective sequence.
Down from 1.3215 high, the initial decline to 1.3081 low ended Minute wave ((i)) in 5 waves. Up from there, the bounce to 1.3172 high ended Minute wave ((ii)) in 3 swings as Elliott wave zigzag. Below from there, the decline to 1.2722 low unfolded in 5 waves & ended Minute wave ((iii)). Above from there, the bounce to 1.2826 high ended Minute wave ((iv)) in 3 swings as zigzag. Near-term focus remain towards 1.2695-1.2654 inverse 123.6%-161.8% of Minute wave ((iv)) to end Minute wave ((v)) of 3. Afterwards, the pair is expected to do a Minor wave 4 bounce in 3, 7 or 11 swings before further downside is seen. In case of further extension in Minute wave ((v)) of 3, pair can see 61.8%-76.4% Fibonacci extension area of Minute ((i))+((iii)) at 1.2521-1.2448 area as well before bounce in Minor wave 4 takes place. We don’t like buying it and prefer more downside against 1.3215 high in the first degree.
GBPUSD 1 Hour Elliott Wave Chart
Aussie Drops On Hints Of Potential China Slowdown
AUD/USD hits lowest in 19-months
Further signs that China's economy may be slowing helped push the Australian dollar to its lowest level since January 2017, though the fall was cushioned somewhat by a slight pop in iron ore prices on China's Dalian exchange. The Aussie is trading about 7.5% lower versus the US dollar since the beginning of the year. Fixed asset investment rose 5.5% y/y from January to July in China, less than the 6.0% forecast and the smallest increase since data began in early 2008.
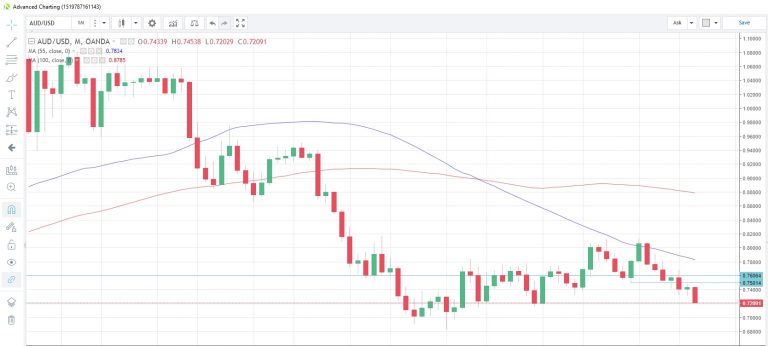
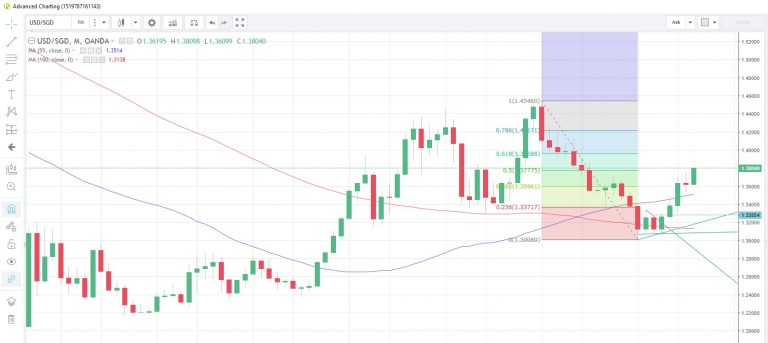
Elsewhere, USD/TRY consolidated yesterday's 10.1% drop with a mild rebound to 6.4793. USD/MXN likewise rose 0.44% while USD/SGD, a good barometer of the dollar's direction, rose 0.13% to 1.3800, its highest level in just over a year.
Australia wages growth hits forecast
Wages growth in Australia remains slow, with the county's wage price index rising 0.6% q/q in Q2, a slight pickup from the 0.5% rate in Q1 though has consistently held in the 0.4% to 0.6% range for the past four years. Slow wages growth (combined with high household debt) has been cited by the RBA as a reason for keeping interest rates at record lows. Consumer confidence, as measured by the Westpac index was down 2.3% in August after registering and improvement of 3.9% the previous month.
UK inflation data scheduled
The rest of today's calendar comprises China's foreign direct investment totals from January to July followed by more data from the UK. This time we have both producer and consumer prices and DCLG's reading of house prices in July. The Bank of England cited taming consistently high inflation as one of the reasons for hiking rates earlier this month and should we get a higher-than-estimated number, talk will increase about the timing of the next hike.
The US session features US retail sales, the industrial production/capacity utilization combo and business inventories. Closing the session we see net inflows/outflows of financial resources in the US with the monthly TIC flows data.
EUR/USD Daily Outlook
Daily Pivots: (S1) 1.1306; (P) 1.1367 (R1) 1.1404; More.....
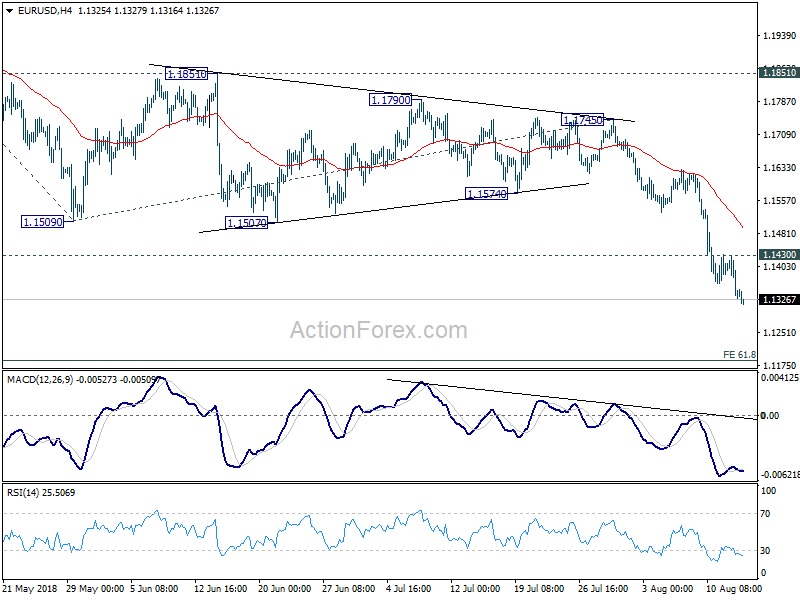
EUR/USD's fall resumed after brief consolidation and intraday bias is back on the downside. Current fall is part of the down trend from 1.2555 and should target 61.8% projection of 1.2413 to 1.1509 from 1.1745 at 1.1186. Note that it's a cluster level with 61.8% retracement of 1.0339 to 1.2555 at 1.1186. Hence, we'll tentatively look for short term bottoming around 1.1186. On the upside, above 1.1430 minor resistance will turn intraday bias neutral and bring consolidations again.
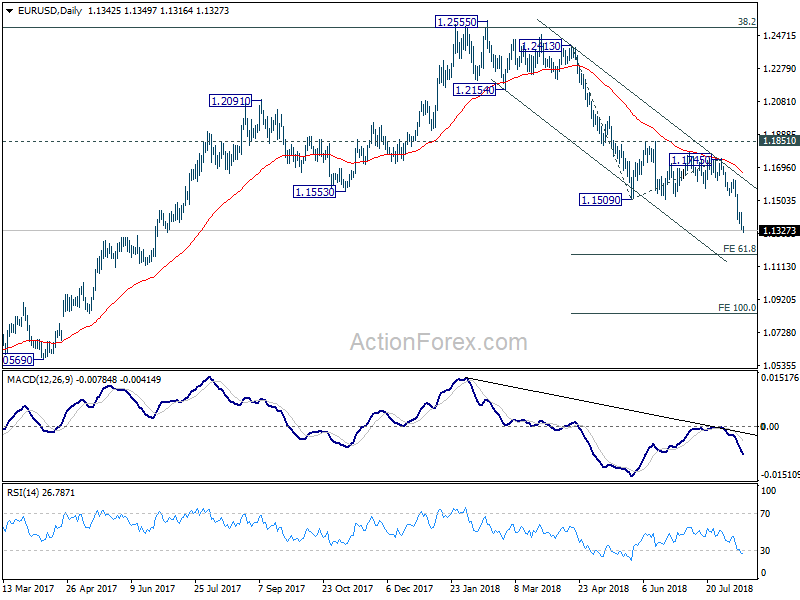
In the bigger picture, the down trend from 1.2555 medium term is in progress for 61.8% retracement of 1.0339 to 1.2555 at 1.1186. Note again that EUR/USD was rejected by 38.2% retracement of 1.6039 (2008 high) to 1.0339 (2017 low) at 1.2516. That carries some long term bearish implications. Sustained break of 1.1186 could pave the way back to retest 1.0339 low. For now, outlook will remain bearish as long as 1.1851 resistance holds, even in case of strong rebound.
GBP/USD Daily Outlook
Daily Pivots: (S1) 1.2672; (P) 1.2749; (R1) 1.2797; More...
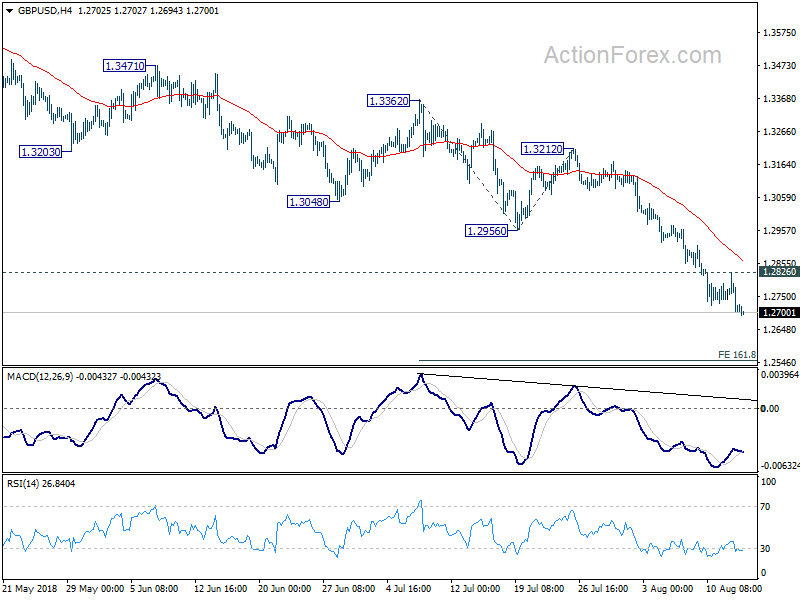
GBP/USD's decline resumed after brief consolidation and intraday bias is back on the downside. Current fall is part of the down trend from 1.4376. GBP/USD should target 161.8% projection of 1.3362 to 1.2956 from 1.3212 at 1.2555 next. On the upside, above 1.2826 minor resistance will turn bias neutral and bring consolidation again.
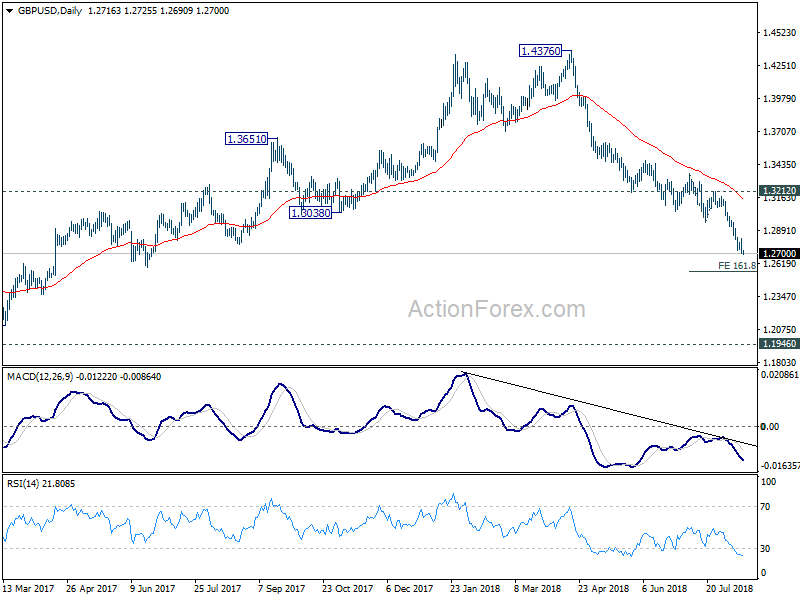
In the bigger picture, whole medium term rebound from 1.1946 (2016 low) should have completed at 1.4376 already, after rejection from 55 month EMA (now at 1.4141). Current downside acceleration argues that it's possibly resuming long term down trend. In any case, outlook will stay bearish as long as 1.3212 resistance holds. Retest of 1.1946 should be seen next.
USD/CHF Daily Outlook
Daily Pivots: (S1) 0.9912; (P) 0.9932; (R1) 0.9962; More....
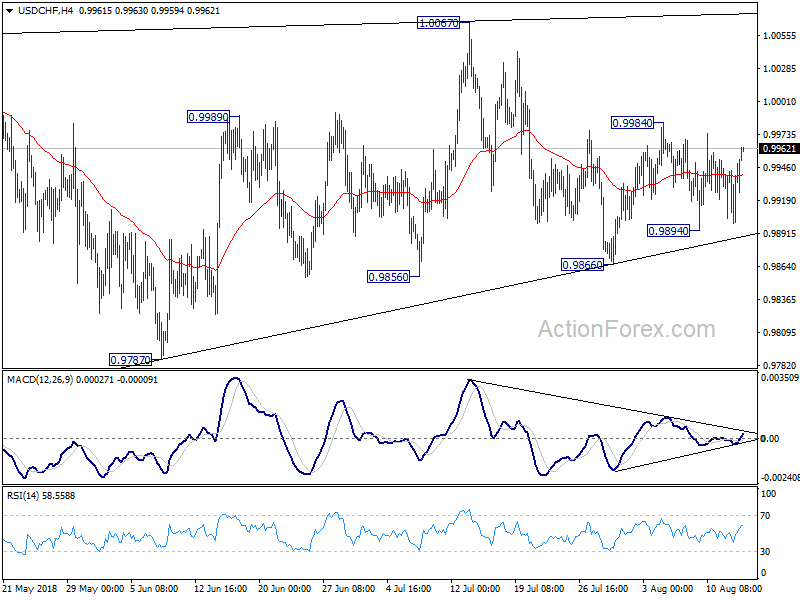
USD/CHF is still bounded in range of 0.9894/9984. Intraday bias remains neutral at this point. On the upside, above 0.9984 will resume the rebound from 0.9866 to retest 1.0067 high. Decisive break there will resume whole rally from 0.9186. On the downside, below 0.9894 might extend the consolidation pattern from 1.0056 with another falling leg. But downside should be contained by 38.2% retracement of 0.9186 to 1.0056 at 0.9724 to bring rebound.
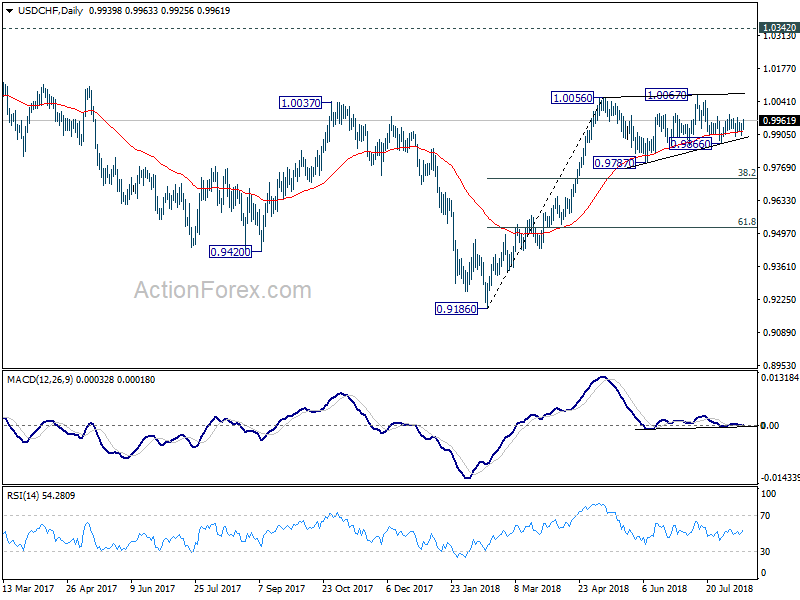
In the bigger picture, current development suggests that the consolidation pattern from 1.0056 is extending with another leg. As long as 38.2% retracement of 0.9186 to 1.0056 at 0.9724 holds, we'd expect rise from 0.9186 to resume at a later stage to retest 1.0342 key resistance (2016 high). However, sustained break of 0.9724 fibonacci level will bring deeper fall, as another declining leg in the long term range pattern.
USD/JPY Daily Outlook
Daily Pivots: (S1) 110.72; (P) 111.02; (R1) 111.44; More...
The break of 111.17 minor resistance suggests that correction from 113.17 has completed with three waves down to 110.10. Intraday bias is back on the upside for 112.14 resistance first. Break there will bring retest of 113.17 high. In case of another fall, we'd continue to expect strong support from 38.2% retracement of 104.62 to 113.17 at 109.90 to contain downside and bring rebound.
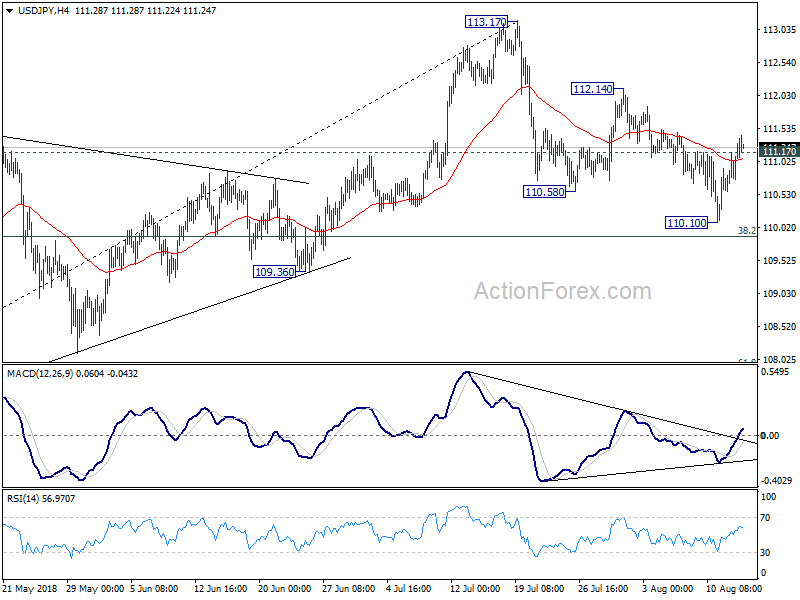
In the bigger picture, corrective fall from 118.65 (2016 high) should have completed with three waves down to 104.62. Decisive break of 114.73 resistance will likely resume whole rally from 98.97 (2016 low) to 100% projection of 98.97 to 118.65 from 104.62 at 124.30, which is reasonably close to 125.85 (2015 high). This will stay as the preferred case as long as 109.36 support holds.