

Sample Category Title
USD/CAD Daily Outlook
Daily Pivots: (S1) 1.3030; (P) 1.3083; (R1) 1.3111; More...
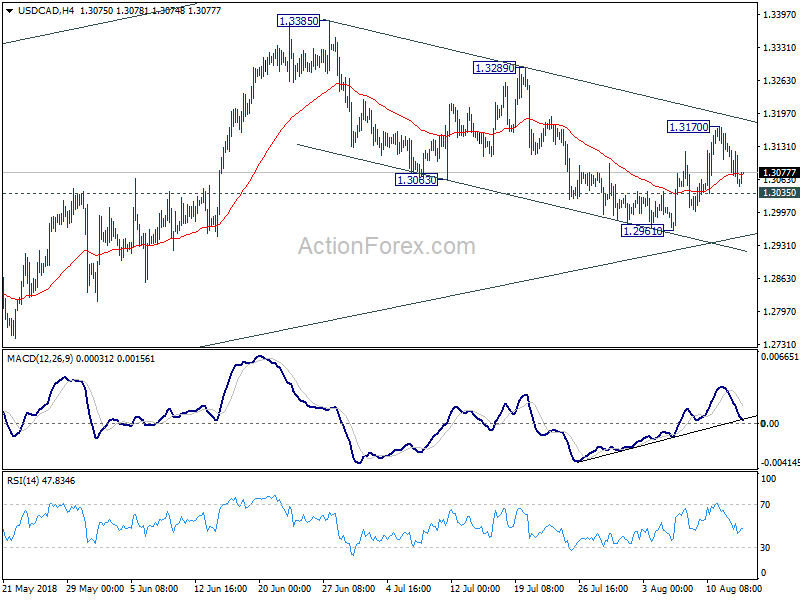
Intraday bias in USD/CAD remains neutral for the moment. With 1.3035 minor support intact, we're favoring the bullish case. That is, correction from 1.3385 should have completed with three waves down to 1.2961. Above 1.3170 will target 1.3289 resistance first. Break there will resume larger rise from 1.2061 through 1.3385 high. On the downside, though, break of 1.3035 minor support will dampen this bullish view and turn focus back to 1.2961 low.
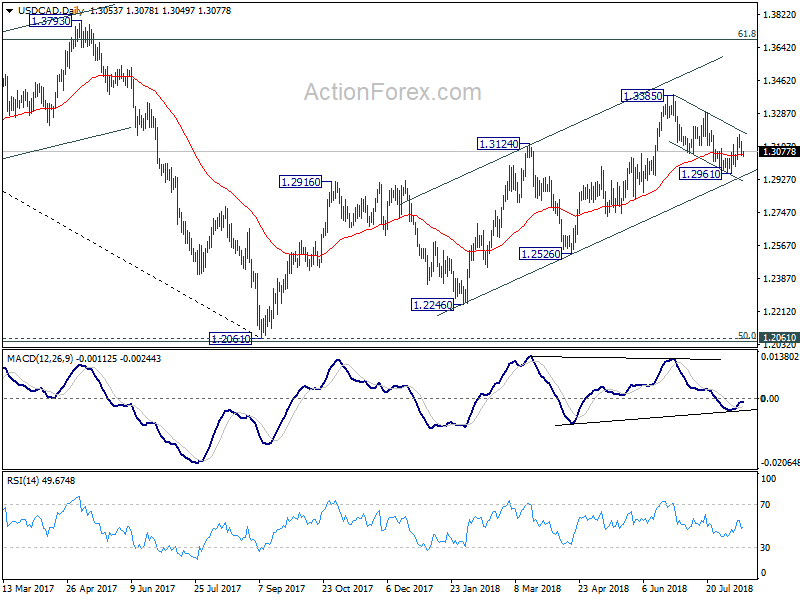
In the bigger picture, as long as channel support (now at 1.2950) holds, we're holding to the bullish view. That is, fall from 1.4689 (2015 high) has completed at 1.2061, ahead of 50% retracement of 0.9406 (2011 low) to 1.4689 (2015 high) at 1.2048. Further rally should be seen for 61.8% retracement of 1.4689 to 1.2061 at 1.3685 and above. However, sustained break of the channel support will argue that rise from 1.2061 has completed and will bring deeper fall to 1.2526 support to confirm.
AUD/USD Daily Outlook
Daily Pivots: (S1) 0.7214; (P) 0.7248; (R1) 0.7274; More...
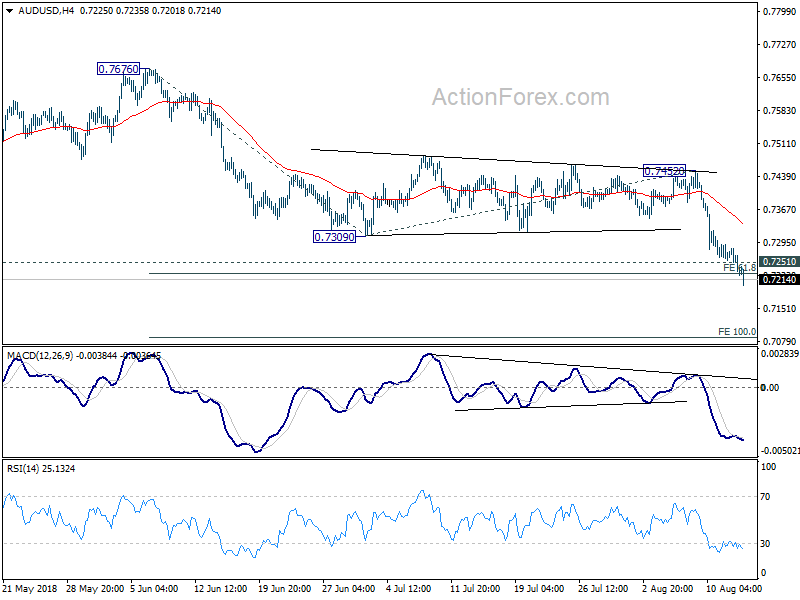
AUD/USD's drops to as low as 0.7201 so far and met 61.8% projection of 0.7676 to 0.7309 from 0.7452 at 0.7225 already. Intraday bias remains on the downside for next target at 100% projection at 0.7085. On the upside, above 0.7251 minor resistance will turn intraday bias and bring consolidation. But recovery should be limited well below 0.7452 resistance to bring fall resumption.
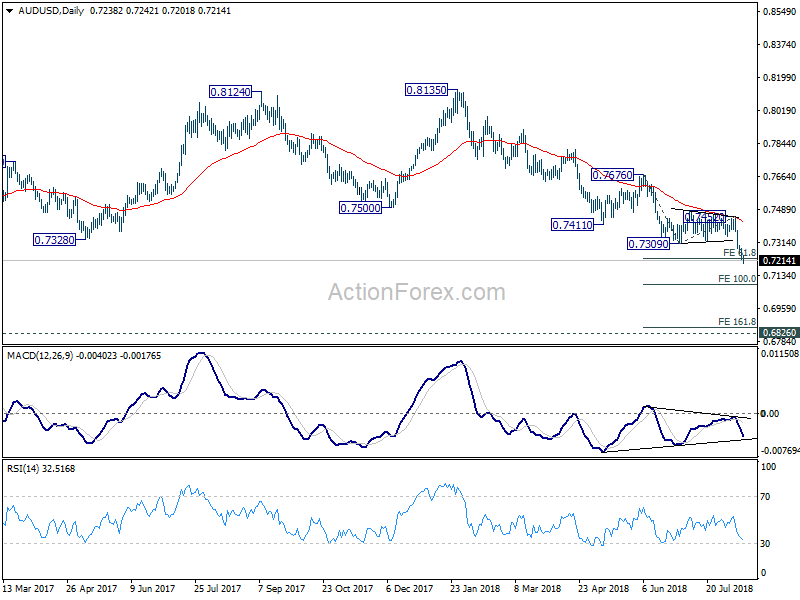
In the bigger picture, medium term rebound from 0.6826 (2016 low) is seen as a corrective move that should be completed at 0.8135. Fall from there should now have a test on 0.6826. There is prospect of resuming long term down trend from 1.1079 (2011 high). But we'll look at downside momentum to assess at a later stage. On the upside, break of 0.7452 resistance is needed to indicate medium term bottoming. Otherwise, outlook will remain bearish even in case of strong rebound.
Dollar Power Higher as Renewed Selloff in China Yuan Weighs on Sentiments
Renewed selloff in the Chinese Yuan weighs down sentiments across Asia and boosts the greenback today. USD/CHN breaks recent high at 6.912 to resume up trend. With that, China Shanghai SSE is trading down -2.31% at the time of writing. Hong Kong HSI is down -1.52%, Singapore Strait Times is down -0.17% and Nikkei is down -0.72%. Dollar is the clear winner in the currency markets. Yen and Canadian Dollar follow as the next strongest. Australian Dollar and New Zealand Dollar, on the other hand, suffer deep selling.
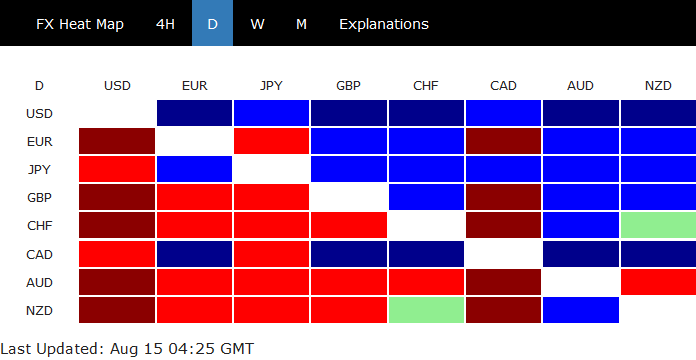
Technically, Dollar remains in up trend against Euro, Sterling and Australian Dollar. Meanwhile, USD/CHF, USD/JPY and USD/CAD are still kept in range. USD/JPY's break of 111.17 minor resistance overnight is taken as indicate of near term reversal. That is, correction from 113.17 has completed at 110.10. But there is no clear cut upside momentum yet. We'll see if these four currencies will stay strong altogether ahead.
Chinese Yuan in decline again, USDCNH heading to 7?
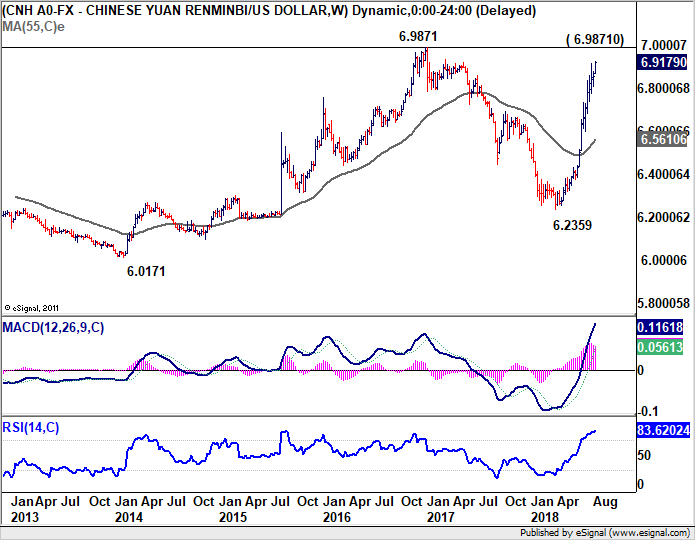
The Chinese Yuan is under renewed selling pressure again today. USD/CNH (offshore Yuan) rises to as high as 6.921 so far and breaks 6.912 resistance. USD/CNH has been in steep rise since hitting a low at 6.2359, as trade tension between the US and China escalated. The next batches of tariffs will start next week and more are coming. The Chinese National Development and Reform Commission pledged today to work on meeting this year's 6.5% growth target. With usual way of interpreting Chinese rhetorics, it means they found it difficult to meet that target.
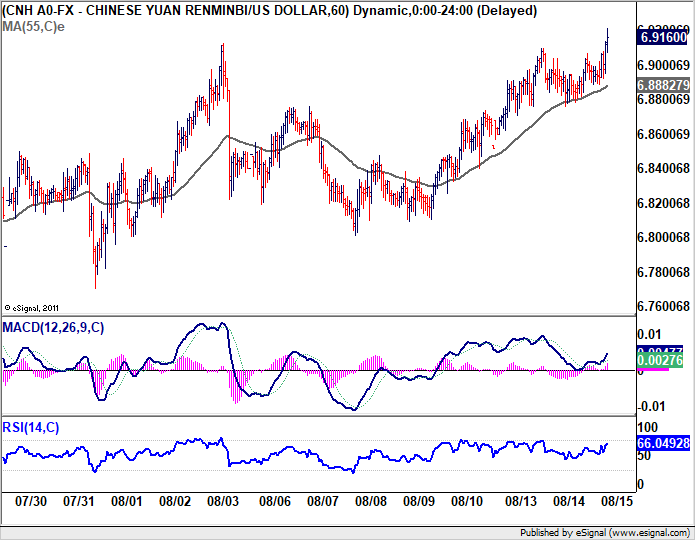
Now USD/CNH is on course to have a test on key resistance level at 6.9871, 2017 high. It remains to be seen if the government will intervene more aggressively. If the Yuan is solely moved by market forces, we see no reason why USD/CNH will not break 7 handle.
Gold extends decline on Dollar strength, breaks 1190
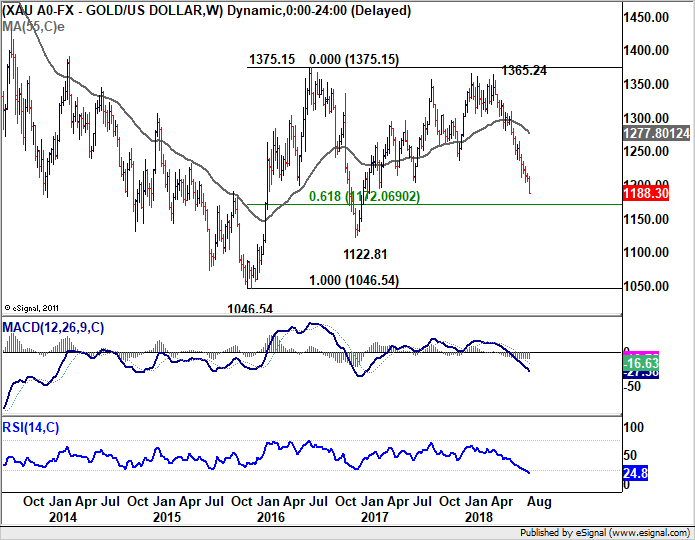
On the back of broad based strength in Dollar, Gold's decline continues today and breaks 1190 handle to as low as 1188.42 so far. The down trend from 1365.24 is on track for 1172.06 fibonacci level. Daily RSI may indicate Gold is in oversold condition again. But based on current acceleration, RSI indeed suggests solid downside momentum. 1172.06 could be taken out without much hesitation and the next real hurdle is probably 1122.81 support. And in any case, near term outlook will remain bearish as long as 1217.20 resistance holds.
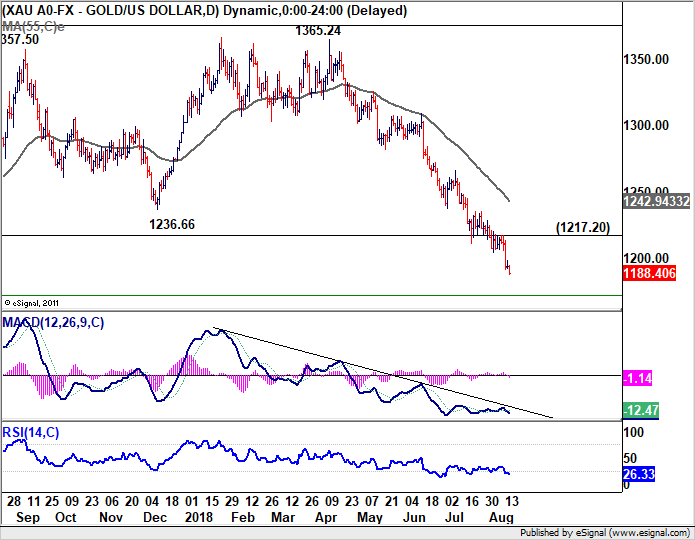
In the bigger picture, currently decline from 1365.24 is viewed as part of the long term sideway pattern from 1046.54 (2015 low). Sustained break of 61.8% retracement of 1046.64 to 1375.15 at 1172.06 will pave the way to 1046.54/1122.81 support zone. At this point, we're not expecting a break there to resume long term down trend yet. Hence, we'll look for bottoming signal below 1122.81.
Australia consumer sentiment dipped -2.3% mom, wage price grew 0.6% qoq
Australia Westpac Melbourne Institute consumer sentiment dropped -2.3% to 103.6 in August, down from 106.1. The index pared back half of the "surprisingly strong gains in June to Jule" as the impact of government's tax cuts faded. The decline also came against the backdrop of rising global trade tension and housing markets correction in Sydney and Melbourne.
Westpac pointed out RBA's projection that inflation will hit 2.25% by 2020 and expects next move is up. It noted an "obvious headwind" for RBA is "the impact that five years of underperformance in inflation will have on households' and firms' expectations." And, "lower expectations will make it that much more difficult to lift inflation back into the band". Westpac also noted that "certainly it will be quite some time before the Bank has a case to adjust the cash rate." And it maintains the view that RBA will be on whole in both 2018 and 2019.
Also from Australia, Wage price index rose 0.6% qoq, 2.1% yoy in Q2, in line with expectation. Private sector wage price grew 0.5% qoq, 2.0% yoy. Public sector wage grew 0.6% qoq, 2.4% yoy.
Looking ahead - UK inflation data unlikely to alter Sterling's down trend
UK data will once again be the highlight in European session. Headline CPI is expected to accelerate from 2.4% yoy to 2.5% yoy in July. Core CPI is expected to be unchanged at 1.9% yoy. RPI, PPI and hour price index will also be released. Note that according to the August Inflation Report, BoE projects CPI to peak at 2.5% in Q3 this year, then slow to 2.2% in Q3 2019. It doesn't expect a full 25bps rate hike until Q1 2020. One month of inflation data shouldn't have much impact on something that's going to happen in nearly 1.5 years time. So, with or without surprise, the down trend in Sterling will likely continue after the release.
Later in the day, a number of US data will be featured, including retail sales, industrial production, business inventories, NAHB housing index Empire state manufacturing and non-farm productivity.
AUD/USD Daily Outlook
Daily Pivots: (S1) 0.7214; (P) 0.7248; (R1) 0.7274; More...
AUD/USD's drops to as low as 0.7201 so far and met 61.8% projection of 0.7676 to 0.7309 from 0.7452 at 0.7225 already. Intraday bias remains on the downside for next target at 100% projection at 0.7085. On the upside, above 0.7251 minor resistance will turn intraday bias and bring consolidation. But recovery should be limited well below 0.7452 resistance to bring fall resumption.
In the bigger picture, medium term rebound from 0.6826 (2016 low) is seen as a corrective move that should be completed at 0.8135. Fall from there should now have a test on 0.6826. There is prospect of resuming long term down trend from 1.1079 (2011 high). But we'll look at downside momentum to assess at a later stage. On the upside, break of 0.7452 resistance is needed to indicate medium term bottoming. Otherwise, outlook will remain bearish even in case of strong rebound.
Economic Indicators Update
| GMT | Ccy | Events | Actual | Forecast | Previous | Revised |
|---|---|---|---|---|---|---|
| 00:30 | AUD | Westpac Consumer Confidence Aug | -2.30% | 3.90% | ||
| 01:30 | AUD | Wage Price Index Q/Q Q2 | 0.60% | 0.60% | 0.50% | |
| 08:30 | GBP | CPI M/M Jul | -0.20% | 0.00% | ||
| 08:30 | GBP | CPI Y/Y Jul | 2.50% | 2.40% | ||
| 08:30 | GBP | Core CPI Y/Y Jul | 1.90% | 1.90% | ||
| 08:30 | GBP | RPI M/M Jul | 0.40% | 0.30% | ||
| 08:30 | GBP | RPI Y/Y Jul | 3.60% | 3.40% | ||
| 08:30 | GBP | PPI Input M/M Jul | -0.10% | 0.20% | ||
| 08:30 | GBP | PPI Input Y/Y Jul | 10.80% | 10.20% | ||
| 08:30 | GBP | PPI Output M/M Jul | 0.10% | 0.10% | ||
| 08:30 | GBP | PPI Output Y/Y Jul | 3.20% | 3.10% | ||
| 08:30 | GBP | PPI Output Core M/M Jul | 0.10% | 0.20% | ||
| 08:30 | GBP | PPI Output Core Y/Y Jul | 2.30% | 2.10% | ||
| 08:30 | GBP | House Price Index Y/Y Jun | 2.80% | 3.00% | ||
| 12:30 | USD | Empire State Manufacturing Aug | 20.3 | 22.6 | ||
| 12:30 | USD | Nonfarm Productivity Q2 P | 2.50% | 0.40% | ||
| 12:30 | USD | Unit Labor Costs Q2 P | -0.20% | 2.90% | ||
| 12:30 | USD | Retail Sales Advance M/M Jul | 0.30% | 0.50% | ||
| 12:30 | USD | Retail Sales Ex Auto M/M Jul | 0.40% | 0.40% | ||
| 13:15 | USD | Industrial Production M/M Jul | 0.30% | 0.60% | ||
| 13:15 | USD | Capacity Utilization Jul | 78.20% | 78.00% | ||
| 14:00 | USD | Business Inventories Jun | 0.20% | 0.40% | ||
| 14:00 | USD | NAHB Housing Market Index Aug | 67 | 68 | ||
| 14:30 | USD | Crude Oil Inventories | -1.4M | |||
| 20:00 | USD | Net Long-term TIC Flows Jun | 32.3B | 45.6B |
Yield Outlook: Turkey And Italy Keep German/Scandi Yields Low For Now
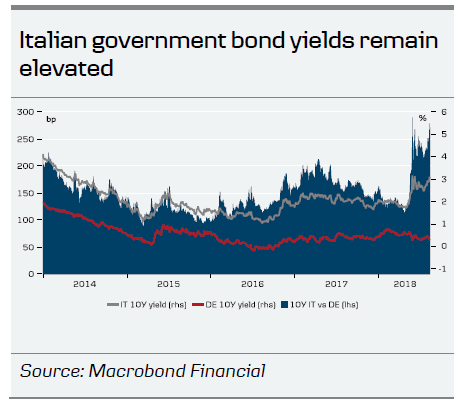
The focal points in the European bond markets at the moment are the uncertain situation in Turkey, the political situation in Italy and the global trade jitters. All three are an example of political developments that have surprised financial markets this year and might have an impact for an extended period of time, not only on financial markets but also the underlying economic developments.
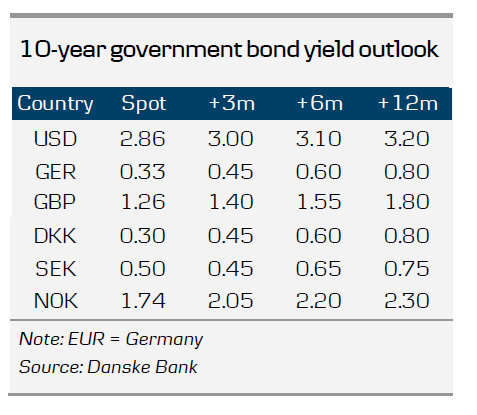
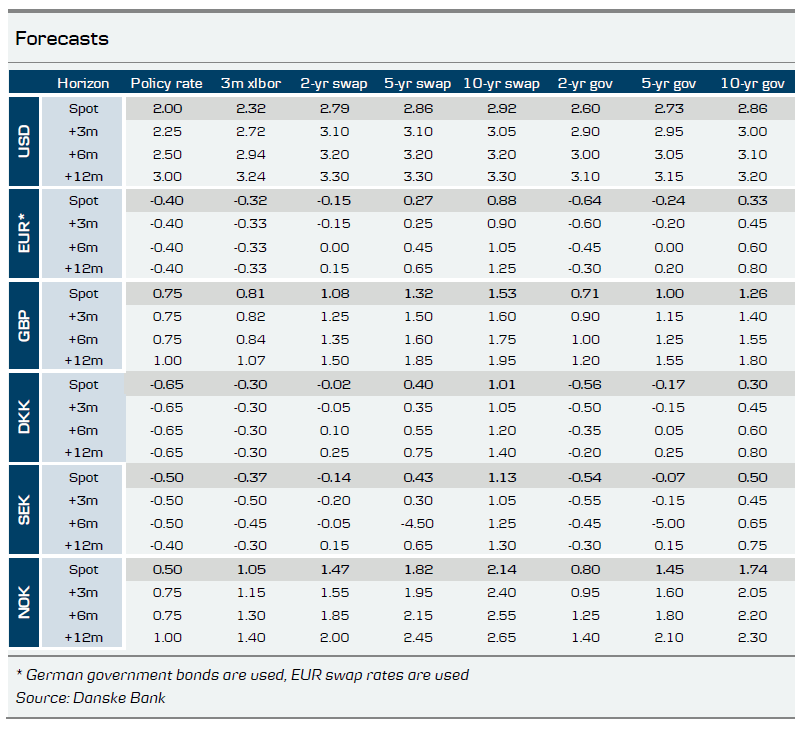
The result has been renewed support to core bond markets. German 10Y yields have once again traded with a yield as low as 0.30% and the first 10bp hike from the ECB is now priced very late 2019. The drop in German government bond yields has been mirrored in the Scandinavian markets given the strong underlying fundamentals of Denmark, Norway and Sweden. Lower bond yields have also dragged swap-rates lower though the drop in swap-rates has been slightly more modest as the asset-swap spreads have widened (bond yield vs swap rate).
But 10Y US Treasury yields have also seen a downward pressure over the past month despite the June rate hike by the FOMC and higher bond supply to fund the US fiscal deficit. Hence, the 3% level in US treasury yields has only briefly been tested.
The geo-political focus will eventually move into the background
However, we also know that financial markets will not be able to focus on these kinds of events for a prolonged period of time. If there is no material damage done to the underlying economy, focus will slowly move away from these ‘events’ and back to fundamentals. And the fundamental picture is, in our view, not damaged materially with the eurozone economy growing 0.4% in Q2 and PMI still well above the 50-level. The Fed is also still on track for two more rate hikes this year and it will take a genuine surprise for the ECB not to end its QE programme in December.
That said, Italy is probably an event that will continue to drive especially European bond markets in the autumn. The next focal point will be 27 September when the Economic and Financial Update will be released. It contains updated growth, debt and deficit projections. But also pivotal is the 15 October deadline for the submission of the budgetary plan to the EU Commission.
The big question is of course whether the Italian crisis is going to continue setting the agenda for the rest of 2018. There is a non-negligible risk that the new budget is very expansive, clearly breaking the 3% EU limit. In that case, the recent downward pressure on EUR and Scandi rates and yields might continue. If the crisis in Turkey evolves into a banking crisis, impacting Italian and Spanish banks, the impact could be similar. In these scenarios, our yield and rate forecasts are probably far too high
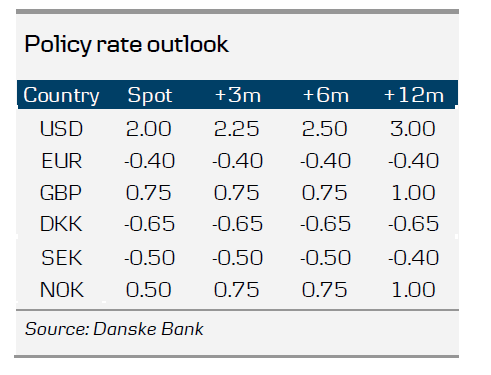
However, it might also be that the crisis dynamics have peaked. It could be that the Italian politicians soften the rhetoric and investors take advantage of the high yields the Italian market currently offers and we see a stabilisation in Italian yields and spreads. We will probably not move back to the spreads seen before the political jitters started and Italy might receive one or more rating downgrades. But importantly, Italy would not set the agenda every day and the safe-haven flows into German bond markets would ease and the market would slowly start to focus on the usual drivers for the fixed income market.
We have in this update assumed that the crisis dynamics in both Italy and Turkey have peaked and we have kept our yield forecasts more or less unchanged, though we have lowered our 12-month forecast slightly.
Importantly, we keep the view that Nordic/European 10Y rates and yields will not rise significantly in 2018 and that higher 10Y yields would be very much a 2019 story. We continue to hold the view that the ECB will not hike before December 2019, when Mario Draghi and other ‘dovish’ members have left the ECB.
Wider spread between USD and EUR rates
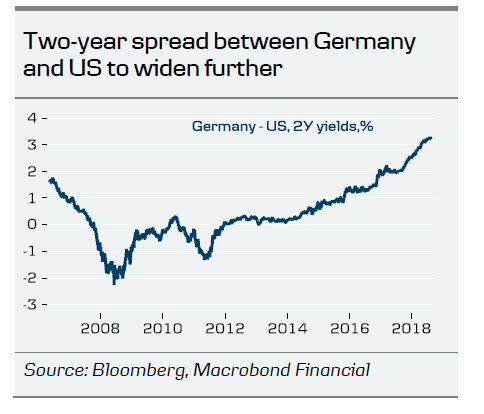
We continue to see a further widening of the two-year spread between USD and EUR rates. We expect the Fed to hike two more times this year and continue to hike next year. Importantly, we still expect the Fed to raise the Fed funds rate above the longer run dot of 2.83% (the Fed’s estimate of the natural rate of interest when the economy is normalised) in coming years. We see a peak at 3.25% in 2020.
Flatter US curve
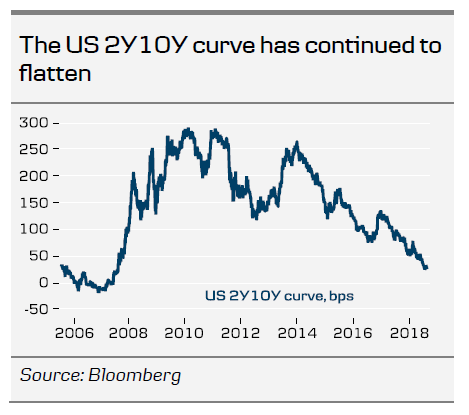
Over the past couple of years we have witnessed a pronounced flattening of the US curve, where 2s10s have moved from 125bp at the beginning of 2017 to currently around 26bp. It is well known both in academia and in financial markets that an inversion of the yield curve over the past 50 years has been able to predict a recession in one to two years time. Hence, the inversion itself can impact how the market is pricing its Fed funds expectations and in the end also impact actual monetary policy. If the curve were to invert, the Fed would probably be more reluctant to hike rates.
We do not forecast an inversion of the 2Y10Y curve in treasuries on a 12M horizon, as we expect the market to price a very flat to inverted money market curve keeping 2Y yields in check after all. The market is hardly likely to price the Fed hikes we forecast beyond our 12M forecast horizon. Furthermore, we continue to hold the view that 10Y treasury yields will move above the 3% level in 2019, as the labour market remains tight and as the funding need continues to rise due to expansive US fiscal policy. But we expect the 2Y 10Y curve will be very flat and we should expect a lively discussion whether this is a signal that a new US recession is getting closer or not. We expect 10Y US Treasury yields to reach 3.20% on a 12-month horizon (previously 3.3%). The curve 2Y10Y is expected to flatten to just 10bp in 2019 and a temporary inversion is certainly not unlikely.
Our fixed income view – higher yields mainly an autumn 2019 story
We have lowered our 12M forecast for German 10Y yields to 0.8% from previously 1.0%. We continue to expect a steeper 2Y10Y German yield curve. The ECB still maintains a relatively tight grip on the short end of the curve, especially with the first ECB rate hike expected late in 2019.
We plan to publish the next issue of Yield Outlook in mid-September.
Eurozone forecasts
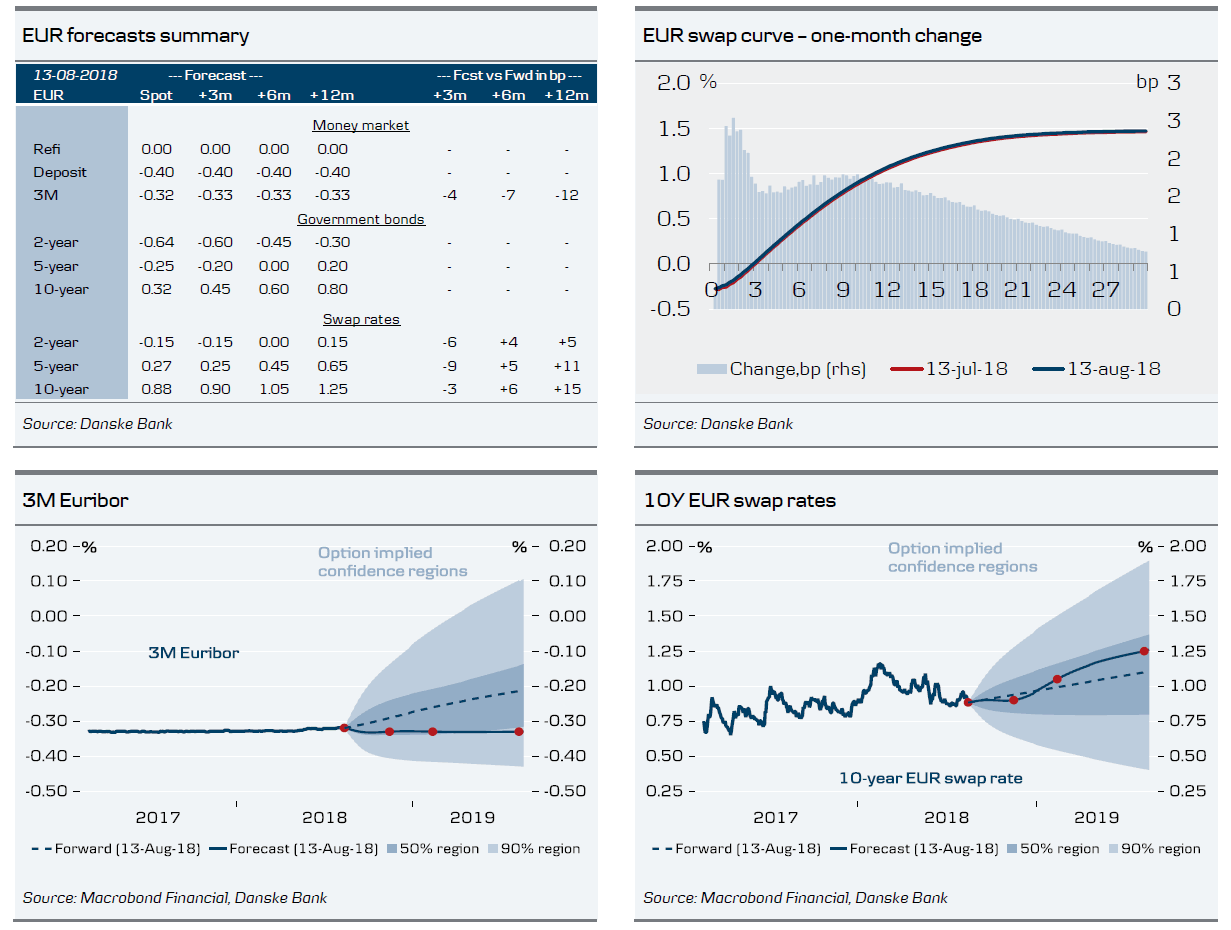
Although GDP growth in Q2 disappointed to the downside at 0.3% q/q, sentiment indicators such as PMI and Ifo have shown signs of stabilising as of late. With the EUUS trade spat put on hold for now, we see scope for business confidence to recover somewhat in H2 and still look for robust growth above potential of 2.0% in 2018 and 1.7% in 2019. Although the ECB has recently become more confident on the inflation outlook on the back of rising wages, we expect core inflation to rise only gradually throughout 2018 and 2019, also in light of the abating economic momentum and lingering downside risks to growth. We expect the first ECB hike of 20bp only in December 2019, while market pricing remains even more dovish (20bp by March 2020).
We still expect a steeper EUR yield curve on a 12M horizon. The ECB still maintains a relatively tight grip on the short end of the curve. However, this is not the case for the 10Y segment of the curve, which we expect to be pushed higher by rising US yields, the end of ECB QE from the ECB and the pricing of rate hikes in 2019/2020. That said, the demand for Germany is expected to stay higher and we have lowered our 12-month 10Y Germany forecast to 0.8% forecast from previously 1.0%. If the global trade dispute evolves further, it can weigh on risk sentiment and keep yields down
US forecasts
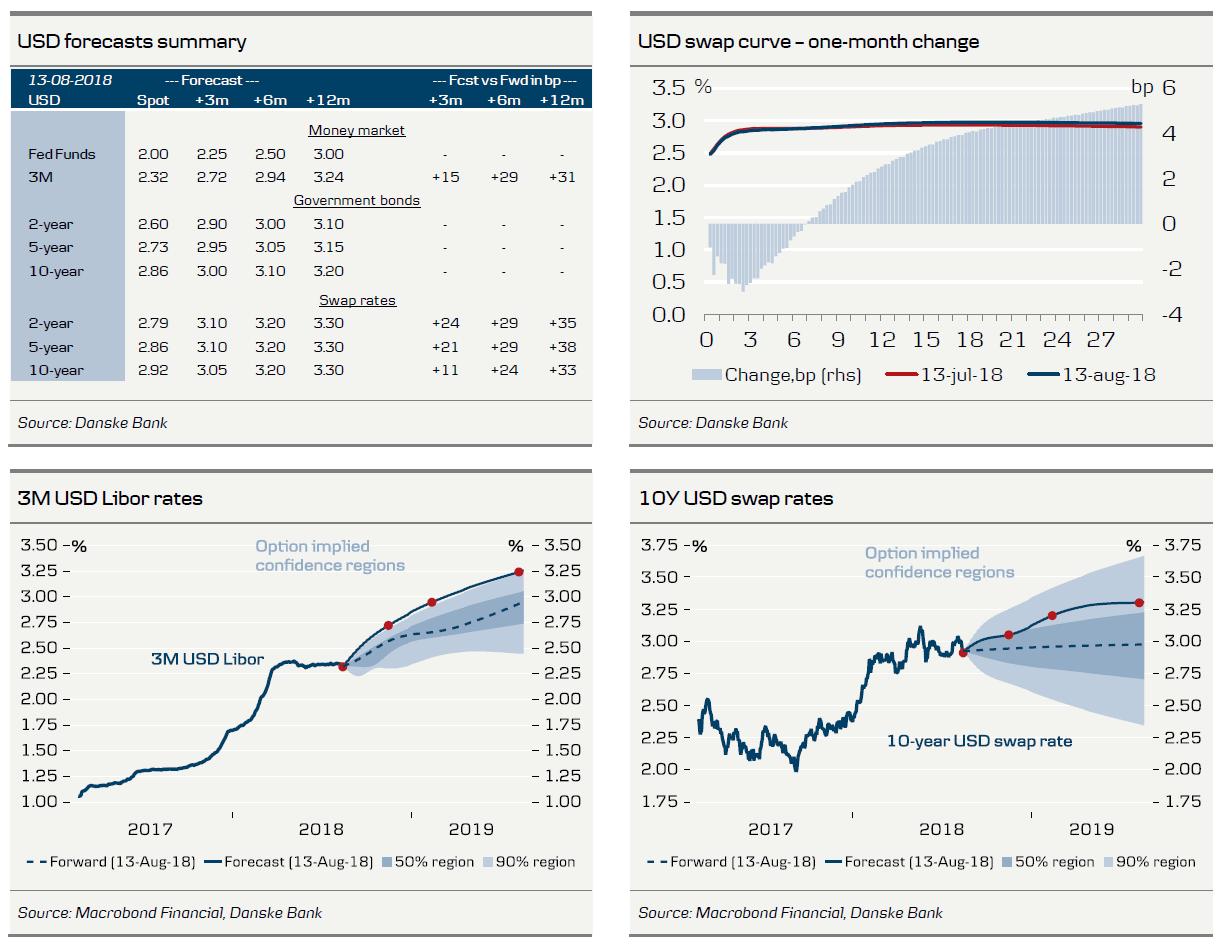
The Fed seems on track to deliver two more hikes this year (in September and December), which is also a consensus among analysts and priced by markets. Growth is strong, optimism is high, the unemployment rate is low, wage growth is increasing (although at a gradual pace) and core inflation is running near the 2% target. We also expect the Fed to continue hiking next year, as the expansion seems to continue but the committee is monitoring the yield curve, as many FOMC members are concerned about an inversion, which is considered a good recession indicator.
We still see a case for both higher 2Y and 10Y yields. The short-end is pushed higher as our Fed rate path is not priced in the money market curve. In respect of the long-end, a modest repricing of the US term premium is expected. We also assume an effect on the yield level from the more expansive US fiscal policy, which has boosted US bond supply. However, we do not forecast an inversion of the 2Y10Y curve in treasuries on a 12M horizon, as we expect the market to price a very flat to inverted money market curve keeping 2Y yields in check after all. But the curve is set to be very flat and we should expect a lively discussion whether this is a signal that a new US recession is getting closer
UK forecasts
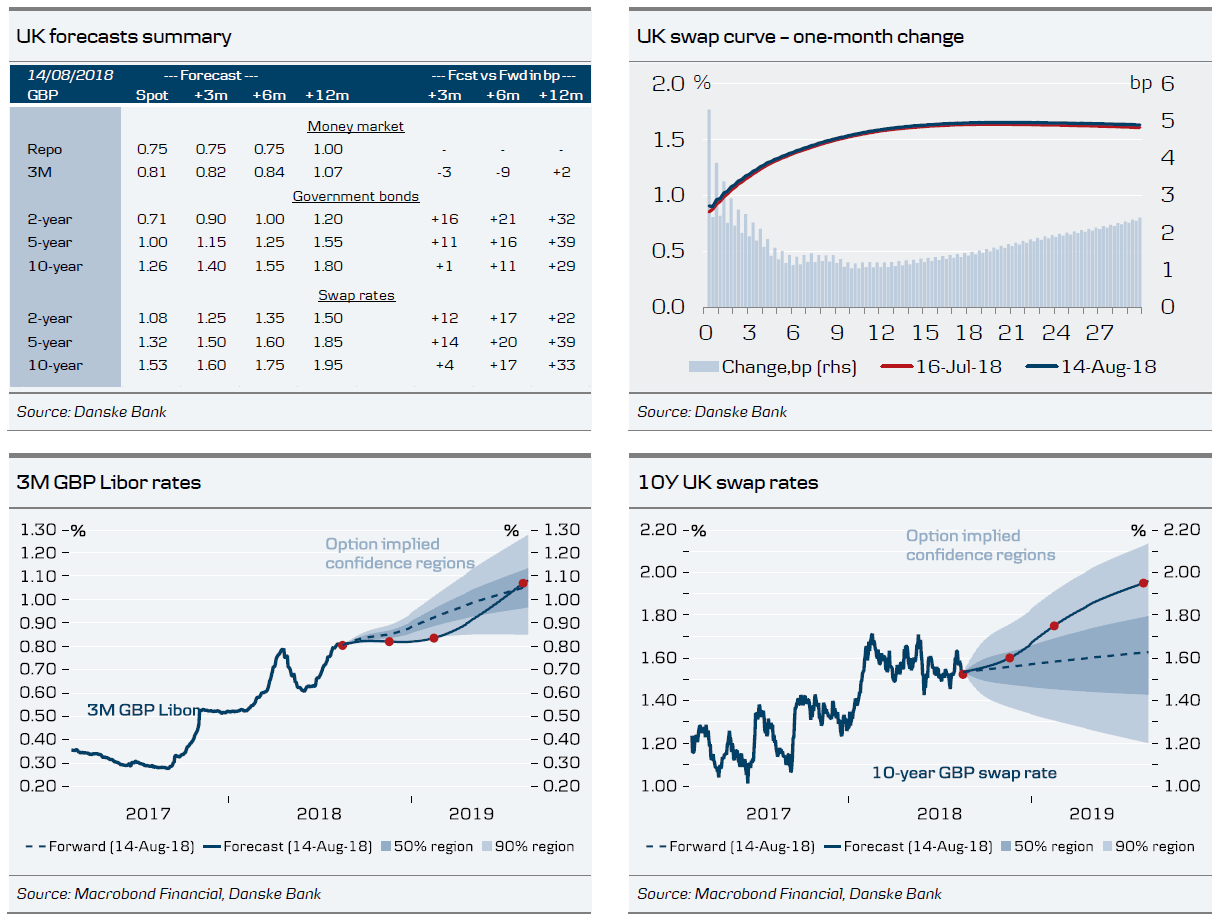
The Bank of England (BoE) increased the Bank Rate in August to 0.75% from 0.50%. The BoE thinks very much like the Federal Reserve, as it believes the strong growth and tighter labour market will lead to higher wage growth and hence underlying inflation pressure (Phillips curve thinking).
In relation to the natural rate of interest, the BoE did not provide much new information. We now know that the Bank of England expects it to rise to between 2-3% (nominal) in the long term but that it is lower in the short term, without saying how much lower. As the BoE has stated it will not start shrinking its balance sheet before the Bank Rate hits 1.5%, we guess it is around that level. Hence, the BoE can still hike the Bank Rate around three times from the current level of 0.75% before monetary policy becomes neutral. This fits well with our view that the Bank of England will continue to hike around once a year. This of course also depends on the Brexit outcome, where our base case is still an orderly Brexit. Our base case is that the next hike will come in May 2019.
The UK yield curve has flattened somewhat since the BoE meeting, and the market is now pricing that the 25bp hike in the Bank Rate will arrive in February 2020. Over the medium term, we generally forecast higher yields across the curve. With the BoE expected to continue to lift the front end in coming years, we look for a gradual flattening of the 2y 10y and 5y-10y yield curves.
Denmark forecasts
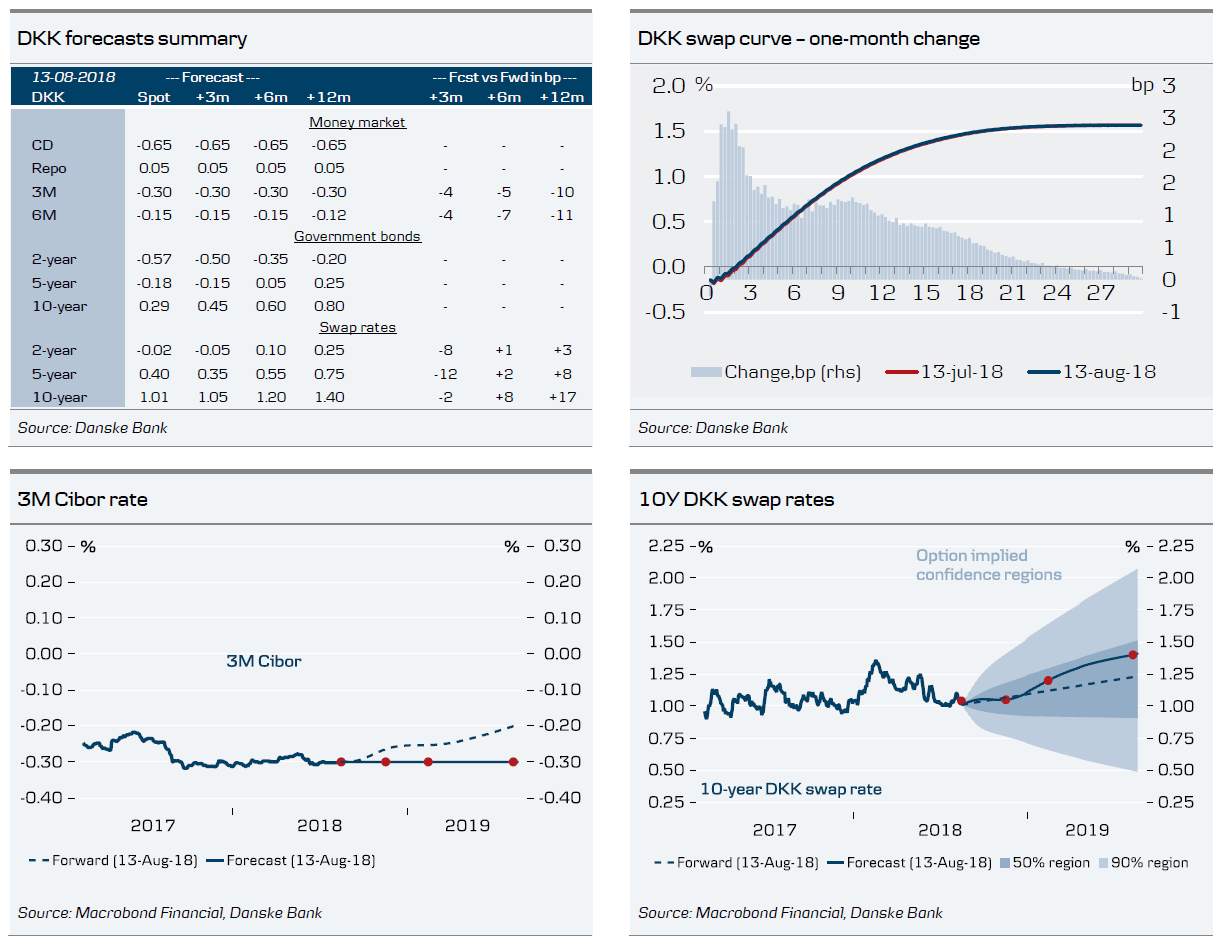
We do not expect any rate changes from the Danish central bank over the next 12 months. If anything, we could see the central bank intervening in the market to weaken the DKK, as fundamentals such as the significant current account surplus still tend to strengthen the DKK. We expect DKK fixings to remain at the current low level for the time being.
In the first quarter of 2019 we saw underperformance for Danish mortgage bonds as global yields moved higher, which spilled over to both the Danish swap and government bond market and we saw a spread widening versus German government bonds and EUR swaps.
This spread widening reversed in Q2 and we continue to expect a further spread tightening in 2018. We expect the 10Y spread versus Germany to reach zero. Foreign demand for Danish fixed income is pushing spreads tighter. For government bonds, the buybacks by the debt office funded by the government’s own cash buffer are also supporting the Danish fixed income market in 2018.
Sweden forecasts
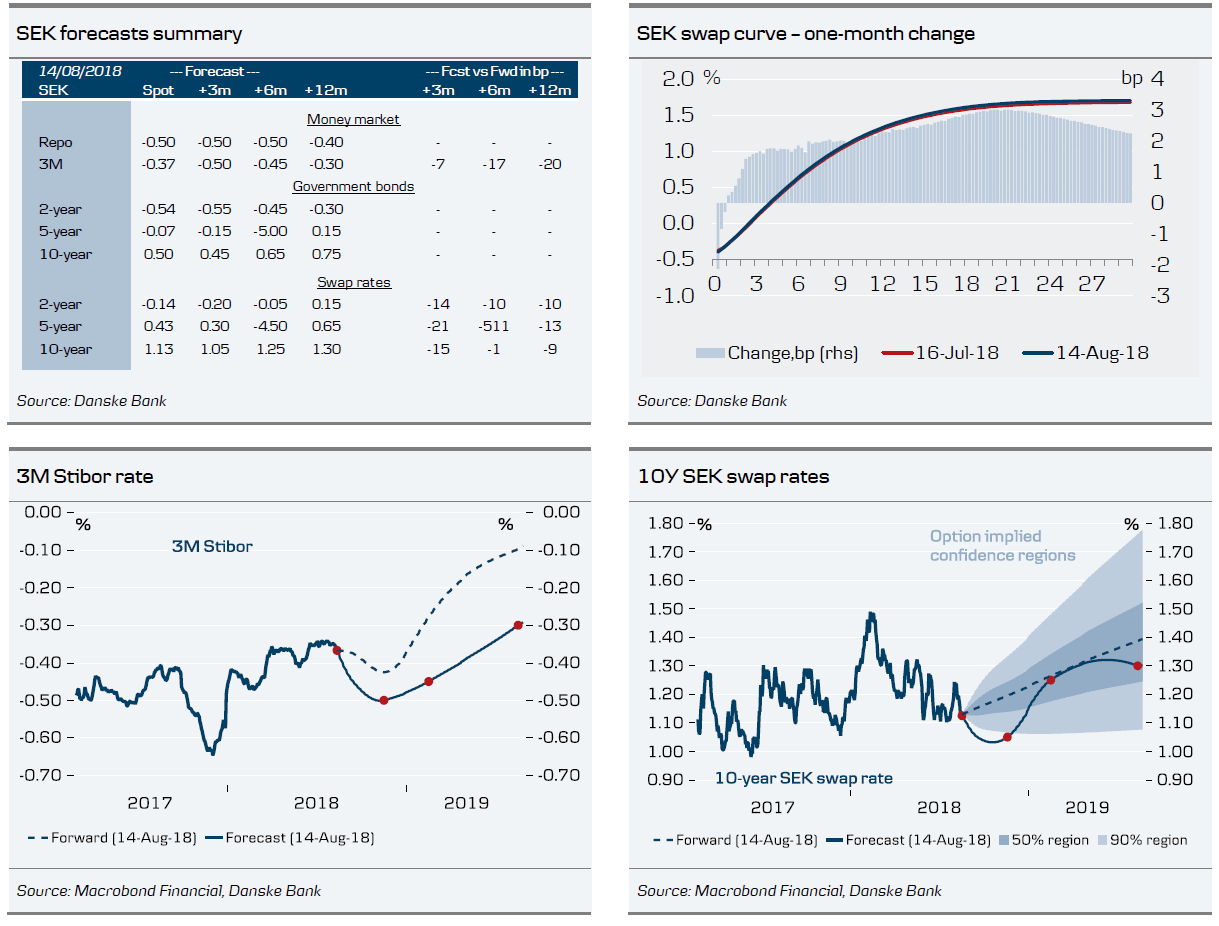
The Riksbank board is split on whether to look at headline or core inflation to gauge what is the appropriate policy rate path going forward, with the majority favouring the latter. Core inflation has not only been undershooting the Riksbank’s forecast again, but was also much too low at 1.3 % y/y in July, and we expect it to remain well below the target in both 2018 and 2019. Hence, we see chances as slim that Riksbank will actually raise the repo rate in October or December as spelled out in the July monetary policy report. That is more likely to happen in tandem with the ECB further down the road. Swedish economic growth has remained above 3% in the first half of 2018, but is expected to slow below trend on the back of the correction in the housing market.
We keep our mid-term view for somewhat flatter curves. Despite expecting CPIF inflation to remain around 2% throughout this year, we do not believe the Riksbank will hike in 2018. However, the ‘high’ inflation could keep short rates stable. Longer rates however are more guided by the growth outlook and in our view current consensus growth forecasts are too optimistic. The housing market is an ongoing issue and should give support to longer rates as we expect growth to gradually slow. That said, slightly higher EUR rates should also push longer-dated SEK rates higher.
Norway forecasts
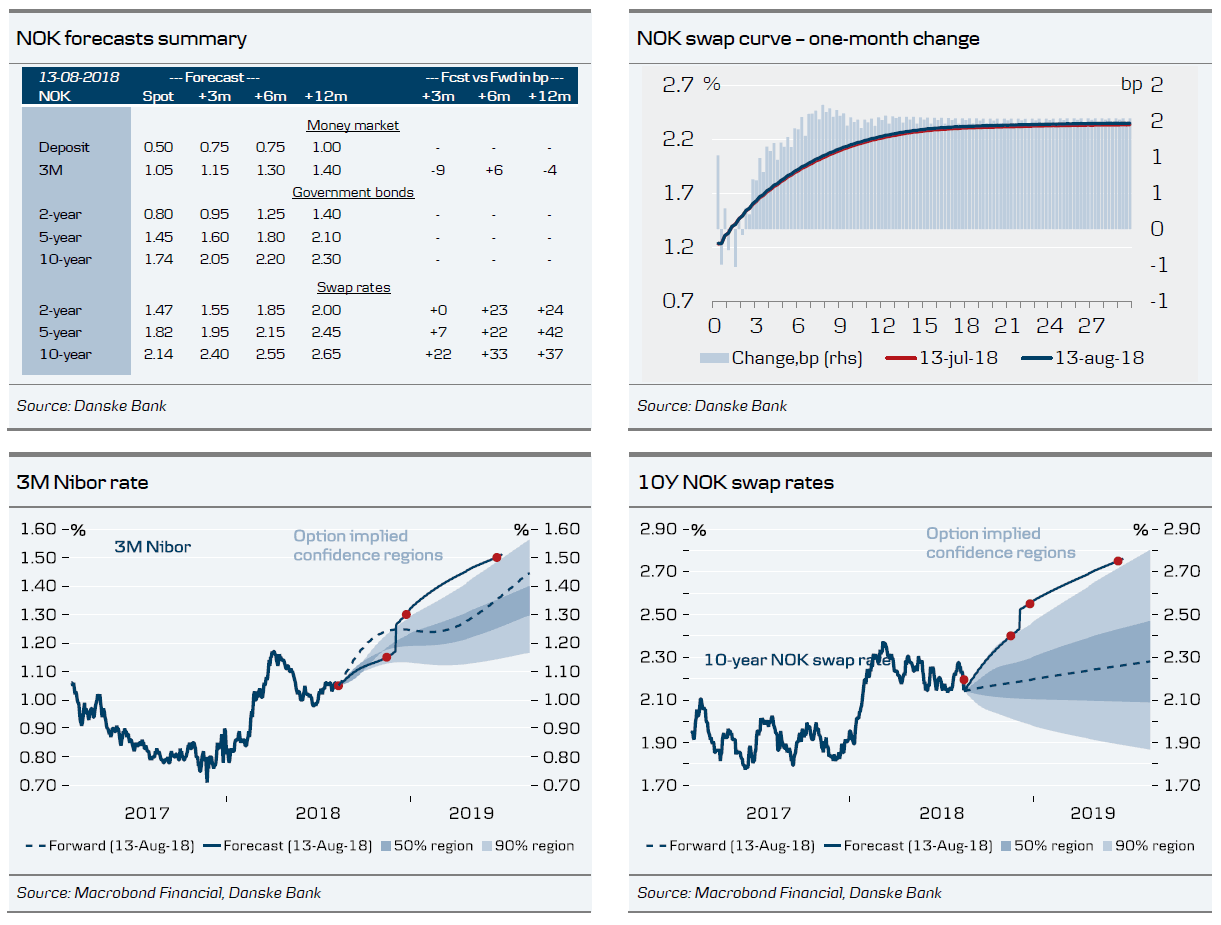
In the Monetary Policy Report 2/18, on 21 June, Norges Bank expressed that “… the key policy rate will most likely be raised in September 2018”. Despite somewhat mixed economic data and international turmoil recently, we do not expect Norges Bank to back down on its plan to hike in September. Whereas a favourable domestic economic outlook suggests higher interest rates in the short end of the curve, the geopolitical turmoil has kept rates subdued during the summer.
Recent Norwegian data have been mixed. Core inflation was 1.4% y/y in June, above Norges Bank’s forecast of 1.2%. Adjusted for volatile airfares and food prices, ‘corecore’ inflation still seems to be increasing and is at present at 1.83%. Recent wage talks point to wage growth of around 3.0% for 2018. It appears the Norwegian Philips curve is alive and kicking.
We expect Norges Bank to hike the sight deposit rate by 25bp to 0.75% at the 20 September monetary policy meeting. In 2019, we expect two hikes of 25bp each in March and September. We expect 5Y and 10Y yields to widen slightly versus peers in 2018, as the Norwegian economy is improving slowly, higher wage growth versus international peers has become apparent and Norges Bank will hike according to its own projections whereas the ECB will stay on hold
Gold extends decline on Dollar strength, breaks 1190
On the back of broad based strength in Dollar, Gold's decline continues today and breaks 1190 handle to as low as 1188.42 so far. The down trend from 1365.24 is on track for 1172.06 fibonacci level. Daily RSI may indicate Gold is in oversold condition again. But based on current acceleration, RSI indeed suggests solid downside momentum. 1172.06 could be taken out without much hesitation and the next real hurdle is probably 1122.81 support. And in any case, near term outlook will remain bearish as long as 1217.20 resistance holds.
In the bigger picture, currently decline from 1365.24 is viewed as part of the long term sideway pattern from 1046.54 (2015 low). Sustained break of 61.8% retracement of 1046.64 to 1375.15 at 1172.06 will pave the way to 1046.54/1122.81 support zone. At this point, we're not expecting a break there to resume long term down trend yet. Hence, we'll look for bottoming signal below 1122.81.
Chinese Yuan in decline again, USDCNH heading to 7?
The Chinese Yuan is under renewed selling pressure again today. USD/CNH (offshore Yuan) rises to as high as 6.921 so far and breaks 6.912 resistance. The development is apparently dragging down Chinese stocks, with Shanghai SSE down -1.32% at the time of writing. Asian indices are all affected, with Nikkei down -0.38%, HK HSI down -1.52% and Singapore Strait Times down -0.21%. Australian Dollar also suggests deep selling, partly due to such development.
USD/CNH has been in steep rise since hitting a low at 6.2359, as trade tension between the US and China escalated. The next batches of tariffs will start next week and more are coming. The Chinese National Development and Reform Commission pledged today to work on meeting this year's 6.5% growth target. With usual way of interpreting Chinese rhetorics, it means they found it difficult to meet that target.
Now USD/CNH is on course to have a test on key resistance level at 6.9871, 2017 high. It remains to be seen if the government will intervene more aggressively. If the Yuan is solely moved by market forces, we see no reason why USD/CNH will not break 7 handle.
Australia consumer sentiment dipped -2.3% mom, wage price grew 0.6% qoq
Australia Westpac Melbourne Institute consumer sentiment dropped -2.3% to 103.6 in August, down from 106.1. The index pared back half of the "surprisingly strong gains in June to Jule" as the impact of government's tax cuts faded. The decline also came against the backdrop of rising global trade tension and housing markets correction in Sydney and Melbourne.
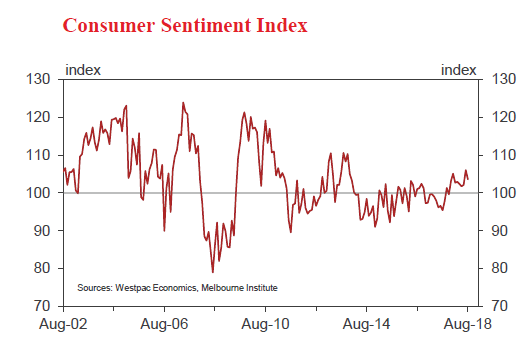
Westpac pointed out RBA's projection that inflation will hit 2.25% by 2020 and expects next move is up. It noted an "obvious headwind" for RBA is "the impact that five years of underperformance in inflation will have on households' and firms' expectations." And, "lower expectations will make it that much more difficult to lift inflation back into the band".
Westpac also noted that "certainly it will be quite some time before the Bank has a case to adjust the cash rate." And it maintains the view that RBA will be on whole in both 2018 and 2019.
Also from Australia, Wage price index rose 0.6% qoq, 2.1% yoy in Q2, in line with expectation. Private sector wage price grew 0.5% qoq, 2.0% yoy. Public sector wage grew 0.6% qoq, 2.4% yoy.
EUR/GBP Remains In Major Uptrend Above 0.8880
Key Highlights
- The Euro traded above the 0.9000 level recently before correcting lower against the British Pound.
- There is a crucial ascending channel in place with support at 0.8900 on the daily chart of GBP/USD.
- The Euro Area Gross Domestic Product for Q2 2018 (Prelim) posted a rise of 0.4% (QoQ), more than the forecast of 0.3%.
- Today, the UK Consumer Price Index for July 2018 will be released, which is forecasted to rise 2.5%.
EURGBP Technical Analysis
The Euro climbed higher this past week and broke the 0.8950 resistance against the British Pound. The EUR/GBP pair even broke the 0.9000 level before finding sellers near the 0.9030 level.
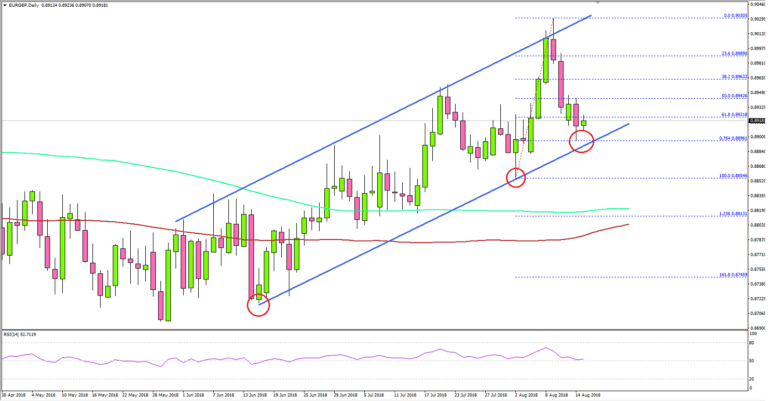
Looking at the daily chart, the pair formed a short-term top near the 0.9030 level and started a downside move. It dropped below the 0.8950 support and the 50% Fib retracement level of the last wave from the 0.8854 low to 0.9030 high.
However, the pair remains well supported above the 0.8880-0.8900 zone. More importantly, there is a crucial ascending channel in place with support at 0.8900 on the same chart.
The pair is also trading well above the 0.8800 pivot level and the 100-day simple moving average (red). Therefore, as long as the pair is above the 0.8880 support zone, it could resume its upside below.
On the other hand, a break below the ascending channel and the 0.8880 support could drift the pair towards the 0.8800-0.8810 support zone.
On the upside, an initial resistance is near the 0.8960 level, above which, the price could revisit the 0.9000 resistance area.
Recently, the Euro Area Gross Domestic Product reading for Q2 2018 (Prelim) was released by the Eurostat. The market was looking for a 0.3% growth in the GDP in Q2 2018 compared with the previous quarter.
However, the result was better as the Euro Area’s seasonally adjusted GDP rose by 0.4%. The yearly change was +2.2%, more than the forecast of 2.1%.
The result was positive, but it failed to help the EUR/USD pair as it stayed below the 1.1420-1.1430 resistance. Moreover, the GBP/USD pair struggled to break the 1.2820 resistance and remained in a bearish zone.
Economic Releases to Watch Today
- US Retail Sales July 2018 (MoM) – Forecast +0.1%, versus +0.5% previous.
- US Industrial Production July 2018 (MoM) – Forecast +0.3%, versus +0.6% previous.
- US Capacity Utilization July 2018 – Forecast 78.2%, versus 78.0% previous.
- UK Consumer Price Index July 2018 (YoY) – Forecast +2.5%, versus +2.4% previous.
- UK Core Consumer Price Index July 2018 (YoY) – Forecast +1.9%, versus +1.9% previous.
US Dollar Muscles Higher
The US dollar put in an impressive performance Tuesday even as the Turkish lira rebounded. The Canadian dollar was the top performer while the euro lagged. UK CPI is due out later but first it's Australian wage data. Besides buying USD, shorting indices seems to be the path of least resistance. A new Premium trade was posted earlier today, backed by the chart below.
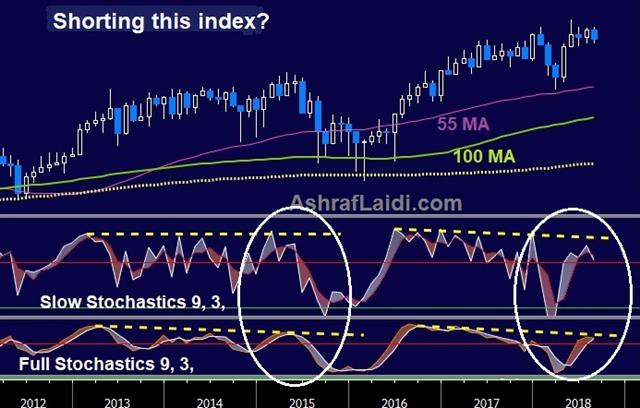
The US dollar muscled its way higher against most of the market on Tuesday in an impressive showing. Risk assets were strong and the Turkish lira rebounded 8% but that didn't halt the dollar's advance. Part of the thinking is that the lack of contagion, at least so far, clears another hurdle for the Fed to hike rates twice more this year.
Another line of thinking is that if there is contagion, it's going to hurt European banks and by extension hurt EUR/USD. The euro chart continues to break down and hit a 1.1340 in a drop the lowest since July 2017.
Economic data was limited to import/export prices. US import costs were down 0.1% m/m and exports down 0.5% m/m in a sign that tariffs are still only impacting a small part of the economy.
The Canadian dollar was strong in part due to a comment from fin min Bill Morneau late on Monday that he was cautiously optimistic about a future deal on NAFTA.
Looking ahead, Australian Q2 wage data is due at 0130 GMT. Rate hikes aren't on the RBA's radar at the moment but the jobs market is tight. The consensus is for a 2.1% y/y rise in wages. We think that globally wage numbers bear close watching because there should be some correlation (or not) and that will help to solve many of the Phillips Curve arguments.
A data point that will spark a bigger market moves comes at 0830 GMT when the UK releases July CPI numbers. The consensus is for a 2.5% y/y rise. Note however that lower unemployment in the UK Tuesday was paired with soft wages and eventually Brexit concerns sent cable to a 14-month low of 1.2705. Watch out for more selling even if there's a CPI-inspired bounce.
Eco Data 8/15/18
[php_everywhere instance="1"]