

Sample Category Title
USDJPY Moves Back Inside Head And Shoulders
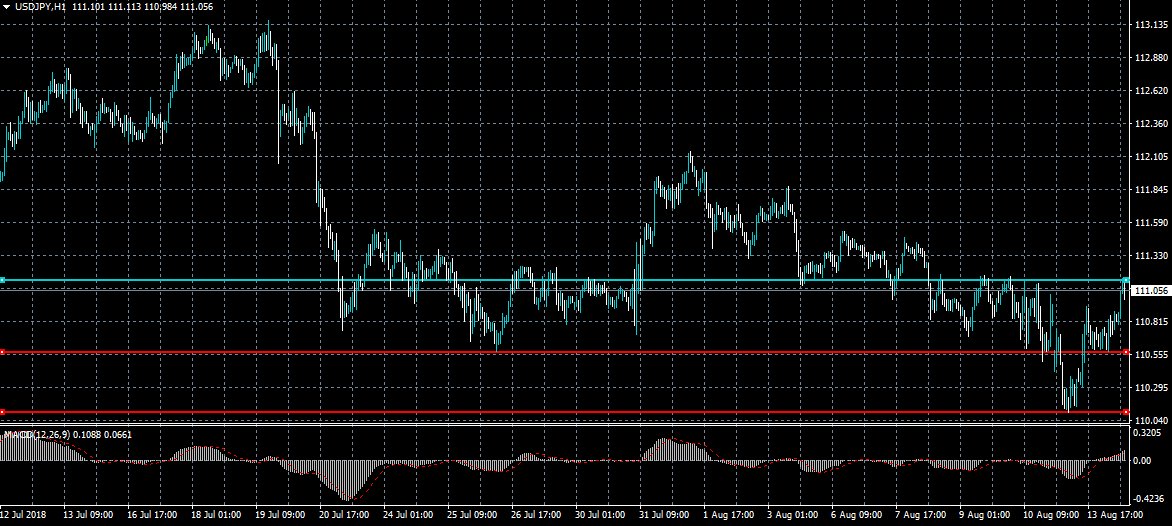
The US dollar has moved back above the 111.00 level against the Japanese yen on Tuesday after the Turkish central bank provided additional measures to assist the Turkish lira from falling. The USDJPY pair now trades back inside the bearish head and shoulders pattern, after moving above neckline resistance at 110.55. The overall market sentiment is starting to improve now, which supports traders buying riskier asset classes.
The USDJPY pair is only bearish while trading below the 110.55 level, key support is now found at the 110.10 and 109.56 levels.
If the USDJPY pair trades above the 111.10 level, buyers may test towards the 111.37 and 111.55 resistance levels.
GBPUSD Looks Past Record UK Unemployment
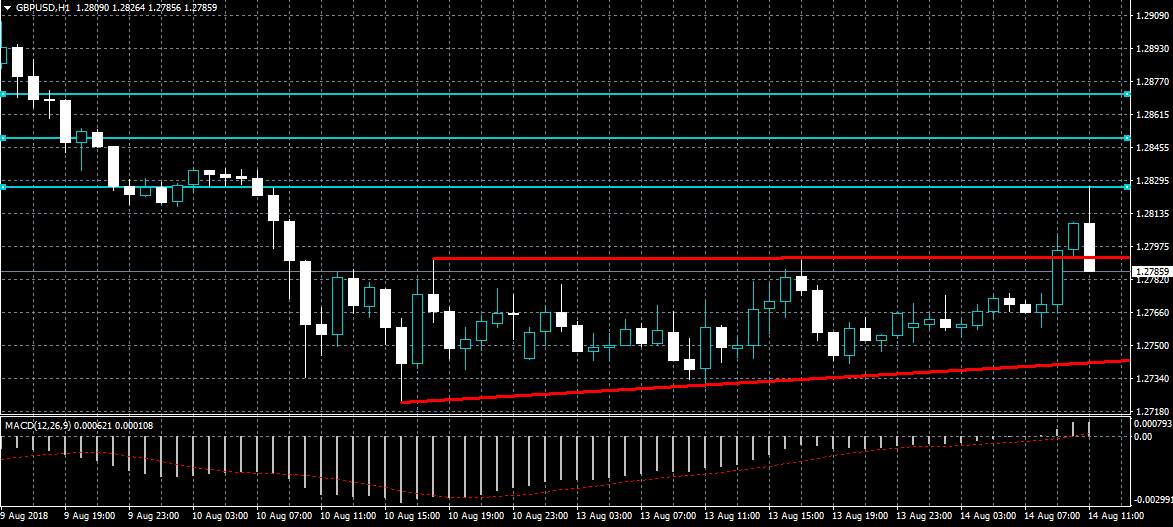
The British pound has reversed lower against the US dollar after briefly spiking towards the 1.2820 region after the UK economy released record low unemployment figures for the month of July. The GBP/USD pair risks further losses if the price falls below the 1.2770 level. The one-hour time frame also appears to show that a potential head and shoulders pattern may be forming after the early false break higher.
The GBPUSD pair is bearish while trading below the 1.2770 level, key support is found at the 1.2720 and 1.2700 levels.
If the GBPUSD pair moves above the 1.2800 resistance level, key intraday resistance is found at the 1.2820 and 1.2850 levels.
Technical Analysis: German DAX, UK FTSE100, IBEX & Stox 50
- DAX may move lower
- FTSE 100 boring as hell
- IBEX below its important SMA
- STOX50 bearish pattern complete
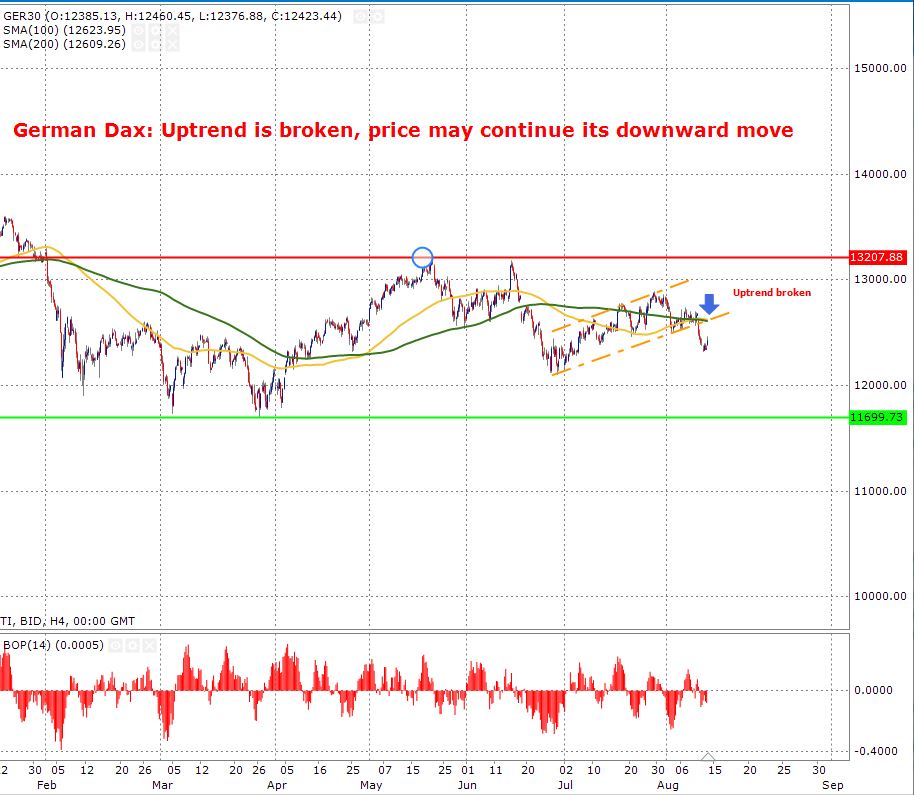
German Dax: Uptrend is broken, price may continue its downward move
German DAX could not maintain its upward move and it has broken its upward trend line. This is shown on the chart by the blue arrow. Moreover, the price is trading below the 100 and 200-day smooth moving average which confirms that the bears are in control of the price.
In terms of patterns, we have broken out of the upward channel and it is likely that the price may test the lower line of this upward channel.
The near-term support is at 11699 which was the low back in April 2018 and the resistance is at 13,207 which is the highest point the price reached back in June 2018.
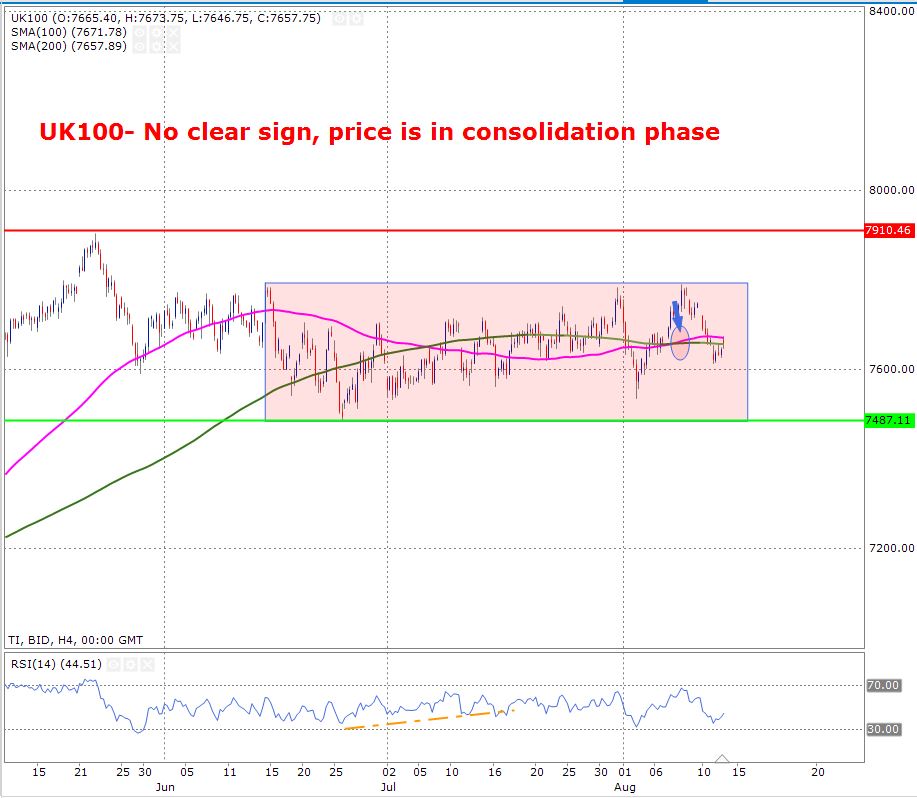
UK100- No clear sign, price is in consolidation phase
The FTSE 100 has the most boring price action. There is simply nothing exciting about this but having said this, the range base trading make it easier for the traders who do not like higher volatility. The price is trading in a range, the high of 7793 and the low is at 7484. The 100-day moving average has crossed the 200-day moving average from below which shows that the bulls have some strength and we may test the high of the rectangle which is shown on the chart. The RSI is also confirming bullish momentum.
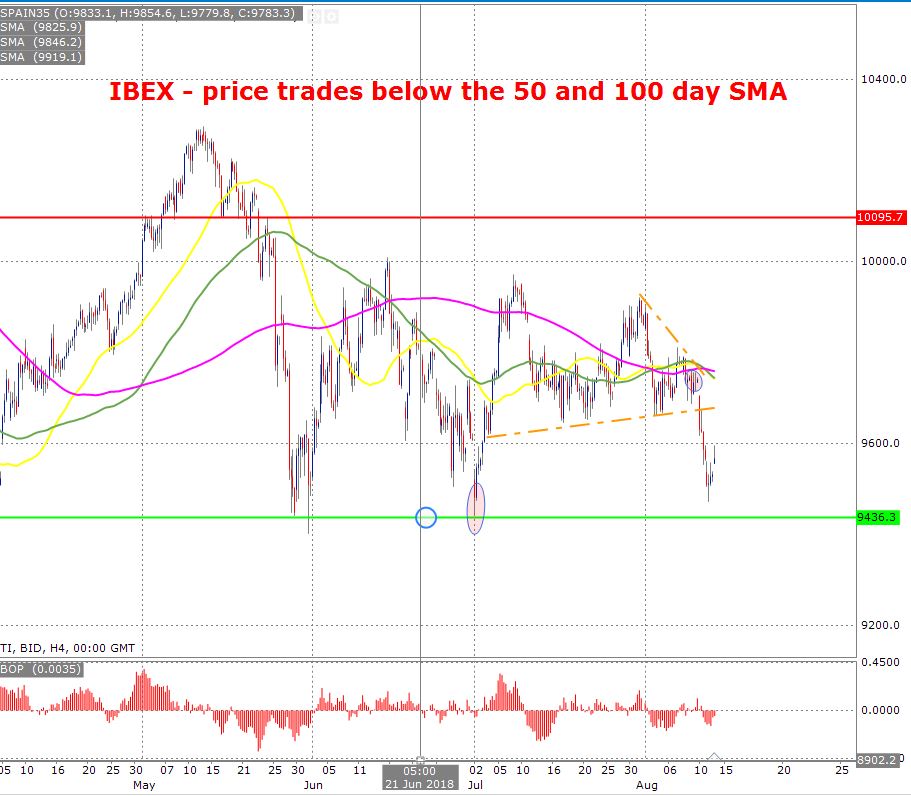
IBEX - price trades below the 50 and 100 day SMA
The IBEX has broken out of the ascending triangle pattern and it bounced back up from its support level. The support is at 9432 which is the low formed on the 2nd of July. The balance of power indicator, it shows who is in control of the price, confirms that the bears are losing their control. Looking at the intraday price action, the four chart confirms that the bulls are struggling as the recent candle is showing more bearish sign. If we break below the previous low of the 9471, it is likely that the bears will take over once again.
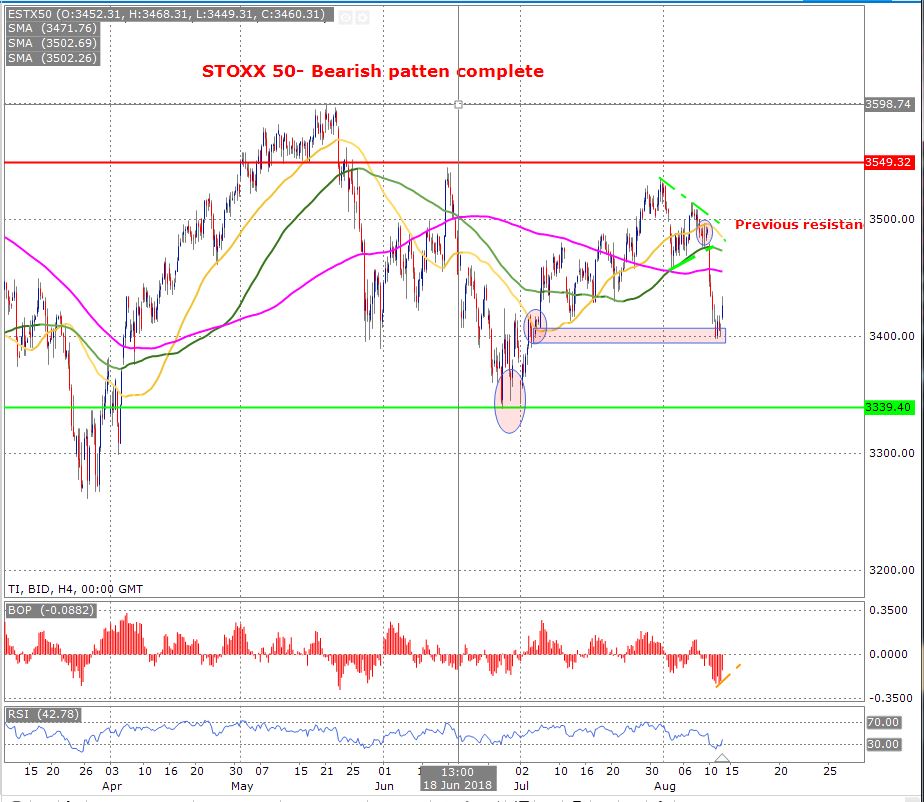
STOXX 50- Bearish patten complete
The Eurotox 50 has bounced back up from its previous support zone ( 3394-3407). This support zone fits well with the previous support zone which was formed on the 4th of July. This is where the bull rally started for the index. However, the price needs to break above the 100 and 200-day moving averages for it to move higher otherwise, the bias remain is to the downside.
Don’t Look At The Bad Side Of Gold | What Is Supporting Oil Price?
- Dark clouds are back again but look further than this
- The greenback is way overbought
- Oil price is firmly holding on to its gain
The perfect definition of tapering means that it keeps all the bull rallies for gold in check. The precious metal dropped below $1200, but the weakness in the dollar index helped the metal to rise above the $1200 yesterday. But the dark clouds are back and this has pushed the price of gold back down once again. One may say that golden days are over for gold and we are not going to see any bull rally and the gold price won't be touching the previous highs of $1400 or $1800. This a typical sentiment when the bears control the market.
But this would be completely wrong, the gold price is holding its ground really well, yes really well. You have to look deeper to see this and if you compare the price of gold when it dropped below $1000 (back in 2015) on the back of the tapering of US monetary policy. So, it may be not wrong to say that the price of gold is only mainly under pressure due to the strength in the dollar index and this it is still looking relatively more positive given that the Fed is in its final stages of bringing the interest rate back to its normal level.
Moreover, the greenback is way too overbought and the given the current stampede that we have experienced in the emerging market and the longest bull rally in the global equity markets, it is almost certain that the bearish trend for the gold price won't last forever. I think we are close enough to find the bottom. Also, the gold price being below 1200, also brings serious buyers in the market due to the psychological effect.
On the other hand, oil price is firmly holding on to its gain as investors are scratching their head when they see the oil production report from Saudi Arabia. It is in Saudi Arabia's interest to push the production higher especially if it wants to press Iran. Moreover, the US has also been supportive of higher production from the OPEC committee. Thus, it makes one's mind boggle when one looks at the Saudi oil production data. However, it is important to keep in mind that the Saudis need to keep the price of oil artificially higher by controlling supply because of the incoming Armco's IPO.
WTI Crude Oil Futures Advance Considerably Near 40-SMA In Near Term
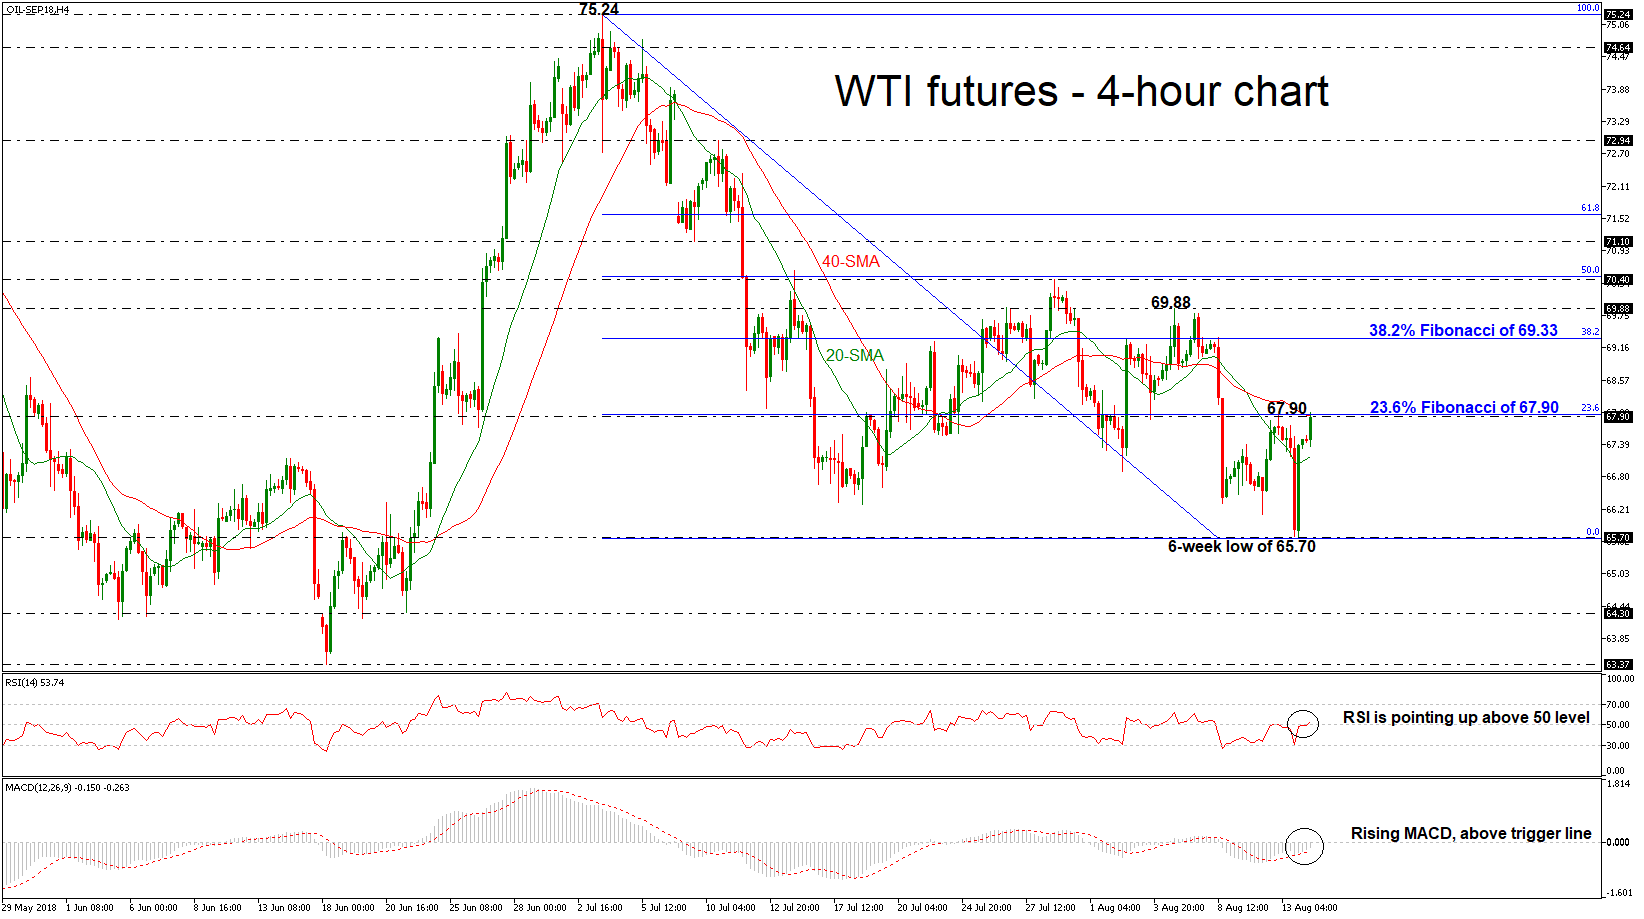
WTI futures resumed neutral mode in the short-term picture following the rebound on the six-week low of 65.70 on Monday’s session. The RSI and the MACD have both improved but remain near their neutral zones; the RSI is currently moving slightly above 50, while the MACD has deviated further above its red signal line but continues to hold below zero.
Should the price shift successfully above the 67.90 resistance level, which overlaps with the 40-simple moving average (SMA) and the 23.6% Fibonacci of the downleg from 75.24 to 65.70 in the 4-hour chart, traders could look for resistance at the 38.2% Fibonacci of 69.33. Moving higher, the next level to have in focus is 69.88 where bulls could push hard to extend the positive bias.
Alternatively, a decline could find support at the 20-SMA, around 67.17, where if the bearish moves appear stronger, the price could hit the 65.70 support. A failure to hold above this level could open the door for the 64.30 hurdle, taken from the low on June 21.
Having a look at the longer timeframe, oil prices have been developing lower since July 3, painting a bearish picture.
The Analytical Overview Of The Main Currency Pairs
The EUR/USD currency pair
Technical indicators of the currency pair:
Prev Open: 1.13721
Open: 1.14099
% chg. over the last day: +0.05
Day's range: 1.13949 – 1.14248
52 wk range: 1.0571 – 1.2557
The single currency recovered slightly after a sharp decline last week. Political tension between the US and Turkey is still in the spotlight. At the moment the EUR/USD quotations are consolidating. Local support and resistance levels are 1.14000 and 1.14300, respectively. We recommend opening positions from these marks. In the near future, we do not exclude the technical correction of the EUR/USD currency pair.
The news feed 14.08.2018:
Preliminary data on the GDP of the Eurozone at 12:00 (GMT+3:00);
ZEW economic sentiment index in Germany at 12:00 (GMT+3:00);
Export and import price indices in the USA at 15:30 (GMT+3:00).
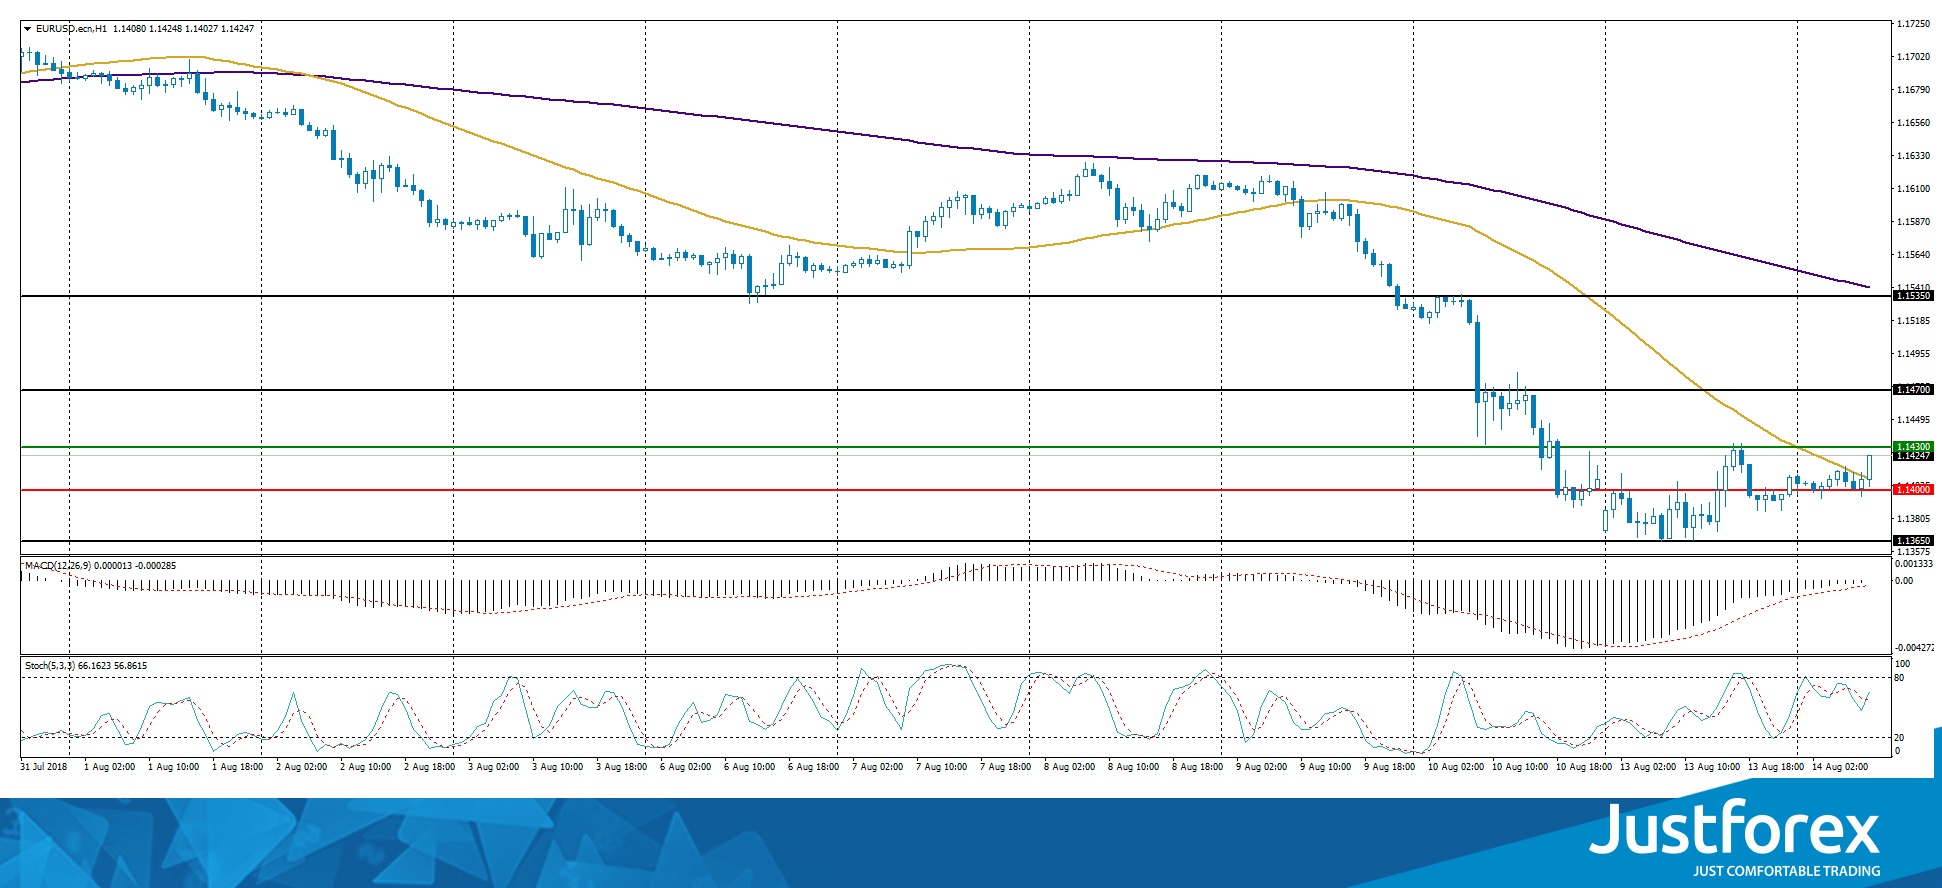
Indicators do not send accurate signals. The price has crossed 50 MA.
The MACD histogram is located near the 0 mark.
Stochastic Oscillator is in the neutral zone, the %K line is crossing the %D line. There are no signals at the moment.
Trading recommendations
Support levels: 1.14000, 1.13650
Resistance levels: 1.14300, 1.14700, 1.15350
If the price fixes above the resistance level of 1.14300, the correction of the EUR/USD currency pair is expected. The movement is tending to 1.14700-1.15000
Alternative option. If the price fixes below the round level of 1.14000, you need to look for entry points to the market to open short positions. The movement is tending to 1.13700-1.13500.
The GBP/USD currency pair
Technical indicators of the currency pair:
Prev Open: 1.27406
Open: 1.27577
% chg. over the last day: +0.03
Day's range: 1.27469 – 1.27988
52 wk range: 1.2361 – 1.4345
The GBP/USD currency pair is still consolidating. At the moment, the key support and resistance levels are: 1.27350 and 1.27900, respectively. In the near future, a technical correction is not ruled out. Participants in financial markets expect important statistics from the UK. Positions must be opened from the key levels.
At 11:30 (GMT+3:00) a report on the UK labor market will be published.
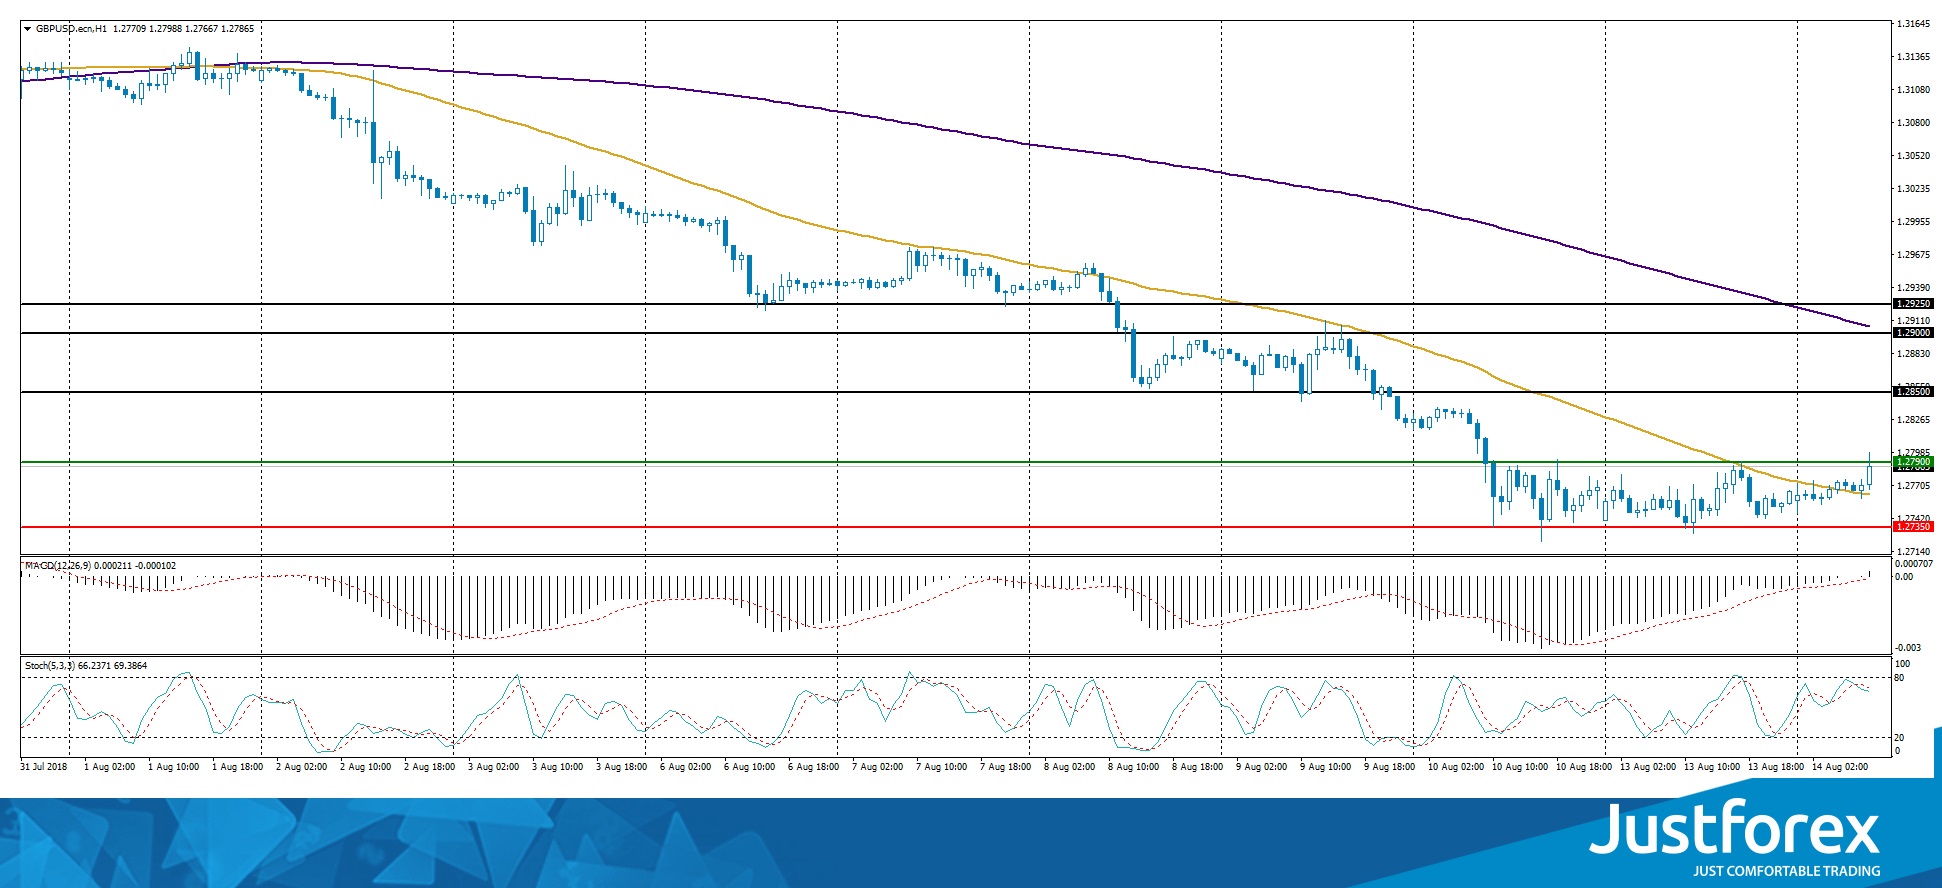
Indicators do not send accurate signals. The price has fixed between 50 MA and 200 MA.
The MACD histogram has begun to rise, indicating the power of the buyers.
Stochastic Oscillator is located in the neutral zone, the %K line is crossing the %D line. There are no signals at the moment.
Trading recommendations
Support levels: 1.27350, 1.27000
Resistance levels: 1.27900, 1.28500, 1.29000
If the price fixes above the 1.27900 mark, corrective movement is expected. The target level for profit taking is 1.28400-1.28500.
An alternative may be a decrease of GBP/USD to the level of 1.27400-1.27250.
The USD/CAD currency pair
Technical indicators of the currency pair:
Prev Open: 1.31601
Open: 1.31259
% chg. over the last day: -0.14
Day's range: 1.30905 – 1.31364
52 wk range: 1.2059 – 1.3795
At the moment, sales are prevailing on the USD/CAD currency pair. Quotations are testing the local demand zone of 1.30750-1.30900. The mark 1.31200 is already a "mirror" resistance. Participants in financial markets expect additional drivers. The trading instrument is tending to reduce. We recommend opening positions from key levels.
Today, the news feed on Canada's economy is calm.
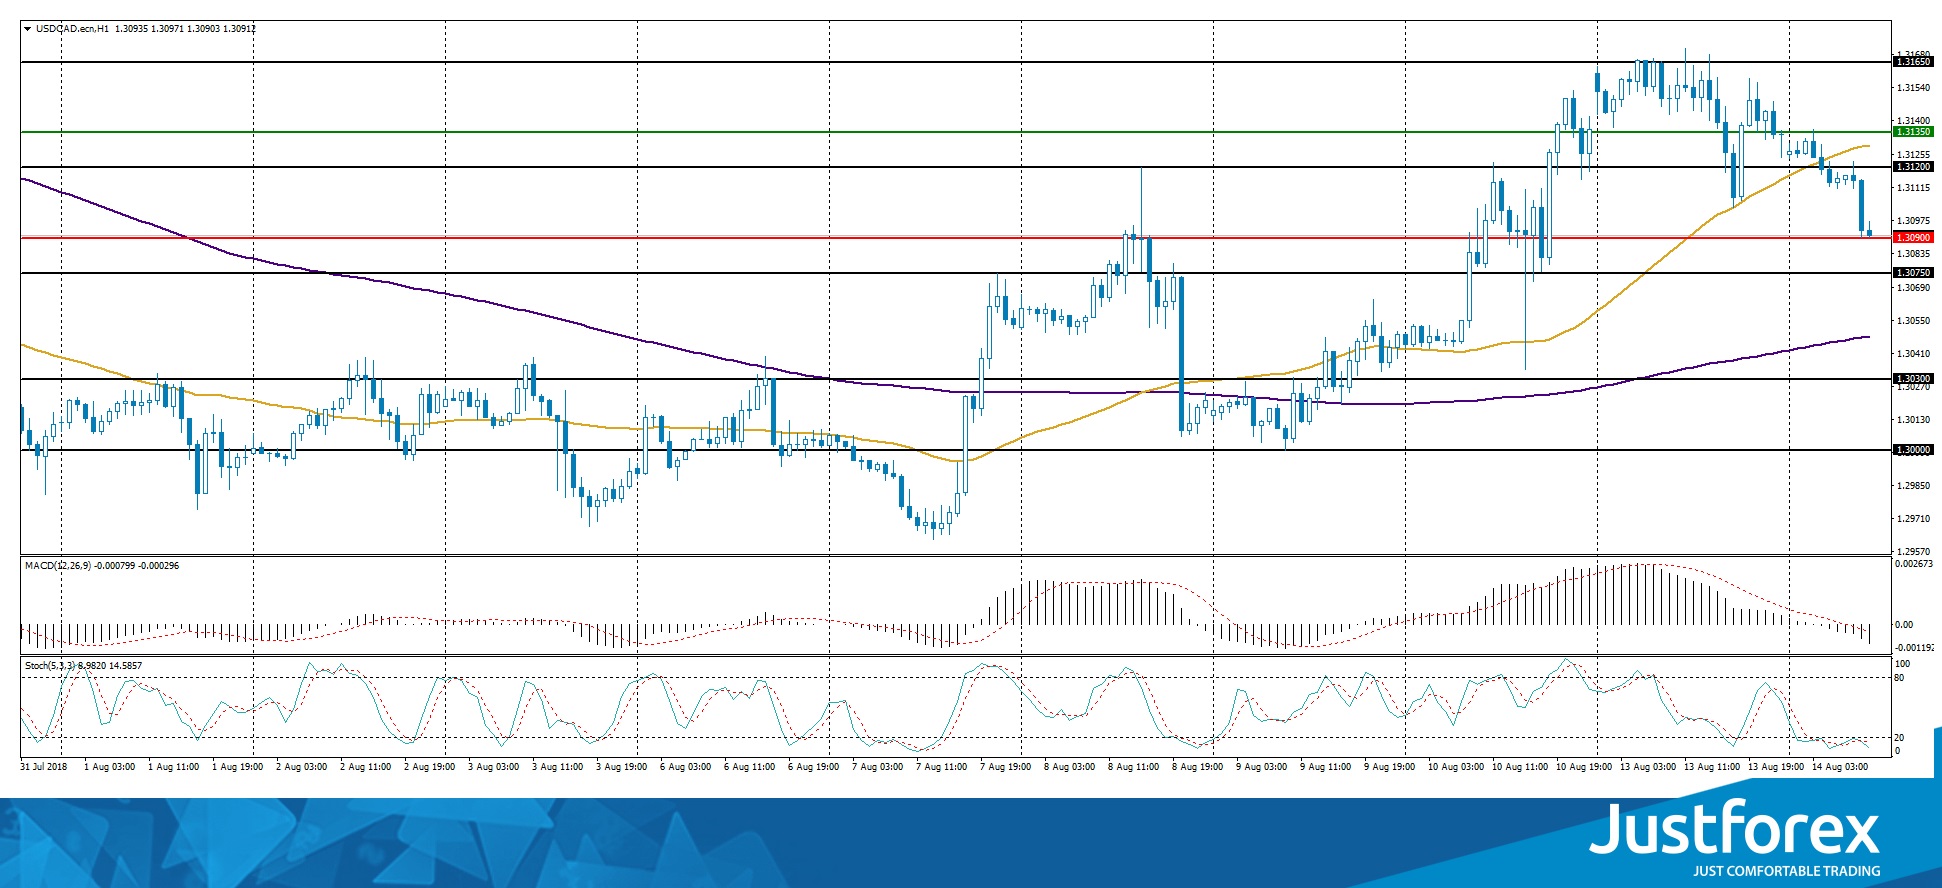
The price has fixed between 50 MA and 200 MA, which are strong dynamic levels of support and resistance.
The MACD histogram has moved to the negative zone and continues to decline, which signals the bearish sentiment.
Stochastic Oscillator is located in the oversold zone, the %K line is crossing the %D line. There are no signals at the moment.
Trading recommendations
Support levels: 1.30900, 1.30300, 1.30000
Resistance levels: 1.31200, 1.31650, 1.32000
If the price fixes below 1.30900, the USD/CAD quotes are expected to fall. The movement is tending to 1.30500-1.30300.
Alternative option. If the price fixes above 1.31350, it is necessary to consider buying USD/CAD. The movement is tending to 1.31600-1.31900.
The USD/JPY currency pair
Technical indicators of the currency pair:
Prev Open: 110.429
Open: 110.640
% chg. over the last day: +0.06
Day`s range: 110.586 – 111.152
52 wk range: 104.56 – 114.74
Since the beginning of this week, the bullish sentiment have been prevailing on the USD/JPY currency pair. At the moment, quotes are testing the key resistance of 111.150. The 110.800 mark is already a "mirror" support. The trading instrument is tending to grow. Positions must be opened from the key levels. We recommend you to pay attention to the dynamics of the US government bond yield.
In the Asian trading session weak data on the volume of industrial production in Japan has been published.
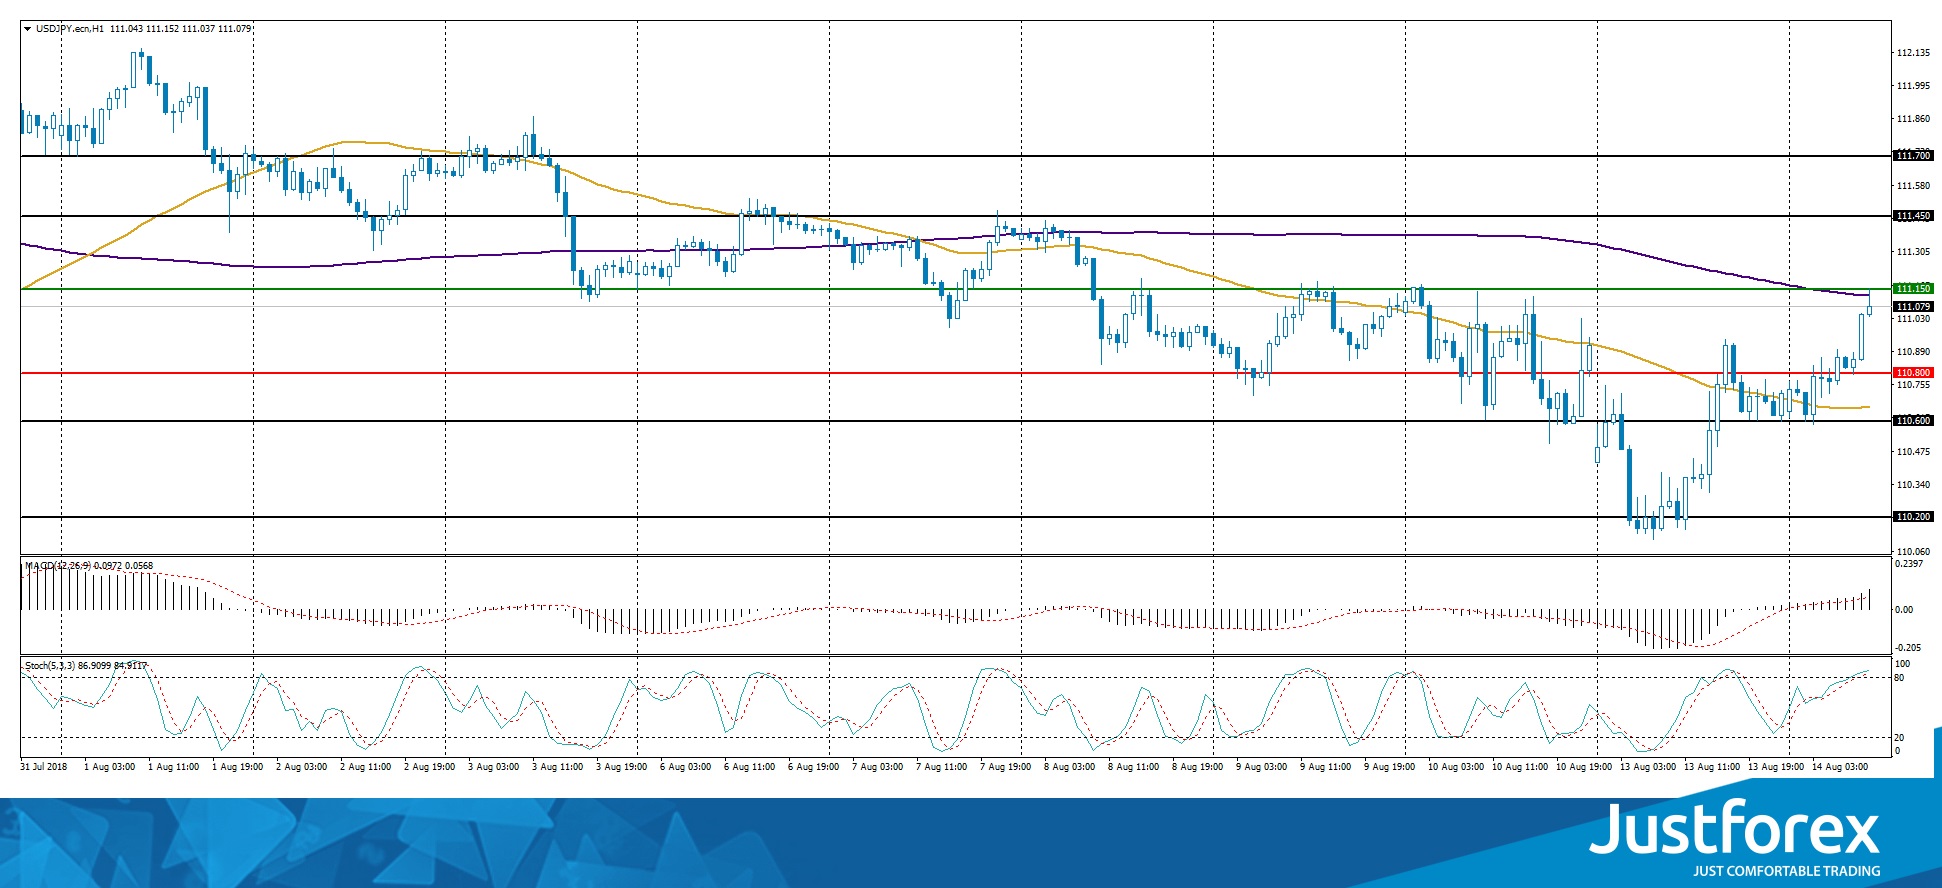
Indicators do not send accurate signals. The price has fixed between 50 MA and 200 MA.
The MACD histogram is in the positive zone and above the signal line, which gives a strong signal to buy USD/JPY.
Stochastic Oscillator is located in the overbought zone, the %K line is above the %D line, which gives a weak signal to buy USD/JPY.
Trading recommendations
Support levels: 110.800, 110.600, 110.200
Resistance levels: 111.150, 111.450, 111.700
If the price fixes above the resistance level of 111.150, further growth of the USD/JPY currency pair is expected. The movement is tending to 111.450-111.700.
Alternative option. If the price fixes below 110.800, sales of USD/JPY should be considered. The movement is tending to 110.400-110.200.
TRY Bounces Back As Risk Sentiment Stabilises
Turkey's bounce
As emerging-market currencies quake, now could be an opportunity to bargain hunt. Turkey has bounced back: the market has lost its appetite for pushing TRY further, as USD/TRY 1 month at-the-money volatility stands at a whopping 60. Argentina, Mexico and South Africa have regained lost ground, decelerating the rabid risk-off trade seen Monday. Argentina raised interest rates by 5% (seven-day notes at a record 45%) and announced it will sell USD 500 million to support the peso.
President Trump has shown his trademark pattern: threaten, and then back off. Overnight, top national security aide John Bolton warned Turkey there would be no negations until the US pastor is released. Despite pugnacious position by both sides, efforts are being made to reduce tensions. It's the only meaningful evidence to forecast USD/TRY's next move. Besides, a juicy 17.75% in nominal rates will attract speculators who view the current calm as a scalping opportunity.
Indian rupee soft amid contagion
USD/INR hit its historic high: currently at 69.83, it is expected to trade sideways near the 70 psychological resistance level. The Reserve Bank of India (RBI) decision to raise its Repo Rate for a second consecutive time on 1 August appears to have paid off. The decision was taken amid strong economic growth (GDP 7.40% for 2018) and increasing inflation numbers that are strongly driven by oil price volatility and INR weakness. Headline inflation in July remains at 4.17%, a slowdown from May's 5%.
As the Turkish lira is spooking emerging market currencies, the RBI will remain attentive and safeguard economic welfare by raising rates at its 4 October meeting. Additionally, core inflation in July remains at 6.29% (prior: 6.29%), too high for the RBI's liking.
Pound still soft
UK unemployment should fall further toward 4% (expect 4.1%). Wage growth should stagnate at 2.7%. Rising inflation should give the Bank of England confidence to raise rates in August. However, European growth concerns and Brexit uncertainty should keep the BoE sidelined for the rest of the year. We remain negative on sterling.
German ZEW improved after EU-US trade agreement, but outlook significantly less favorable than 6 months ago
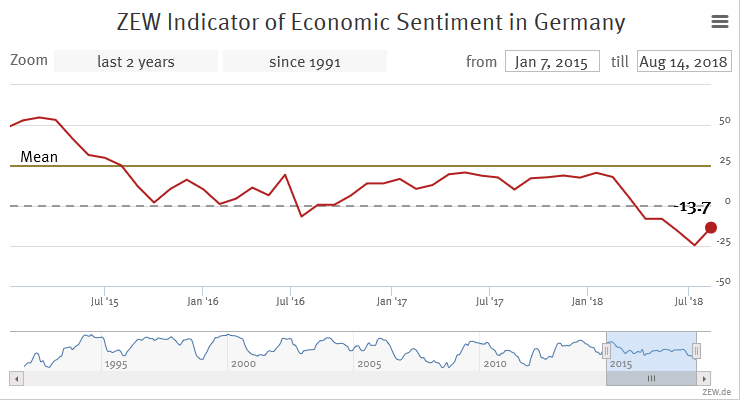
German ZEW Economic Sentiment rose to -13.7 in August, up from -24.7, beat expectation of -20.1. Current Situation rose to 72.6, up from 72.4 and beat expectation of 72.3
Eurozone ZEW Economic Sentiment rose to -11.1, up from -18.7 and beat expectation of -16.4. Current Situation dropped to 30.0, down from 36.2.
ZEW President Professor Achim Wambach said in the statement that "the recent agreement in the trade dispute between the EU and the United States has led to a considerable rise in expectations for Germany and also, to a lesser degree, for the Eurozone. However, the economic outlook for Germany is now significantly less favourable than it was six months ago."
Also released, Eurozone GDP grew 0.4% qoq in Q2, above expectation of 0.3% qoq. Industrial production dropped -0.7% mom in June, below expectation of -0.3% mom.
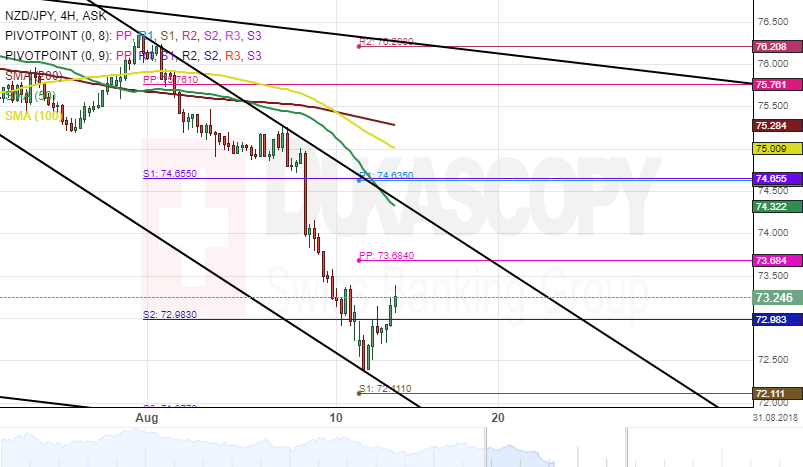
NZD/JPY 4H Chart: Decline Continues
The New Zealand Dollar has been weakening its position against the Japanese Yen since the end of July. This depreciation started when the pair reversed from the upper boundary of a descending channel. As a result, the Kiwi has been trading in a junior descending channel since the beginning of August.
Bears momentum were stable during the past few weeks and thus pushing the currency pair to a two-year low level at the 72.30 mark.
Technical indicators on the daily time-frame suggest that the bearish sentiment is likely to continue during the following trading sessions. The nearest barrier that could hinder the bearish momentum is at 72.11 formed by the weekly PP.
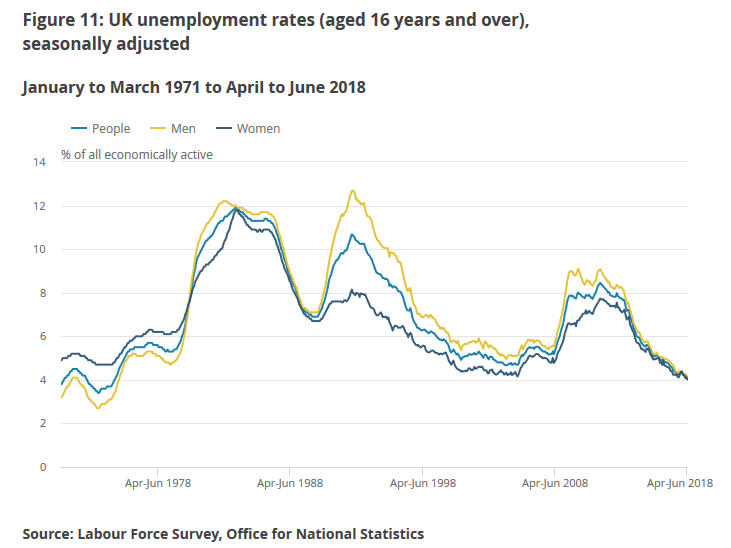
UK unemployment rate dropped to 43-year low, but wage growth slowed
Sterling recovers mildly after mixed job data, but upside is limited so far.
Unemployment rate dropped to 4.0% in the 3 months to June, down from 4.2% and beat expectation of 4.2%. That's also the lowest level in 43 years since the quarter to February 1972.
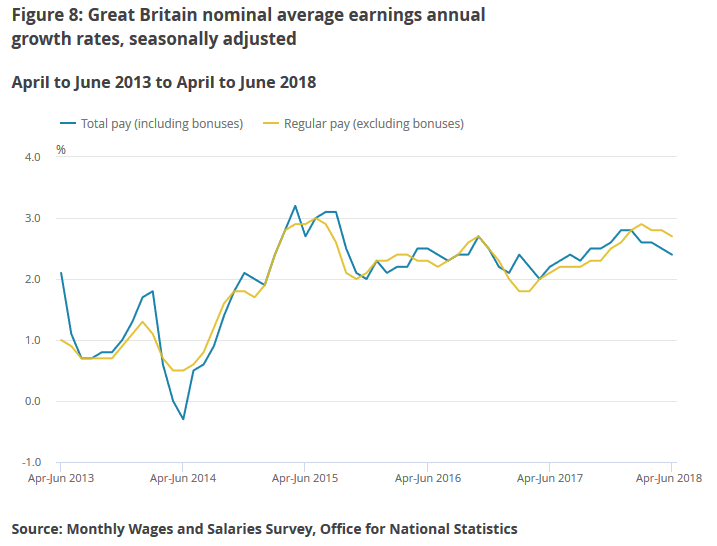
However, average weekly earnings including bonus slowed to 2.4% 3moy, down from 2.5% and missed expectation of 2.5%.
Average weekly earnings excluding bonus also slowed to 2.7%, down from 2.8% even though it beat expectation of 2.6%.
In July, claimant counts rose 6.2k, above expectation of 3.8k.