

Sample Category Title
USD/JPY Daily Outlook
Daily Pivots: (S1) 110.24; (P) 110.59; (R1) 111.07; More...
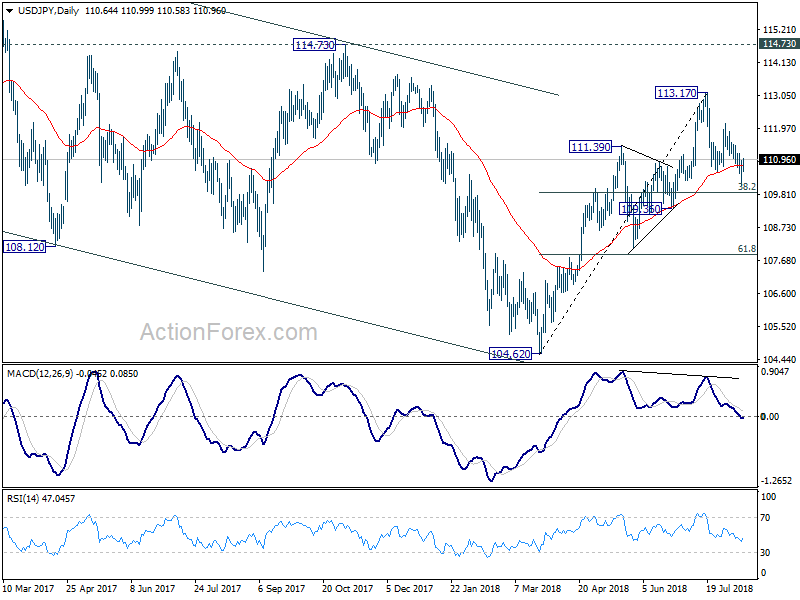
Intraday bias in USD/JPY remains neutral first. While the correction from 113.17 might still extend lower, we'd expect strong support from 38.2% retracement of 104.62 to 113.17 at 109.90 to contain downside and bring rebound. On the upside, above 111.17 minor resistance will turn bias back to the upside. Further break of 112.14 will bring retest of 113.17 high. However, firm break of 109.90 will put focus on 109.36 key structural support level.
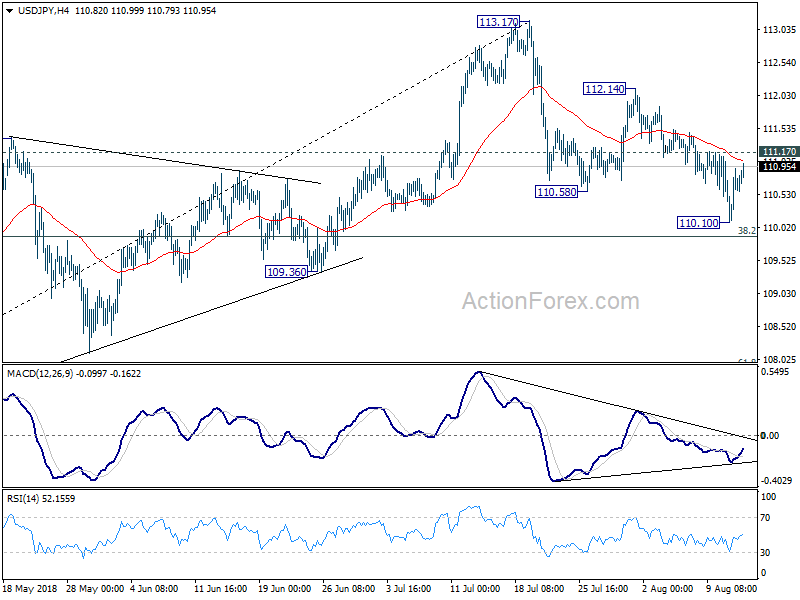
In the bigger picture, corrective fall from 118.65 (2016 high) should have completed with three waves down to 104.62. Decisive break of 114.73 resistance will likely resume whole rally from 98.97 (2016 low) to 100% projection of 98.97 to 118.65 from 104.62 at 124.30, which is reasonably close to 125.85 (2015 high). This will stay as the preferred case as long as 109.36 support holds.
USD/CAD Daily Outlook
Daily Pivots: (S1) 1.3066; (P) 1.3110; (R1) 1.3190; More...
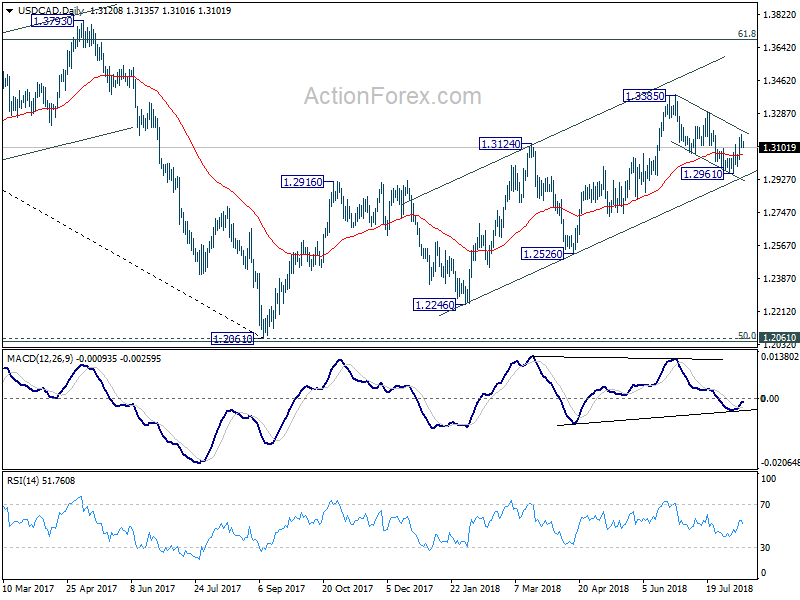
A temporary top is formed at 1.3170 as USD/CAD retreated ahead of near term channel resistance. Intraday bias is turned neutral first. Still, we'd favor another rise as long as 1.3035 minor support holds. The correction from 1.3385 should have completed with three waves down to 1.2961. Above 1.3170 will target 1.3289 resistance first. Break there will resume larger rise from 1.2061 through 1.3385 high. On the downside, though, break of 1.3035 minor support will dampen this bullish view and turn focus back to 1.2961 low.
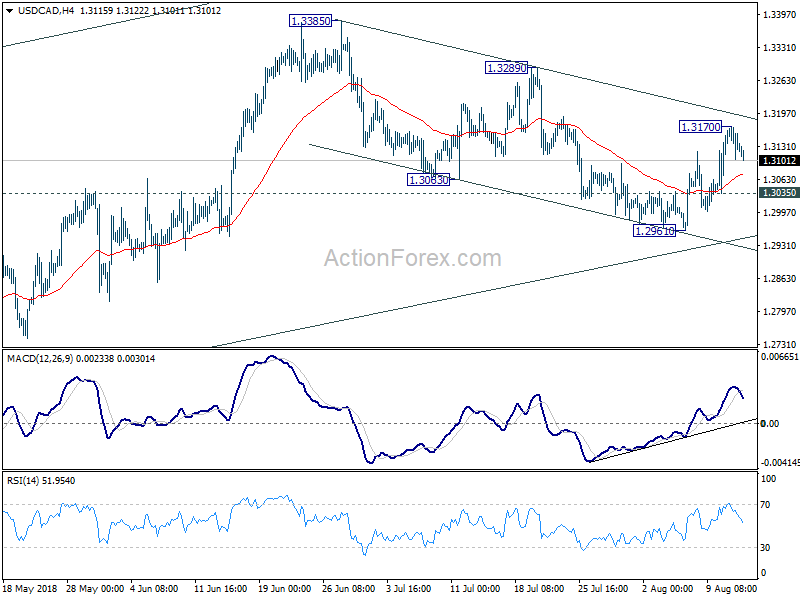
In the bigger picture, as long as channel support (now at 1.2944) holds, we're holding to the bullish view. That is, fall from 1.4689 (2015 high) has completed at 1.2061, ahead of 50% retracement of 0.9406 (2011 low) to 1.4689 (2015 high) at 1.2048. Further rally should be seen for 61.8% retracement of 1.4689 to 1.2061 at 1.3685 and above. However, sustained break of the channel support will argue that rise from 1.2061 has completed and will bring deeper fall to 1.2526 support to confirm.
AUD/USD Daily Outlook
Daily Pivots: (S1) 0.7252; (P) 0.7276; (R1) 0.7296; More...
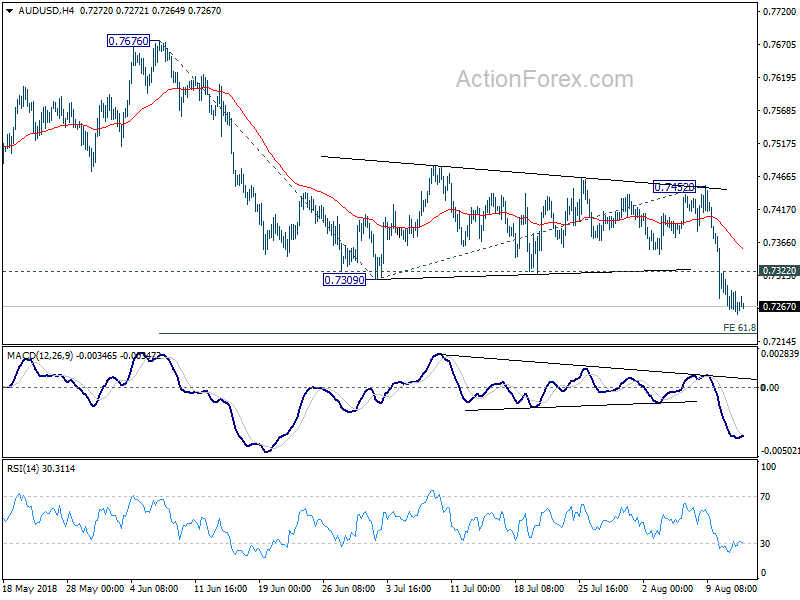
Intraday bias in AUD/USD remains on the downside with 0.7322 minor resistance intact. Current fall is part of the down trend from 0.8135 high. Deeper decline should be seen to 61.8% projection of 0.7676 to 0.7309 from 0.7452 at 0.7225 first. Break will target 100% projection at 0.7085 next. On the upside, above 0.7322 minor resistance will turn intraday bias and bring consolidation. But recovery should be limited below 0.7452 resistance to bring fall resumption.
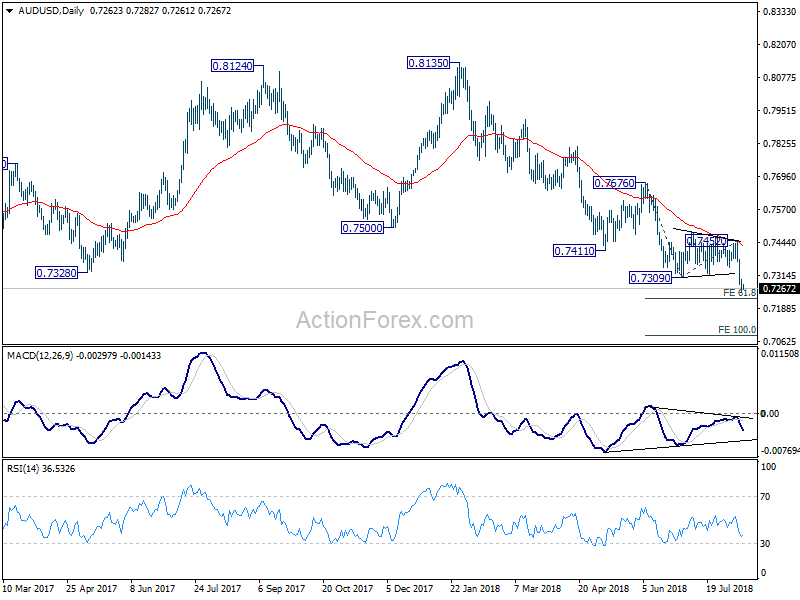
In the bigger picture, medium term rebound from 0.6826 (2016 low) is seen as a corrective move that should be completed at 0.8135. Sustained break of 0.7328 cluster support (61.8% retracement of 0.6826 to 0.8135 at 0.7326) should pave the way to retest 0.6826. There is prospect of resuming long term down trend from 1.1079 (2011 high). But we'll look at downside momentum to assess at a later stage. On the upside, break of 0.7452 resistance might indicate medium term bottoming. But we'll continue to favor the bearish view as long as 0.7676 resistance holds.
Dollar Ready to Take Control from Yen While Sentiments Remains Vulnerable
The forex markets are rather steady today. Turkish turmoil seemed to have passed its climax for the near term. Swiss Franc and Yen are trading lower as that part of risk aversion receded. Meanwhile, New Zealand, Canadian and Australian Dollar are generally higher, together with Sterling. Though, it remains to be seen if stock market selloff will extend for reasons other than Turkey. Meanwhile, we want to point out the relatively shallow retreat in Dollar against Euro, Sterling and Aussie so far. Gold's medium term down trend has just resumed and is set to take on 1190. They could be indications that Dollar might take over the driving seat from Yen in the next move.
While the trouble of Turkey Lira might be over temporarily, the stocks markets are still rather vulnerable. DOW closed down -0.50% at 25187.70 overnight. S&P 500 lost -0.40% and NASDAQ dropped -0.25%. S&P 500 has been losing much momentum ahead of 2827.82 record high, indicating risk of rejection. Similarly, NASDAQ also faces risk of rejection from 7933.31 record high. In Asia, Nikkei is benefiting from Yen's pull back and trades up 1.85% at the time of writing. But Hong Kong HSI is down -0.97%, China Shanghai SSE is down -0.45%, Singapore Strait Times is down -0.16%.
Technically, Yen crosses should have turned into near term consolidations, with risk of stronger recovery. The same applies for Swiss Franc crosses too. USD/CHF and USD/JPY will be two pairs to watch today. Break of 0.9984 in USD/CHF and 111.17 in USD/JPY will indicate near term strength in Dollar against the two safe-haven currencies. And that could prompt stronger rally in Dollar against others as the greenback regains control.
Australia NAB business conditions extended slide to 14, confidence recovered
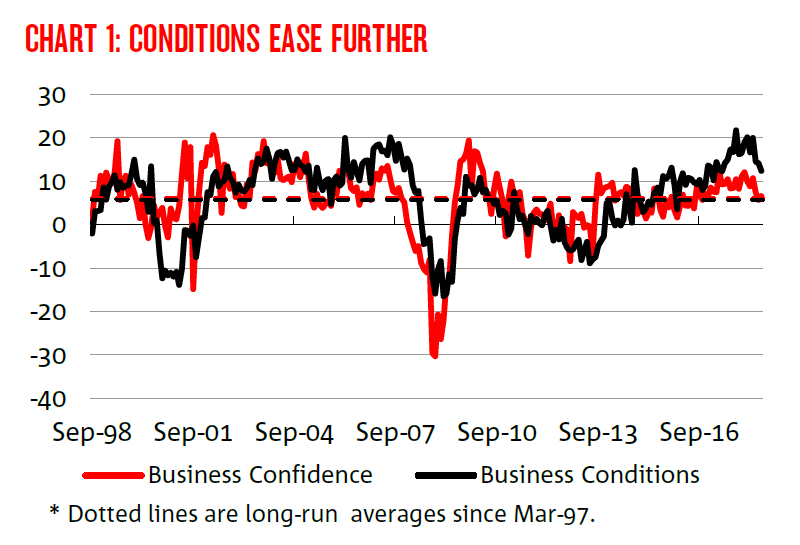
Australia NAB business conditions dropped -2pts to 14 in July. Business confidence rose 1pt to 7. Alan Oster, NAB Group Chief Economist noted in the release that the business conditions index "has now fallen considerably since April". But business conditions remain "above average", suggesting "favourable conditions have continued to persist through the middle of 2018". The weakness in profitability and trading conditions was partially offset by improvement in employment.
Overall, the survey results were broadly in line with NAB's outlook. Business sector looks "relatively healthy". Growth in employment will reduce spare capacity gradually. And that should bring in a "rise in wage and a more general lift in inflation". However, trends in forward indicators will be watched, which may be signaling slowdown.
Weaker than expected data show further cool down in China
A batch of weaker than expected July economic data from China showed the economy has cooled further. Retail sales grew 8.8% yoy, down from prior 9.0% and missed expectation of 9.2% yoy. Industrial production grew 6.0% yoy, unchanged from prior 6.0% yoy but missed expectation of 6.3% yoy. Fixed asset investment growth slowed to 5.5% ytd yoy, down from 6.0% yoy and missed expectation of 6.0% yoy. Unemployment rate rose to 5.1%, up from 4.8%.
In particular, fixed asset investment growth was the slowest on record since early 1996. That suggested weakening business confidence that could be hurt by rising trade tensions with the US, as well as China's own deleveraging policy. Weak retail sales highlights the difficulty of shift focus to domestic consumption for growth momentum, in case of a full-blown trade war.
Suggested reading on China: Chinese Growth Continued to Shrink in July, Despite Stimulus Measures
Looking ahead
The economic calendar in European session is rather jam-packed today. From UK, employment data will be closely watched, in particular wage growth. Eurozone will release Q2 GDP and industrial production. Germany will release Q2 GDP, CPI final and ZEW economic sentiment. US will release import price index later.
AUD/USD Daily Outlook
Daily Pivots: (S1) 0.7252; (P) 0.7276; (R1) 0.7296; More...
Intraday bias in AUD/USD remains on the downside with 0.7322 minor resistance intact. Current fall is part of the down trend from 0.8135 high. Deeper decline should be seen to 61.8% projection of 0.7676 to 0.7309 from 0.7452 at 0.7225 first. Break will target 100% projection at 0.7085 next. On the upside, above 0.7322 minor resistance will turn intraday bias and bring consolidation. But recovery should be limited below 0.7452 resistance to bring fall resumption.
In the bigger picture, medium term rebound from 0.6826 (2016 low) is seen as a corrective move that should be completed at 0.8135. Sustained break of 0.7328 cluster support (61.8% retracement of 0.6826 to 0.8135 at 0.7326) should pave the way to retest 0.6826. There is prospect of resuming long term down trend from 1.1079 (2011 high). But we'll look at downside momentum to assess at a later stage. On the upside, break of 0.7452 resistance might indicate medium term bottoming. But we'll continue to favor the bearish view as long as 0.7676 resistance holds.
Economic Indicators Update
| GMT | Ccy | Events | Actual | Forecast | Previous | Revised |
|---|---|---|---|---|---|---|
| 1:30 | AUD | NAB Business Conditions Jul | 12 | 15 | 14 | |
| 1:30 | AUD | NAB Business Confidence Jul | 7 | 6 | ||
| 2:00 | CNY | Unemployment Rate Jul | 5.10% | 4.80% | ||
| 2:00 | CNY | Retail Sales Y/Y Jul | 8.80% | 9.20% | 9.00% | |
| 2:00 | CNY | Industrial Production Y/Y Jul | 6.00% | 6.30% | 6.00% | |
| 2:00 | CNY | Fixed Assets Ex Rural YTD Y/Y Jul | 5.50% | 6.00% | 6.00% | |
| 4:30 | JPY | Industrial Production M/M Jun F | -1.80% | -2.10% | -2.10% | |
| 6:00 | EUR | German GDP Q/Q Q2 P | 0.40% | 0.30% | ||
| 6:00 | EUR | German CPI M/M Jul F | 0.30% | 0.30% | ||
| 6:00 | EUR | German CPI Y/Y Jul F | 2.00% | 2.00% | ||
| 7:15 | CHF | Producer & Import Prices M/M Jul | 0.10% | 0.20% | ||
| 7:15 | CHF | Producer & Import Prices Y/Y Jul | 3.40% | 3.50% | ||
| 8:30 | GBP | Jobless Claims Change Jul | 7.8K | |||
| 8:30 | GBP | Claimant Count Rate Jul | 2.50% | |||
| 8:30 | GBP | ILO Unemployment Rate 3Mths Jun | 4.20% | 4.20% | ||
| 8:30 | GBP | Average Weekly Earnings 3M/Y Jun | 2.50% | 2.50% | ||
| 8:30 | GBP | Weekly Earnings ex Bonus 3M/Y Jun | 2.60% | 2.70% | ||
| 9:00 | EUR | Eurozone Industrial Production M/M Jun | -0.30% | 1.30% | ||
| 9:00 | EUR | Eurozone GDP Q/Q Q2 P | 0.30% | 0.30% | ||
| 9:00 | EUR | German ZEW Economic Sentiment Aug | -20.1 | -24.7 | ||
| 9:00 | EUR | German ZEW Current Situation Aug | 72.4 | |||
| 9:00 | EUR | Eurozone ZEW Economic Sentiment Aug | -16.4 | -18.7 | ||
| 12:30 | USD | Import Price Index M/M Jul | 0.10% | -0.40% |
GBP/USD Chart Pattern Indicates Wave-4 Correction In Downtrend
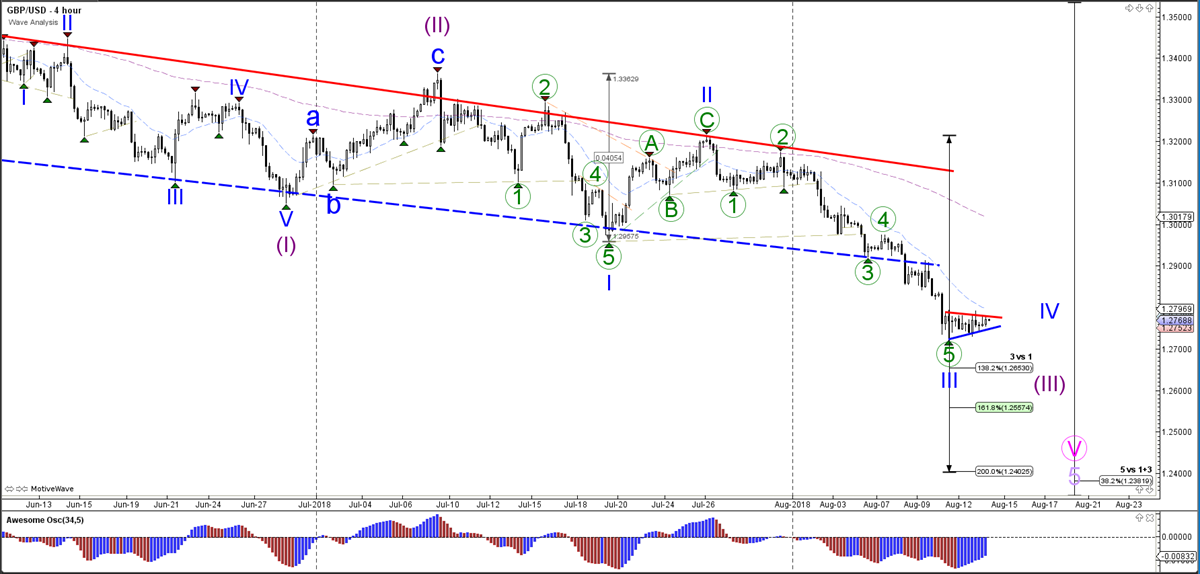
The GBP/USD is building a triangle pattern after breaking below the support line (dotted blue) of the downtrend channel. A new bearish breakout could indicate an immediate continuation within wave 3 (blue), which could fall towards the Fibonacci targets of wave 3 vs 1.
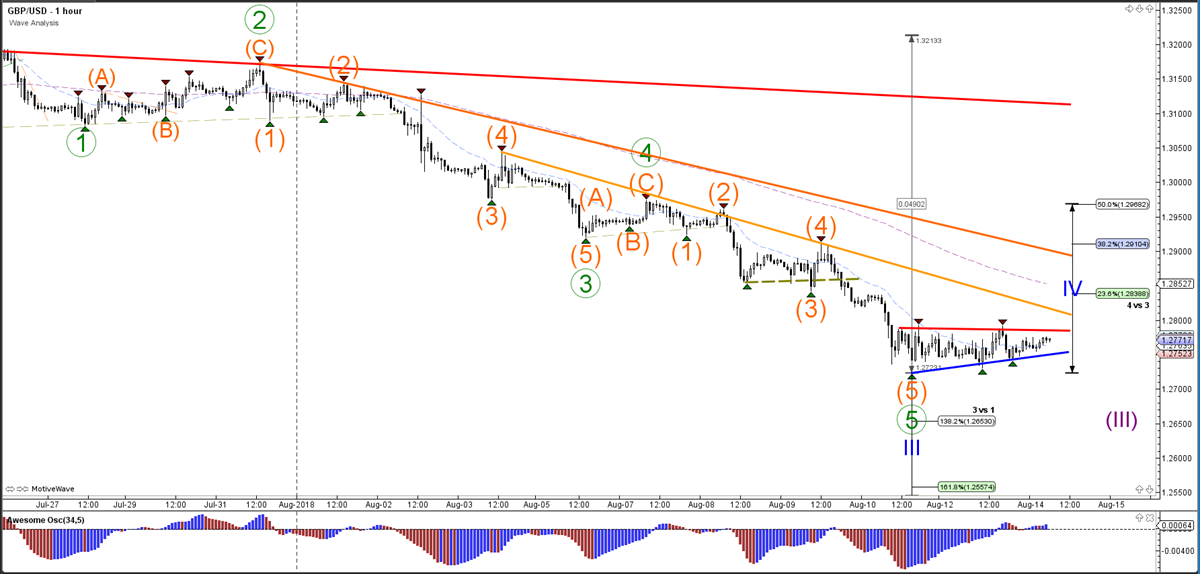
The GBP/USD is building a sideways corrective chart pattern. A bearish breakout could indicate a longer wave 3 (blue) whereas a bullish break could see a bullish retracement within wave 4 (blue). The Fibonacci levels of wave 4 vs 3 could act as resistance.
Elliott Wave Analysis: DAX Bounce Can Be Temporary
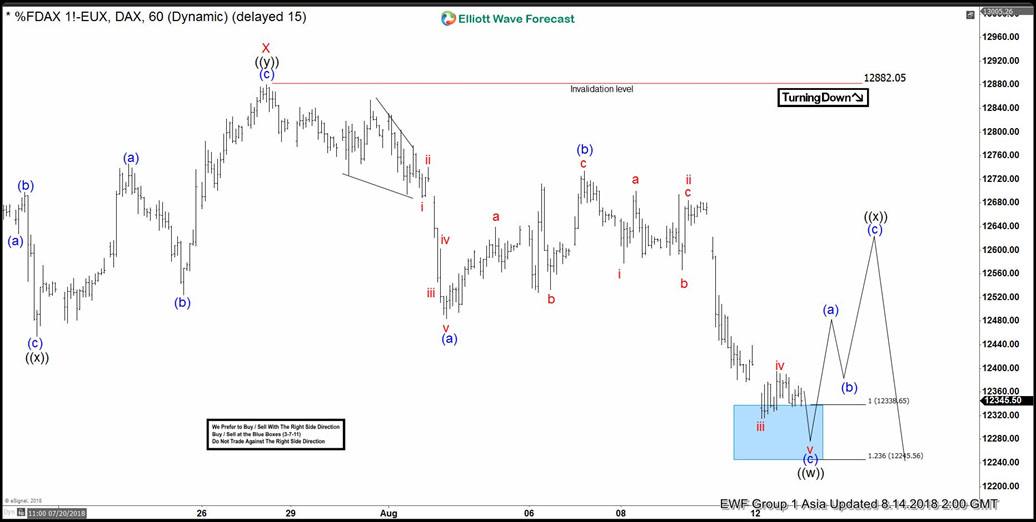
DAX short-term Elliott wave analysis suggests that the rally to 12882.05 high ended Minor wave X bounce. The internals of that bounce unfolded as Elliott wave double three structure where Minute wave ((w)) ended at 12640.87. Minute wave ((x)) ended at 12468.68 and Minute wave ((y)) of X ended at 12882.05 high. Down from there, the decline is showing the overlapping price action suggesting that the decline in Minor wave Y is taking place as 3 wave corrective sequence i.e either ((w)),((x)),((y)) or ((w)),((x)),((y)),((x)),((z)) structure in Minute degree.
The initial decline from 12882.05 high is unfolding as Elliott wave zigzag correction in Minute wave ((w)) lower. Where minutte wave (a) ended in 5 waves structure at 12494 low. Up from there, the bounce to 12740.12 high ended Minutte wave (b) bounce in 3 swings. Decline from there is taking place in another 5 waves structure & reached the 12338.65-12245.56 100%-123.6% Fibonacci extension area of (a)-(b) to end Minutte wave (c) of ((w)). And soon, the index is expected to do a Minute wave ((x)) bounce in 3, 7 or 11 swings against 12882.05 high before further decline in Minute wave ((y)) of Y is seen. We don’t like selling it.
DAX 1 Hour Elliott Wave Chart
Chinese Growth Continued to Shrink in July, Despite Stimulus Measures
July’s data showed that China’s economic growth continued to decelerate although the government has loosened its policy. All key economic activity indicators missed expectations for the month.
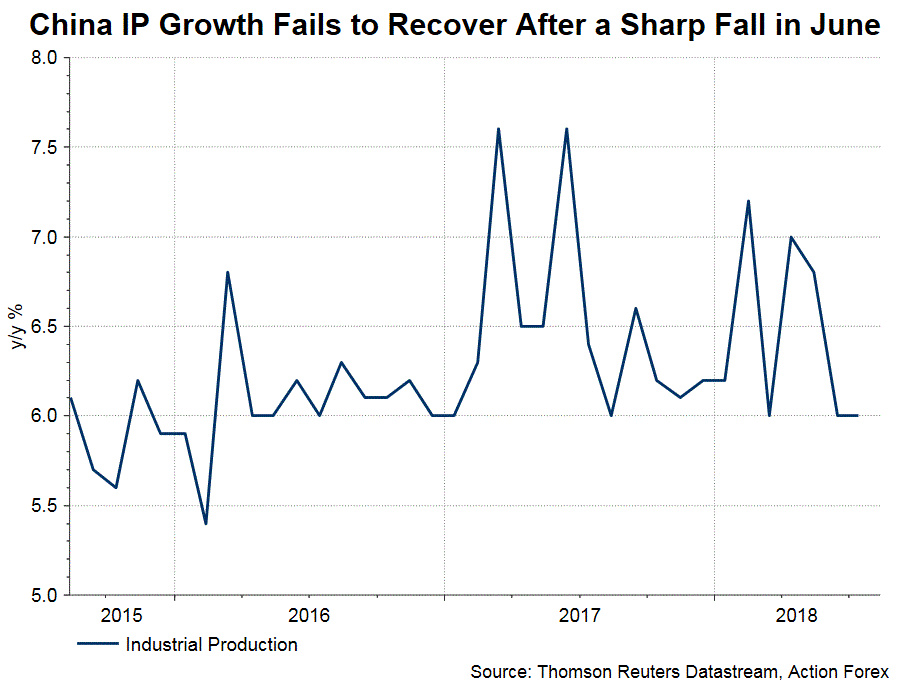
Industrial production grew +6% y/y, after a sharp slowdown in June and missing consensus of +6.3%. The moderation has been revealed in the PMI reports released weeks ago. On the official report, manufacturing PMI fell to 51.2 in July, from 51.5 a month ago. The decline in most sub-indices signaled that the weakening in manufacturing activities was broad-based. The one reflecting industrial production was the “production” sub- index, which fell to 53 from 53.6 in June. Survey small and medium businesses, the Marikit/ Caixin reported that the manufacturing PMI dropped to 50.8 in July, from 51 a month ago. The “output” sub-index also dropped during the month.
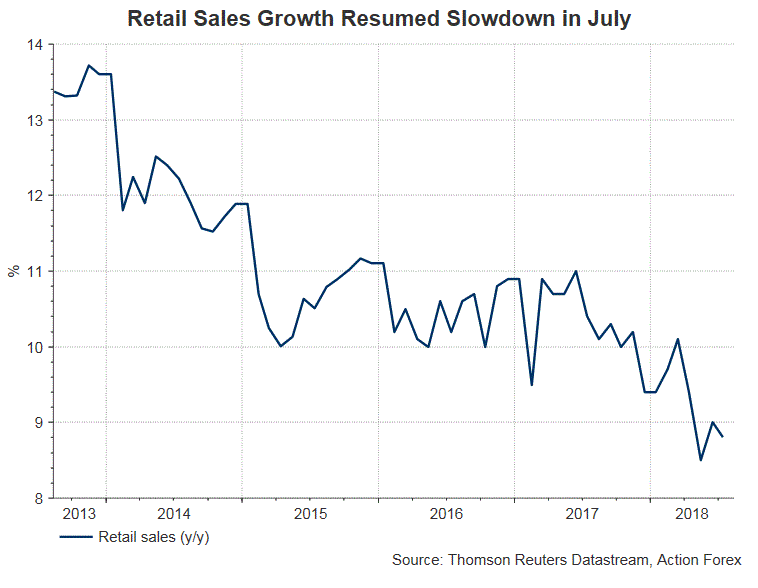
Growth in retail sales slowed further to +8.8% y/y, resuming the deceleration after a brief pick up in June (+9%). The market had anticipated an improvement to 9.3%.
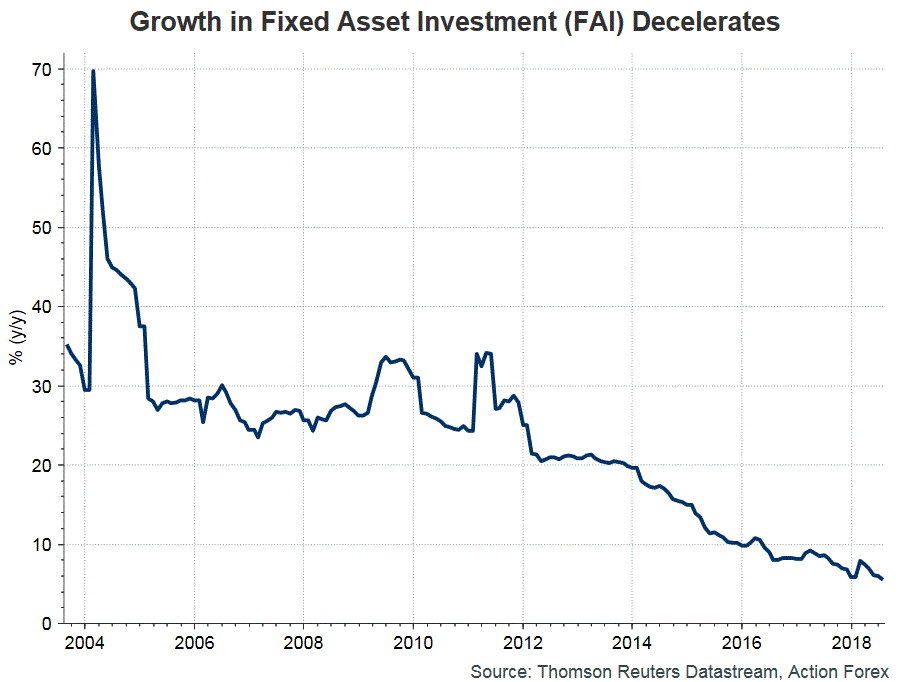
Urban fixed asset investment expanded +5.5% y/y in the first 7 months of the year, slowing from +6% in the January- June period. The market had anticipated a growth +6% in July.
Valuation Effect Explains 40% of Increase in FX Reserve
China’s FX reserve increased +US$ 5.82B to US$ 3118B in July. While the headline reading was in contrast with the expectation that the government might have sold FX assets to defend the recent sharp fall of renminbi (Chinese yuan). Some might have suggested that the government indeed has purchased FX assets to facilitate depreciation of its currency. This tactic can be useful for Chinese exports amidst intensification of trade conflict. We believe that the July increase in FX reserve was modest and a part of it was driven by valuation effect.
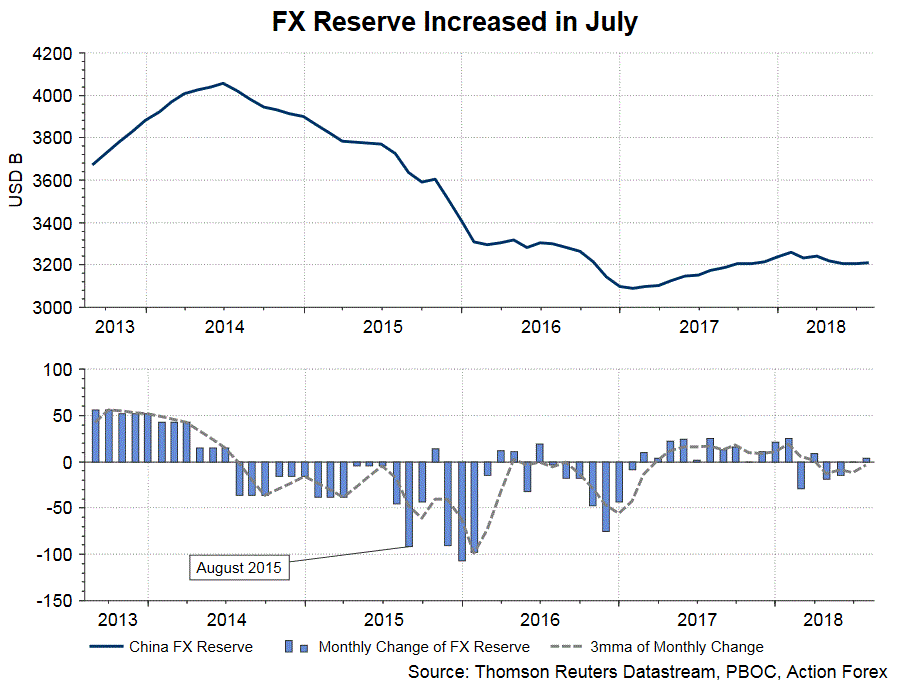
Calculation of China’s macroeconomic data is never transparent under the authoritarian CCP government. Similarly, the composition of Chinese FX reserve is confidential. However, it is possible get an estimate as other countries’ central banks report foreign holdings of their assets.
It is generally estimated that about 62% of it was composed of US dollar. Meanwhile, about 21% is in euro, 5% in pound, 3% in Japanese yen, 2% in each of Aussie and Loonie, and the rest are other currencies. During the period, USD index slipped -0.2%, thus inflating the FX reserve by about US$ 2.38B.
Regarding the increase in FX reserve in spite of renminbi depreciation, the government likely finds it unnecessary for now to intervene aggressively in the market as capital outflow is not severe. Indeed, many of the capital control measures implemented after the 2015 currency reform remain in place.
We believe the chance of intervention to defend renminbi is still high if renminbi weakens further, as the trade conflict heightens and the growth of economic activities continues to slow.
Limited Impact of Tariff on Inflation
Headline CPI in China accelerated to +2.1% y/y in July, from +1.9% in the prior month. The market had anticipated a weaker figure of +2%. Core CPI, excluding food and energy prices, steadied at +1.9%. The food price index climbed higher to +0.5% y/y, while non-food prices picked up to 2.4%, from +2.2% in June.
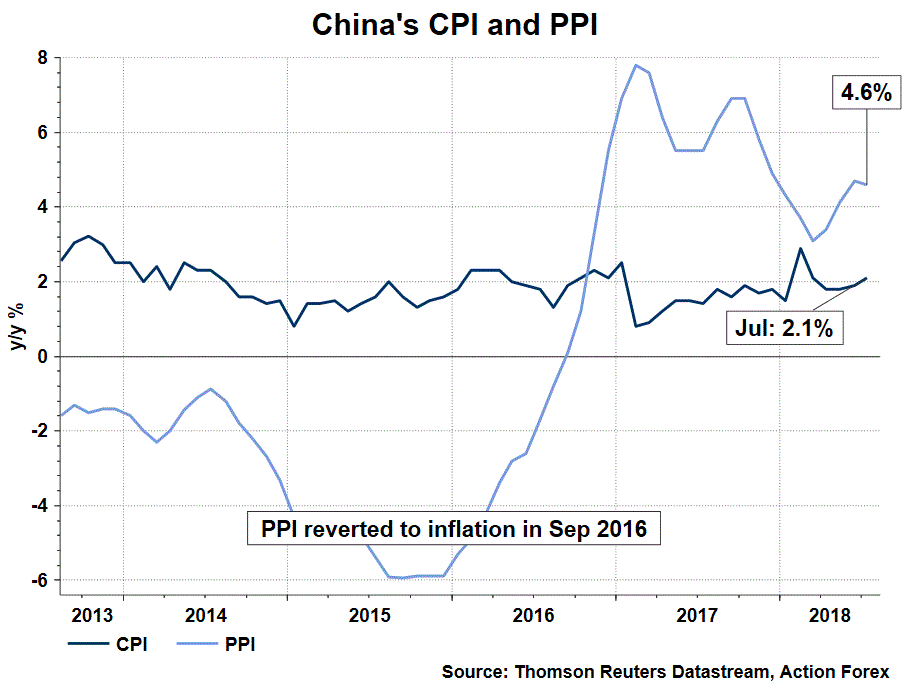
On August 3, China announced to impose tariffs on US$ 60B of US goods, with tariffs ranging from 5-25%. These are retaliatory measures after Trump’s order to consider raising tariffs on US$ 200B of Chinese goods. The impacts on inflation should be limited as many US goods subject to tariff are not included in the CPI basket. Moreover, China has reduced tariffs on a number of imports from non-US countries from July 1 . This might offset the increase in import prices from the US.
PPI eased to +4.6% y/y, from +4.7% in June. However, this also beat consensus of +4.4%. Indeed, the slowdown in PPI is consistent with the ease in the manufacturing PMI input price.
Yen stablized for now, but S&P 500 reversal could push it higher again later
The forex markets have stabilized from Turkish turmoil. Swiss Franc is trading as the weakest one in Asian session so far, followed by Yen, as risk aversion receded. New Zealand Dollar, Canadian Dollar and Australian Dollar are the relatively stronger one. Rally in Yen and Swiss Franc could has passed the near term climax. But the lack of strength in recovery in EUR/USD, GBP/USD and AUD/USD suggests that the greenback might be taking over.
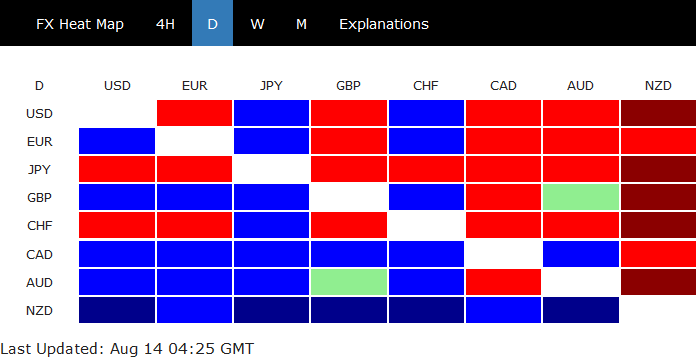
Nikkei clearly benefits from the pull back in Yen as it's trading up more than 400pts, or 1.85% at the time of writing. Monday's gap is nearly closed. But stocks stay generally weak elsewhere. Hong Kong HSI is down -0.89%, China Shanghai SSE is down -0.50% and Singapore Strait Times is down -0.17%. That followed -050% decline in DOW overnight. S&P 500 lost -0.40% while NASDAQ also dropped -0.25%.
It's looking increasing likely that SPX is ready for a near term reversal. Momentum is clearly diminishing just ahead of 2872.87 high, as seen in bearish divergence condition in daily MACD. At this point, we're not seeing any momentum for an upside breakout yet. Break of 2795.14 will instead indicate short term topping. When that happens, it could be the time for another round of selloff in Yen crosses. 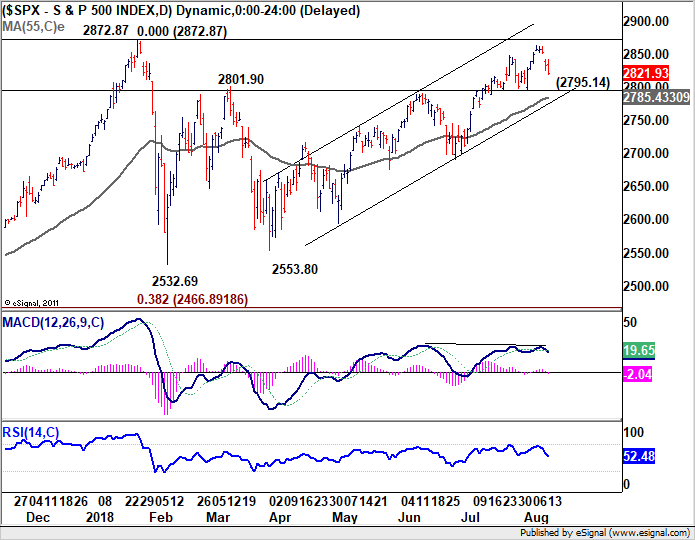
Australia NAB business conditions extended slide to 14, confidence recovered
Australia NAB business conditions dropped -2pts to 14 in July. Business confidence rose 1pt to 7.
Alan Oster, NAB Group Chief Economist noted in the release that the business conditions index "has now fallen considerably since April". But business conditions remain "above average", suggesting "favourable conditions have continued to persist through the middle of 2018". The weakness in profitability and trading conditions was partially offset by improvement in employment.
Overall, the survey results were broadly in line with NAB's outlook. Business sector looks "relatively healthy". Growth in employment will reduce spare capacity gradually. And that should bring in a "rise in wage and a more general lift in inflation". However, trends in forward indicators will be watched, which may be signaling slowdown.
Market Morning Briefing: Euro Yen Saw A Low Near 125 Yesterday
STOCKS
Dow (25187.70, -0.50%) traded lower as expected. Resistance on the 3-day candle is holding well and the index could fall towards 25000 or even lower in the near term.
Dax (12358.74, -0.53%) has immediate support at 12300 and if that holds, a short bounce back towards 12500-12600 is possible. Note that there is important support just below current levels and there is high chance of a bounce back in the near term. Dax looks bullish for the near to medium term.
Nikkei (22123.36, +1.22%) could trade in the 22000-22400 region in the next 2-3 sessions. A break below 22000, if seen could open up chances of a fall towards 21200 in the medium term. For now a bounce to 22400 looks possible.
Shanghai (2783.27, -0.094%) was almost stable yesterday. Trade within 2800-2700 is likely to continue in this week.
Nifty (11355.75, -0.65%) seems to be holding well below the 11500 resistance and while that holds, Nifty could come down to 11200. Near term looks weak.
COMMODITIES
Nymex WTI (67.53) is likely to hold below 68 just now coming back to re-test 66 while Brent (72.92) could trade in the 73.50-71.00 region in the next 3-4 days. Overall ranged sessions for Crude is possible this week.
Gold (1202.60) broke below the initial support at 1210 and has come down to test 1200. If 1200 holds we could see a rise back towards 1125; else a fall below 1200 could open up chances of testing 1175 on the downside. Near term looks stable to bearish.
Copper (2.7265) is trading above 2.70 and could be stuck in the 2.70-2.85 region for some more time. A break below 2.70, if seen could make it bearish towards 2.65 on the downside.
FOREX
After 2 days of drastic weakening, the Turkish Lira (6.875) is consolidating for a bit below 7. Charts however suggest that some more upside could still be possible, thereby implying that Yuan, Euro, Pound, Rupee and some other emerging market currencies could weaken more against the Dollar.
Euro (1.1410): Support near 1.1360 is holding so far. But this might just be a bit of a consolidation. Need a rise past 1.1450 at least to think of a correction. While below 1.145, a test of trendline support on weekly line chart near 1.13 could still happen in this week.
Dollar Index (96.295): Dollar Index is seeing some consolidation after having tested resistance on daily candles near 96.5. While above 95.7-95.5, it could still rise towards 97 in this week, which could thereby correspond to Euro testing 1.13.
Dollar Yen (110.78): Dollar Yen is trading just below resistance on daily candles near 111. While below this, a dip towards 109.5 is possible in the sessions ahead. A rise above 111 could open up possibilities of another test of 113 in the next 1-2 weeks.
Euro Yen (126.40): Euro Yen saw a low near 125 yesterday, slightly higher than its earlier low (May '18) near 124.62. Although it is seeing a slight consolidation currently, further bearishness could pause only on a rise past 127. While below 127, a fall below 124.62 to target support near 124.0-123.5 could take place by next week.
Pound (1.2768): After having broken channel support near 1.28, Pound could drop further in this week towards 1.270-1.265. In the next 2-3 weeks, bearishness could extend till support on weekly candles near 1.25-1.22.
Dollar Rupee (69.9375): Near term continues to be highly overbought. Chances of 70.30 look possible today with a possibility of 70.30 holding in the near term. Off shore NDF trading near 70.08 - hence, an open above 70 could be expected.
INTEREST RATES
Bond yields in US, Germany and Japan could see some more dips in the days ahead while those in less developed economies could see a rise, as the crisis in Turkey might make investors switch to safer assets. Moreover, the US-China trade tensions might only intensify moving forward – which could thereby further enhance the ‘risk off’ sentiment.
US 10 year yield (2.88%), 30 Year (3.05%), 5 Year (2.73%), 2 Year (2.62%):
The US 10 year yield again moved up yesterday from the crucial support near 2.82-85%. It wasn't able to break below this support in Jun-Jul ’18 either. As written yesterday – any delay in breaking below 2.82% could imply that the support is still strong and that, another rise beyond 2.9% could happen anytime soon. While below 2.9%, a break below 2.82% and a test of support near 2.75%-2.70% could still take place.
German 10 year bond yield (0.31%) continues to test support near 0.3% on medium term chart. A break below 0.3% would make it bearish towards lower support near 0.18%-0.19%.