Sample Category Title
Forex Technical Analysis: EUR/USD, USD/JPY, GBP/USD
EUR/USD
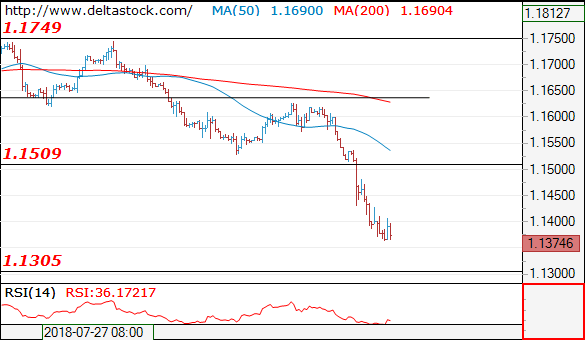
Current level - 1.1374
The downtrend is intact, heading towards 1.1300 support area. Minor intraday resistance lies at 1.1420, followed by 1.1510 zone.
| Resistance | Support | ||
| intraday | intraweek | intraday | intraweek |
| 1.1420 | 1.1510 | 1.1360 | 1.1300 |
| 1.1510 | 1.1750 | 1.1300 | 1.1100 |
USD/JPY
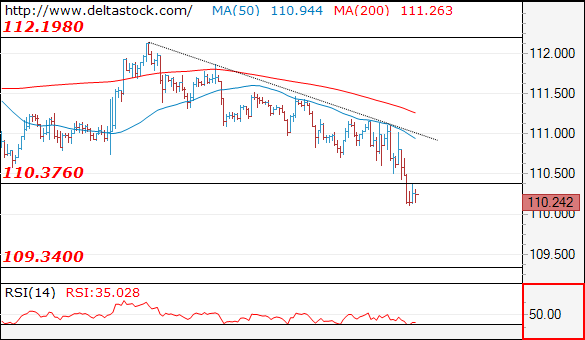
Current level - 110.24
The violation of 110.40 support signals a further decline, towards 109.30 area. Crucial on the upside is 111.20 peak.
| Resistance | Support | ||
| intraday | intraweek | intraday | intraweek |
| 110.40 | 114.50 | 110.25 | 110.25 |
| 111.20 | 114.50 | 109.30 | 109.30 |
GBP/USD
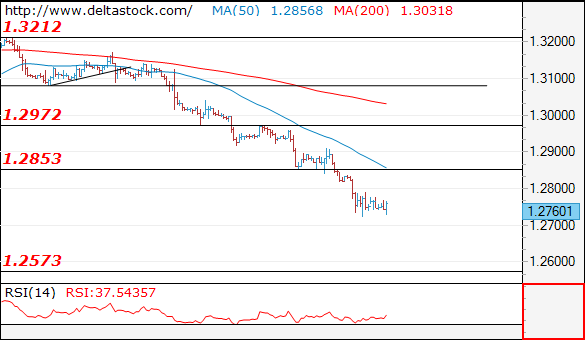
Current level - 1.2760
My outlook remains bearish, for a slide towards 1.2570 area. Key resistance is projected at 1.2850.
| Resistance | Support | ||
| intraday | intraweek | intraday | intraweek |
| 1.2850 | 1.2970 | 1.2730 | 1.2570 |
| 1.2970 | 1.3210 | 1.2630 | 1.2570 |
Focus Remains On Turkey FX Crisis
Notes/Observations
- Market narrative turning more macro following a strong earnings season
- Turkey Central Bank announced a set of measures to support embattled Lira currency; vowed to take all necessary measures to maintain financial stability
- Turkey FX woes rattling other vulnerable emerging markets
Asia:
- Market narrative turning more macro following a strong earnings season
- Turkey Central Bank announced a set of measures to support embattled Lira currency; vowed to take all necessary measures to maintain financial stability
- Turkey FX woes rattling other vulnerable emerging markets
Asia:
- Japan Econ Min Motegi: US and Japan agreed to expand trade; next meeting to be held around September
Europe:
- Russia Fin Min Siluanov: To further cut its holdings of US securities in response to new sanctions; had no plans to shut down US companies
- Turkey President Erdogan reiterated that Turkey economy was NOT in a crisis; weakness in the Lira currency was a "currency plot"
- Fitch raised Greece sovereign rating two notches to BB- from B; outlook Stable
Americas:
- President Trump tweets that deal with Mexico is "coming along nicely"; "Canada must wait"
Economic Data:
- (SE) Sweden July PES Unemployment Rate: 3.8% v 3.7% prior
- (NL) Netherlands Jun Retail Sales Y/Y: 4.0% v 4.3% prior
- (SE) Sweden Aug SEB Housing Price Indicator: 26 v 13 prior
- (SE) Sweden Jun Household Consumption M/M: 0.3% v 0.2% prior; Y/Y: 4.3% v 3.7% prior
- (CH) SNB Total Sight Deposits for Week Ended Aug 10th (CHF): 576.1B v 575.9B prior
- (CZ) Czech Jun Current Account (CZK): -1.6B v -12.0Be
- (IT) Italy Jun Final CPI (includes tobacco) M/M: 0.3% v 0.3% prelim; Y/Y: 1.5% v 1.5% prelim
- (IT) Italy Jun Final CPI EU Harmonized M/M: -1.4% v -1.4% prelim; Y/Y: 1.9% v 1.9% prelim, CPI Index (Ex Tobacco): 102.5 v 102.2 prior
Fixed Income Issuance:
- None seen
SPEAKERS/FIXED INCOME/FX/COMMODITIES/ERRATUM
Equities
- Indices [Stoxx50 -0.4% at 3,410, FTSE -0.5% at 7,633, DAX -0.5% at 12,366, CAC-40 -0.2% at 5,403; IBEX-35 -0.9% at 9,517, FTSE MIB -0.5% at 20,983, SMI -0.5% at 8,982 , S&P 500 Futures -0.3%]
- Market Focal Points/Key Themes: European indices open lower and continued trend as the session progressed; contagion concerns impacting risk sentiment, especially in emerging markets; ongoing financial concerns in Turkey drag on banking sector, BBVA, BNP Paribas and Unicredit among those most affected; attention turning to macro data as earnings season winds down this week; earnings expected in the upcoming US session include JinkoSolar and Sysco Corp
Equities
- Consumer discretionary: Air France-KLM AF.FR -5.3% (potential industrial action), Aryzta ARYN.CH -5.4% (capital raise), Ingenico ING.FR -4.3% (analyst action)
- Financials: BBVA BBVA.ES -3.0% (Turkey concerns), Plus500 PLUS.UK -9.8% (results), Talanx TLX.DE +0.6% (results), Unicredit UCG.IT -1.7% (Turkey concerns)
- Healthcare: Bayer BAYN.CH -10.9% (Monsanto suit)
- Industrials: Chemring Group CHG.UK -16.1% (accident), Evraz EVR.UK -1.5%(analyst action)
- Telecom: United Internet UTDI.DE 4.3% (results)
- Telecom: Drillisch DRI.DE +2.2% (results)
Speakers
- Italy Dep PM Di Maio (Five Star party leader): Country not open to speculator attacks
- Reportedly 50 Conservative MPs form bloc to challenge Brexiteers
- Spain Budget Min Montoro: Willing to delay budget bill
- Turkey Central Bank (CBRT) Statement: Banks would be provided all liquidity they needed and would resume intermediary function at FX deposit market. Collateral deposits limits for Lira transactions raised and could hold more than one Repo auction could be held each day. To monitor markets and take all necessary measures
- Turkey Central Bank (CBRT) cuts its Reserve Requirement Ratio (RRR) BY 250bps for all maturities. Cut RRR in FX by 250bps in all maturities and by 400bps in some maturities. Move to provide TRY10B, $6B and $3B in gold liquidity
- Turkey market regulator CMB warned against any rumors of misleading information on the markets, could result in fines or even prison
- South and North Korea leaders said to be hold summit by Sept in Pyongyang
- South Korea Fin Min Kim: Closely monitoring FX markets; to take measures if necessary
Currencies
- FX markets continued to find flows into safe haven currencies as risk aversion sentiment percolated up on Turkish crisis
- Focus remained on Turkey and possible contagion from its currency crisis. Turkey Central Bank announced a set of measures to support embattled Lira currency; vowed to take all necessary measures to maintain financial stability. TRY currency (LIra) dropped to as low as 7.236 in pre- European trade before recovering to 6.45 area
- The Turkish currency situation was rattling other vulnerable emerging markets as Indonesia and South Africa were economies that were also heavily reliant on foreign investors. USD/ZAR was at 2-year lows as the pair tested 15.44 level. The USD/CNY was neared its weakest level in more than a year, hitting 6.8911 to a dollar.
- EUR/USD remaining below the key technical level of 1.15 and was trading with a 1.13 handle throughout today’s session. The Italian budget issue was simmering in the background of the Turkish FX meltdown. Italy Dep PM Di Maio believed that his country was not at risk of financial market attack but the 10-yeat BTP yield was inching back towards the late May highs of 3.11% area. Spain Budget Min Montoro also noted that his govt was willing to delay its 2019 budget bill
- GBP/USD was near 11-month lows
- USD/JPY pair was lower by 0.5% at 11.30 area just ahead of the US morning.
Fixed Income
- Bund Futures trades at 163.41 up 9 ticks continuing to rise on risk aversion flows due to the continued decline of the Turkish Lira.
- Continued upside targets 163.63 then a push for 164, with a reversal targeting 163.3 then 162.69.
- Gilt futures trades at 123.58 down 4 ticks pulling back from the recent highs after the recent run up with initial support at 123.32 then 123.12, while further momentum targets 123.63 then 124.00.
- Monday 's liquidity report showed Friday's excess liquidity fell from €1.903T to €1.889T. Use of the marginal lending facility fell from €35M to €30M.
- Corporate issuance saw the week finish with $38.4B of high grade issuance.
- Analysts see H2 of 2018 M&A related issuance to range $100-150B.
Looking Ahead
- OPEC Monthly Report (no set time)
- 05:30 (DE) Germany to sell €3.0B in 6-Month BuBills
- 06:00 (IL) Israel July Trade Balance: No est v -$2.1B prior
- 06:00 (TR) Turkey to sell 2020 Bonds
- 06:00 (TR) Turkey to sell 3-month bills
- 06:45 (US) Daily Libor Fixing
- 07:25 (BR) Brazil Central Bank Weekly Economists Survey
- 08:00 (IN) India July CPI Y/Y: 4.5%e v 5.0% prior
- 08:00 (PL) Poland Jun Current Account: -€0.3Be v €0.0B prior; Trade Balance: -€0.1Be v +€0.1B prior; Exports €17.8Be v €17.3B prior; Imports: €17.8Be v €17.2B prior
- 08:00 (RO) Romania Central Bank (NBR) Aug Minutes
- 08:00 (IN) India announces details of upcoming bond sale (held on Fridays)
- 08:00 (ES) Spain Debt Agency (Tesoro) announces size of upcoming auctions
- 08:05 (UK) Baltic Dry Bulk Index
- 08:55 (FR) France Debt Agency (AFT) to sell combined €4.0-5.2B in 3-month, 6-month and 12-month BTF Bills
- 09:30 (EU) ECB announces Covered-Bond Purchases
- 09:35 (EU) ECB calls for bids in 7-Day Main Refinancing Tender
- 11:30 (US) Treasury to sell 3-month and 6-month Bills
- 16:00 (US) Weekly Crop Progress Report
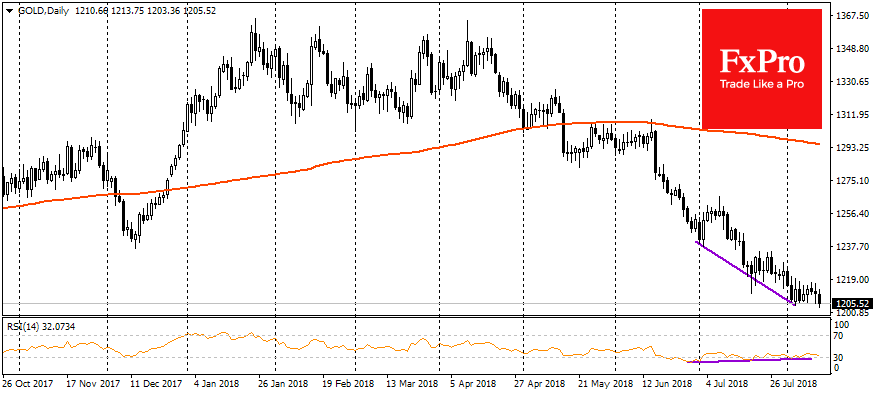
Gold Trades Around 17-Month Low In Short Term Trading Range
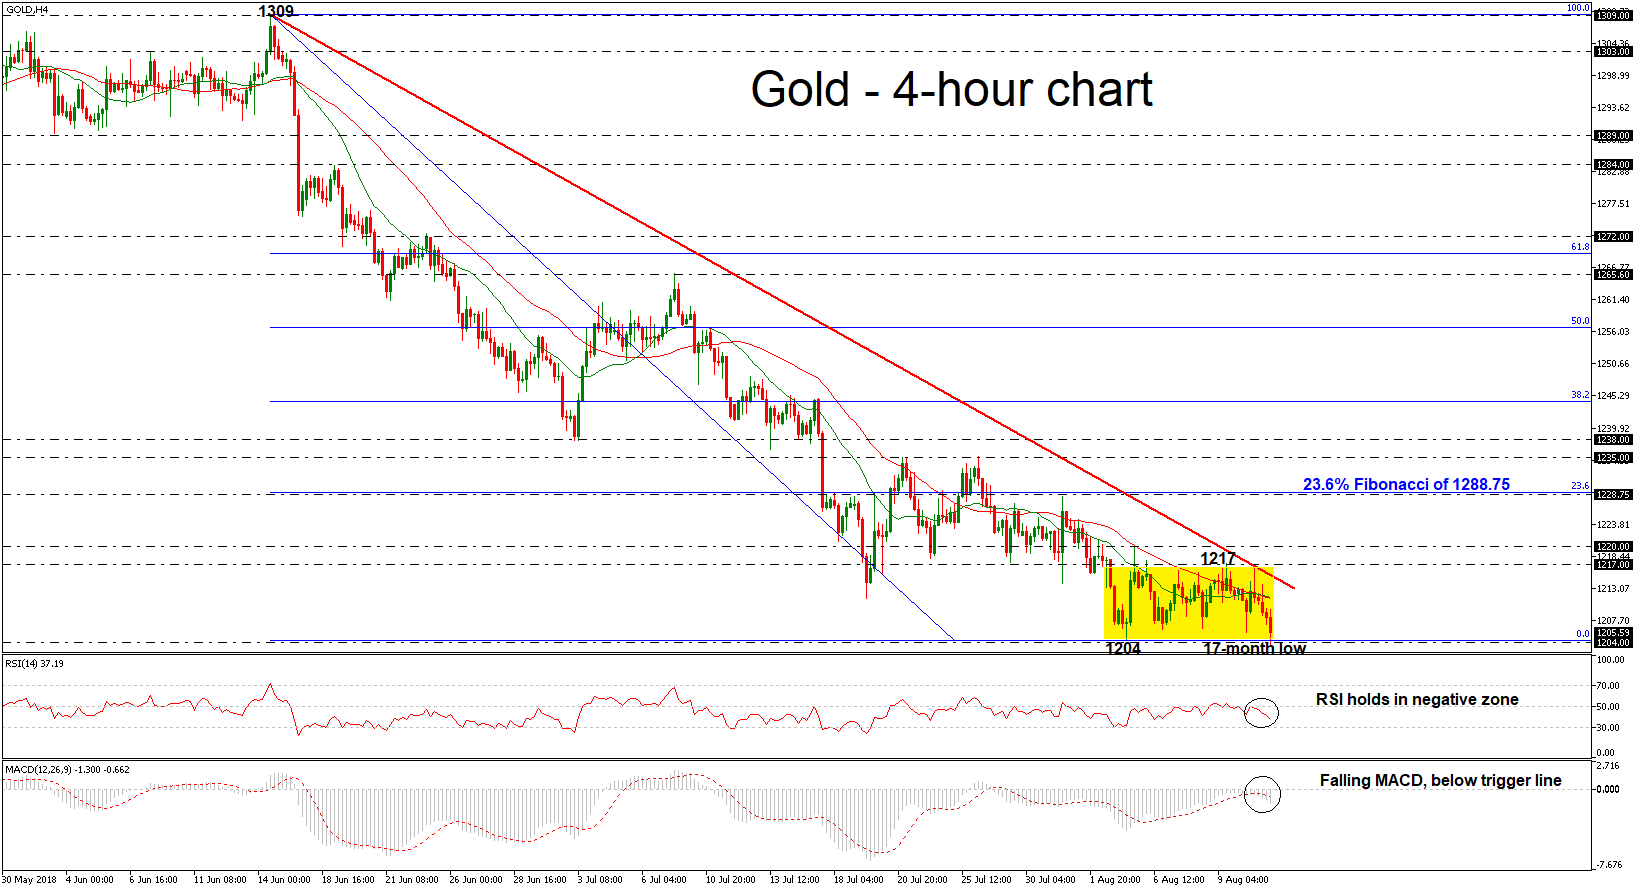
Gold prices have been developing within a sideways channel over the last ten days with upper boundary the 1217 resistance level, and lower boundary the 1204 support level. It is worth mentioning that the price recorded a fresh 17-month low of 1203.55 earlier on Monday. The technical structure enhances the argument that the outlook is entirely negative at the moment.
Looking at momentum oscillators in the 4-hour chart, they suggest further declines may be on the cards in the short-term. The RSI is approaching the threshold of 30 with strong momentum, while the MACD oscillator plunged below its trigger line in the negative zone.
In case of further declines in the price, immediate support may be found near the psychological level of 1200. A downside break of that zone would open the way for the January 2017 bottom of 1180.
On the flip side, if the bulls take control, price advances may stall initially near the latest highs at 1217. A potential upside violation of this level would also coincide with a break of the consolidation area, raising the likelihood for more upside movements. In such a case, the 1220 and then the 23.6% Fibonacci of the downleg from 1309 to 1204, near 1228.75 would be the next level for investors to have in mind.
To conclude, the precious metal has remained in a downside trend since June 14, following the bounce off the 1309 resistance hurdle.
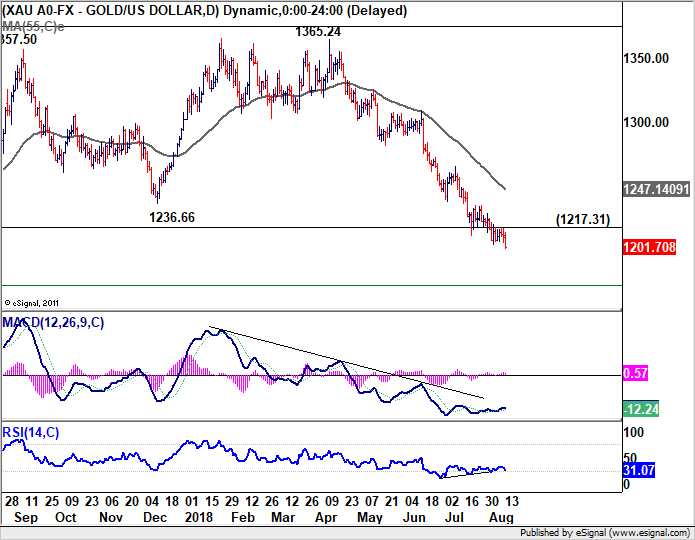
Gold to break 1200 finally, head towards 1172 fibonacci level
Gold finally breaks out of consolidation today and reaches as low as 1201.24 so far. The down trend from 1365.24 has resumed. Near term outlook will now stay bearish as long as 1217.31 resistance holds. Next target is 1172.07 fibonacci level. On the upside, though, break of 1217.31 will indicate short term bottoming. And rebound could be seen back to 55 day EMA (now at 1247.14 before staging another decline.
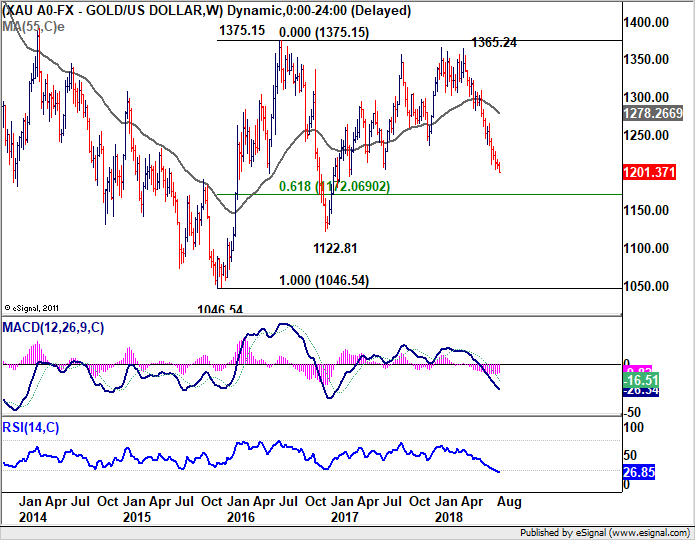
Currently decline from 1365.24 is viewed as part of the long term sideway pattern from 1046.54 (2015 low). Sustained break of 61.8% retracement of 1045.65 to 1375.15 will pave the way to 1046.54/1122/81 support zone. At this point, we're not expecting a break there to resume long term down trend yet. Hence, we'll look for bottoming signal below 1122.81.
Turkish Lira In Free Fall, ZAR Tumbles
TRY again
Crisis and contagion are loose, with equities weaker across the board in Asia and European and US futures pointing to a weak open. The wild swings, elevated volatility and speculations is based on FX. Traders are picking off nations exposed to USD obligations. Friday selling was bad; this morning was meaningfully worse. US treasuries spiked last week as credit contagion worries sent investors into safe havens USD, JPY and CHF. Nations with the highest non-bank dollar obligations as a % of GDP goes like this, Chile (whopping 35% of GDP in USD non-bank debt), Mexico, Turkey, Indonesia, Argentina, Russia, Malaysia, South Africa, Brazil and South Korea.
Should this global driver continue, traders will go down the list. Geopolitical dramas have captured the markets’ imagination, yet historically when the Federal Reserve raises interest rates in order to pullback inflation, emerging markets crash. The focal point remains Turkey: what started as a US-Turkey dispute over the detention of an American pastors has spread to trade. President Trump announced a doubling of steel and aluminium tariffs. However, the non-independent Central Bank of Turkey was unable to react. Perhaps the firing of CBT staff, post-coup, was not the smart move. A signature of crisis is rumour, and they are swirling of global banks cutting credit to Turkish banks. TRY bulls were hoping for a hammer in the form of higher interest rates from policy makers, but instead got an inadequate response.
The CBT micro-tuned, with lower reserve requirements. Rumour is that central banks will move with force later today. However, given President Erdogan’s rhetoric, including an editorial in the New York Times, it’s unlikely that considerably higher interest rates are coming (or will be enough). Turkey could try other options such as capital controls or going to the IMF, yet these would spur crisis, and we don’t believe Erdogan is willing to head in this direction. TRY should brace for more pain.
Further downside for ZAR
As contagion continues in emerging markets, the South African rand is no exception. Depreciating by 16% against the greenback since the beginning of the year, USD/ZAR’s steep rise from last Thursday (7.70% from 09/08/2018) is a big hit for the South African Reserve Bank (SARB), which already faced strong ZAR pressure after decreasing its repo rate by 0.25% in March 2018. The SARB decision to maintain its benchmark interest rate at 6.50% during its next policy meeting on 20 September would be more than welcome for the country. Despite inflation contained within its target band, economic growth remains low while business confidence is on the way to recovery, supported by increasing domestic consumption and manufacturing. We expect the recent ZAR bearish trend to end, as the SARB monetary policy stance is appropriate. Currently trading at 2-year high USD/ZAR is expected to rise further in the short-term, amid global risk-off. Estimated at 14.54, USD/ZAR is heading to 15.
GBPUSD Triangle Break Looms
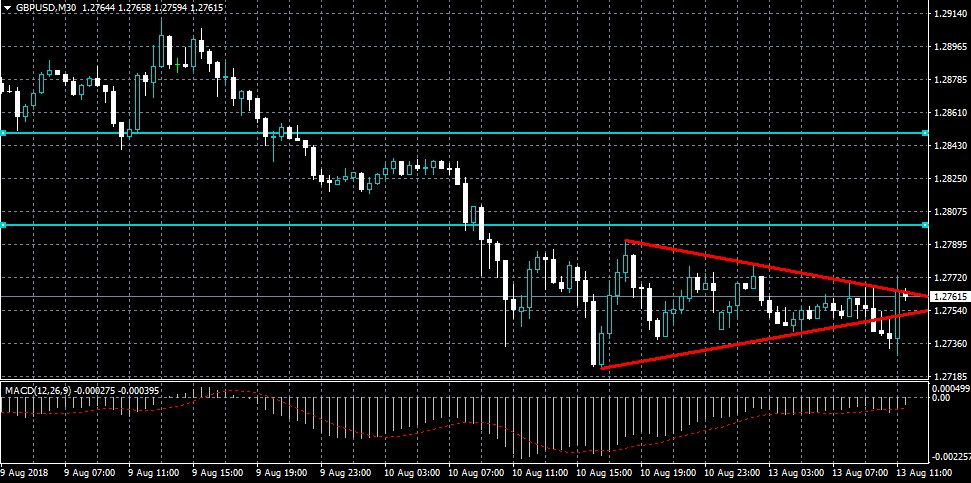
The British pound continues to trade at the lower end of its trading range against the US dollar on Monday, with price currently consolidating inside a neutral triangle pattern as traders await the next directional break in the GBPUSD pair. Buyers will likely attempt to break the triangle top and test the 1.2800 level, while sellers will likely test the 1.2700 support level if the triangle is broken to the downside.
The GBPUSD pair is strongly intraday bearish while trading below the 1.2800 level, key support is found at the 1.2740 and 1.2700 levels.
If the GBPUSD pair moves above the 1.2800 level, key intraday resistance is found at the 1.2850 and 1.2870 levels.
USDJPY Sentiment Remains Weak Below 110.55
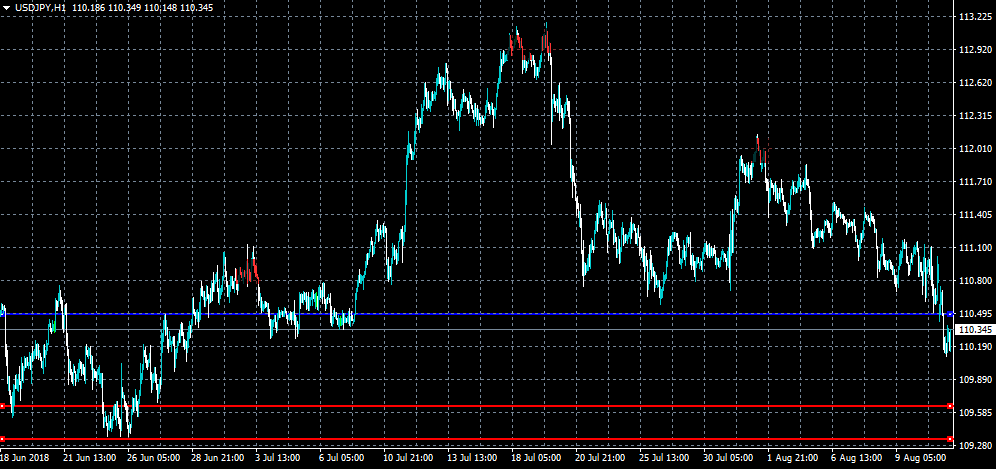
The US dollar remains under pressure against the Japanese yen on Monday, as the yen currency benefits from the risk-off trading sentiment in financial markets. The USDJPY pair has found interim support from just the 110.00 level so far, with price managing a minor corrective move back towards the 110.30 region. Sellers still retain control of the USDJPY pair while price trades below the 110.55 level, which represents the neckline of a bearish head and shoulders pattern.
The USDJPY pair is strongly bearish while trading below the 110.55 level, key support is located at the 109.56 and 109.28 levels.
If the USDJPY pair trades above the 110.55 level, we may see a further corrective move back towards the 110.80 and 111.10 resistance levels.
The Analytical Overview Of The Main Currency Pairs
The EUR/USD currency pair
Technical indicators of the currency pair:
Prev Open: 1.15260
Open: 1.13721
% chg. over the last day: -1.01
Day's range: 1.13650 – 1.14117
52 wk range: 1.0571 – 1.2557
Last week, aggressive sales were observed on the EUR/USD currency pair. The euro has overcome the key mark of 1.14000. Investors continue to assess the risks for the European banking system due to a significant weakening of the Turkish lira. At the moment, the EUR/USD quotes are consolidating. Local support and resistance levels are 1.13650 and 1.14100. We recommend opening positions from these marks.
Today, the news feed is calm. The publication of important economic reports is not planned.
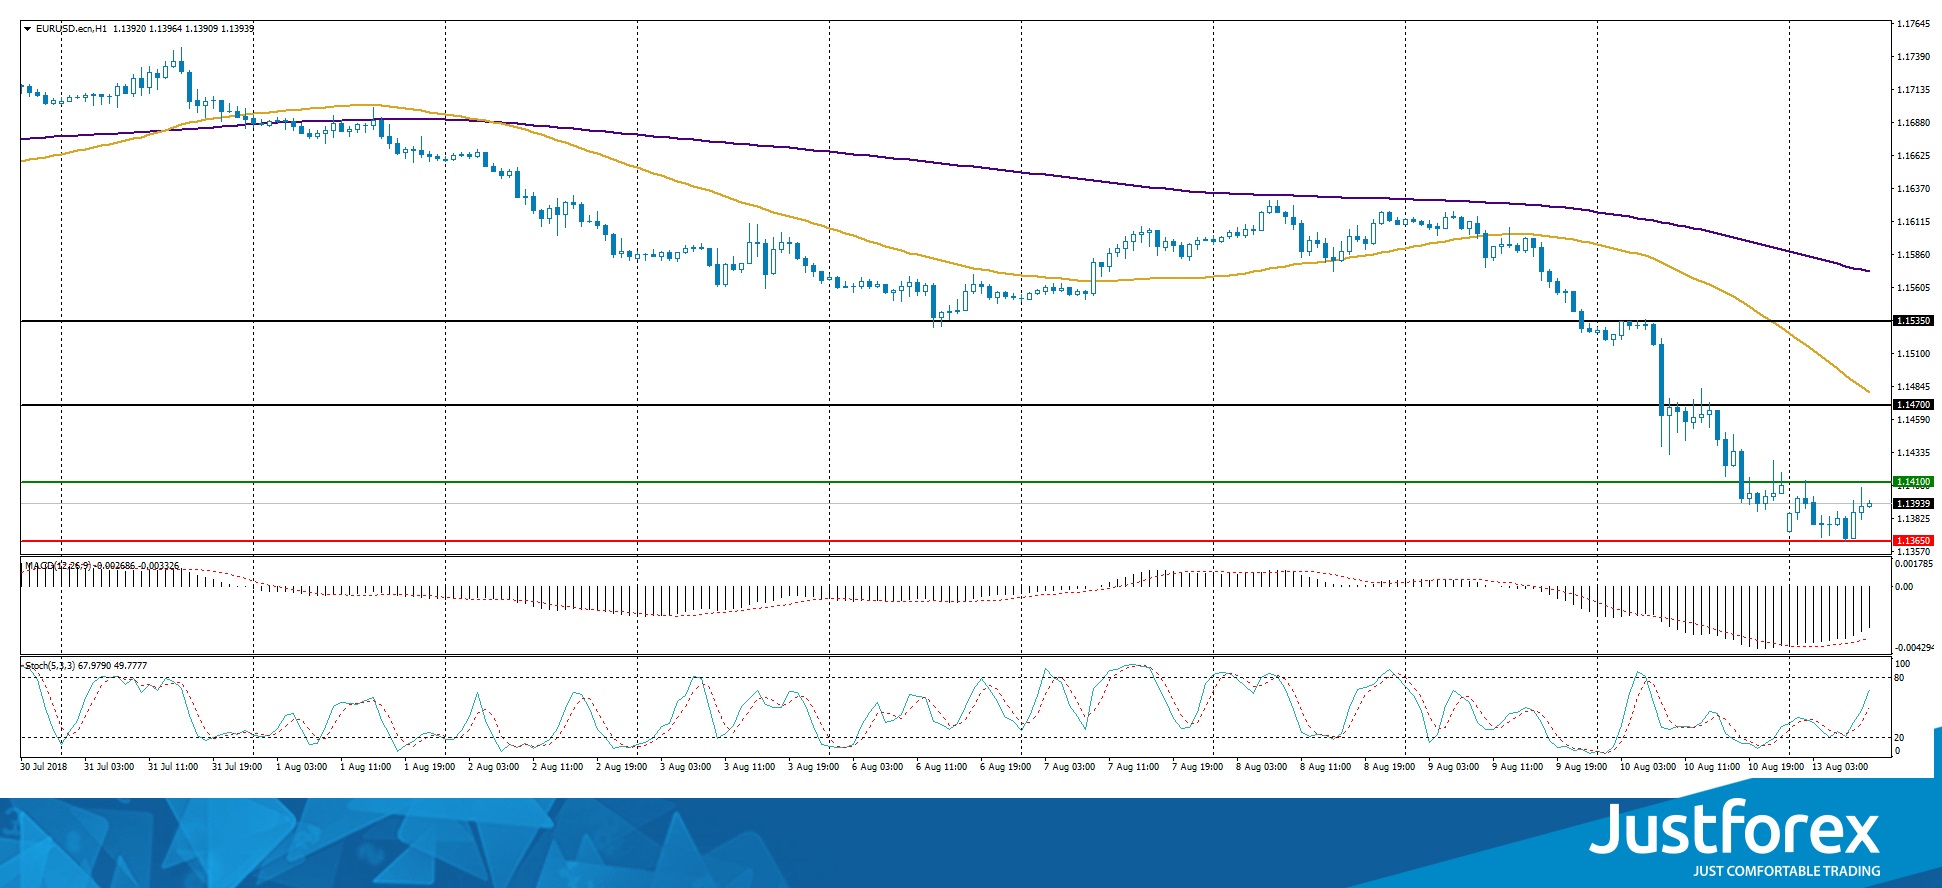
The price has fixed below 50 MA and 200 MA, which indicates the power of sellers.
The MACD histogram is located in the negative zone, but above the signal line, which gives a weak signal to sell EUR/USD.
Stochastic Oscillator is in the neutral zone, the %K line is above the %D line, which indicates a possible correction.
Trading recommendations
Support levels: 1.13650, 1.13250, 1.13000
Resistance levels: 1.14100, 1.14700, 1.15350
If the price fixes below the support level of 1.13650, it is necessary to look for entry points to the market to open short positions. The movement is tending to 1.13250-1.13000.
Alternative option. If the price fixes above 1.14100, a correction of the EUR/USD currency pair is expected. The movement is tending to 1.14500-1.14700.
The GBP/USD currency pair
Technical indicators of the currency pair:
Prev Open: 1.28240
Open: 1.27406
% chg. over the last day: -0.43
Day's range: 1.27405 – 1.27795
52 wk range: 1.2361 – 1.4345
At the moment, the GBP/USD currency pair is consolidating after a prolonged fall. The technical pattern is ambiguous. Quotes are testing local support and resistance levels: 1.27350 and 1.27800, respectively. Investors expect new information regarding Brexit. In the near future, a technical correction is not ruled out. Positions should be opened from the key levels.
The news feed on the UK economy is calm.
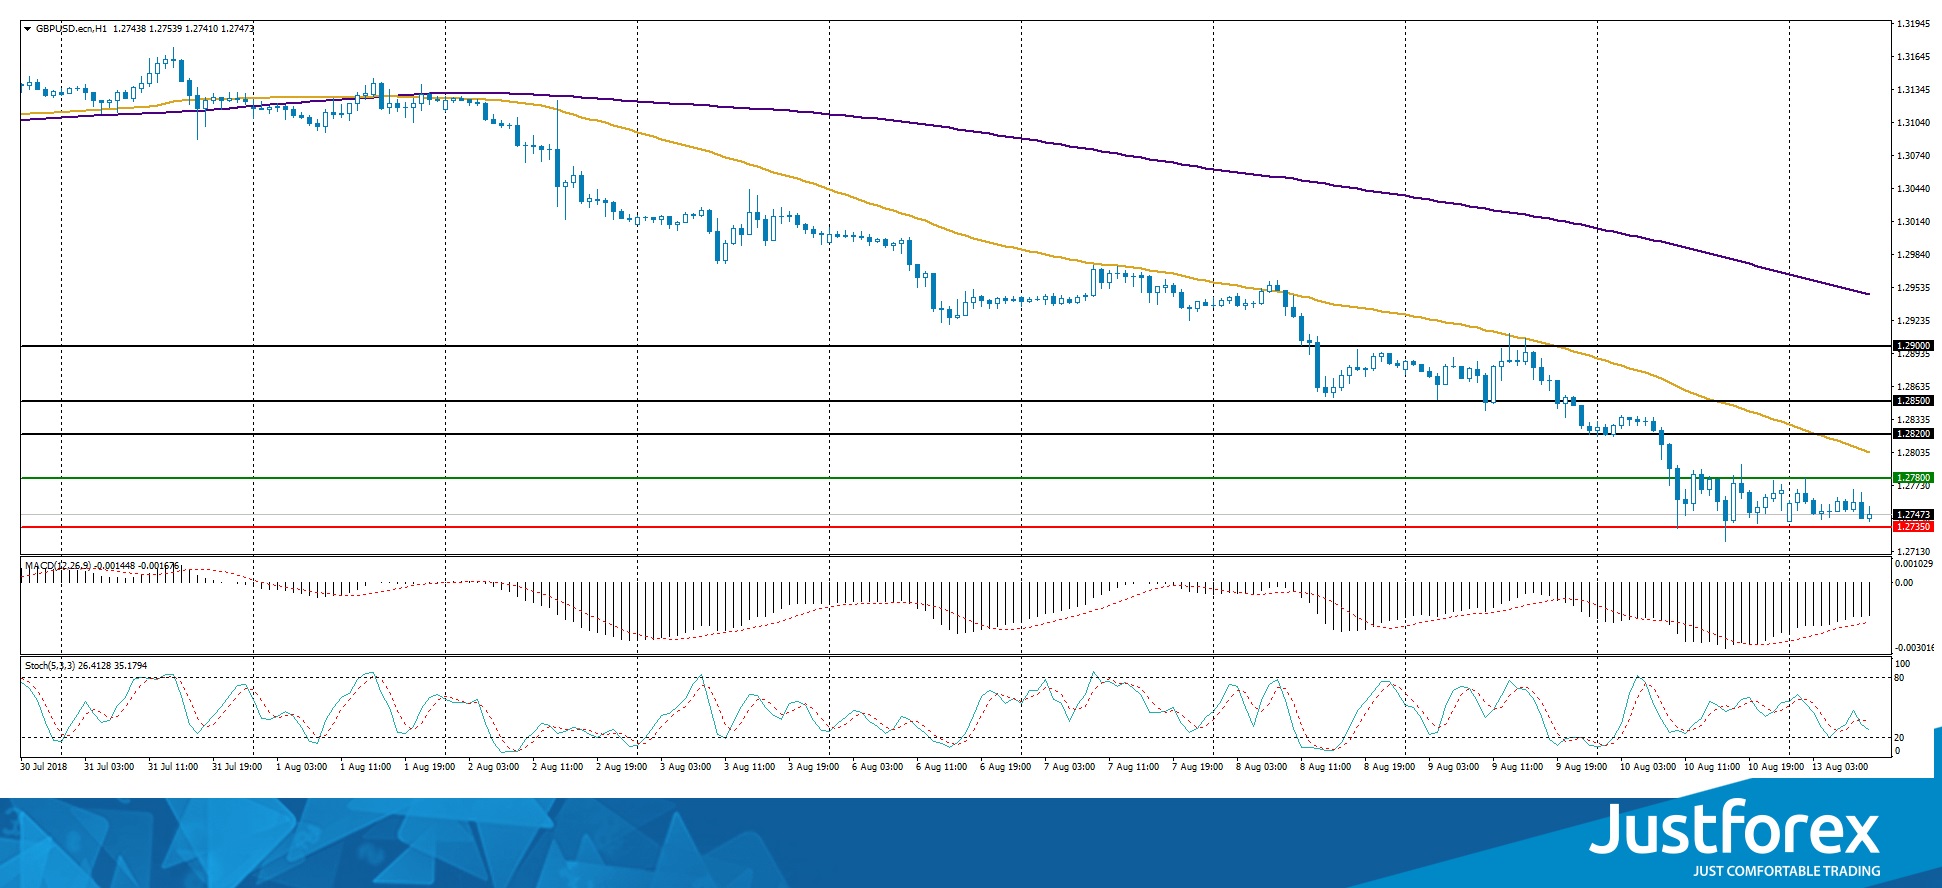
The price has fixed below 50 MA and 200 MA, which indicates the power of sellers.
The MACD histogram is in the negative zone, but above the signal line, which gives a weak signal to sell GBP/USD.
Stochastic Oscillator is located in the neutral zone, the %K line is crossing the %D line. There are no signals at the moment.
Trading recommendations
Support levels: 1.27350, 1.27000
Resistance levels: 1.27800, 1.28200, 1.28500
If the price fixes below 1.27350, the GBP/USD quotes are expected to fall. The immediate goal for profit taking is a round level of 1.27000.
Alternative option. If the price fixes above the resistance level of 1.27800, correction movement is expected. The movement is tending to 1.28200-1.28500.
The USD/CAD currency pair
Technical indicators of the currency pair:
Prev Open: 1.30494
Open: 1.31601
% chg. over the last day: +0.73
Day's range: 1.31371 – 1.31665
52 wk range: 1.2059 – 1.3795
The bullish sentiment continues to prevail on the USD/CAD currency pair. On Friday, August 10, the growth of quotes exceeded 100 points. At the moment, the trading instrument is testing monthly highs. The key range is 1.31350-1.31650. The USD/CAD currency pair has the potential for further growth. We recommend opening positions from the key levels.
The publication of important economic reports from Canada is not planned.
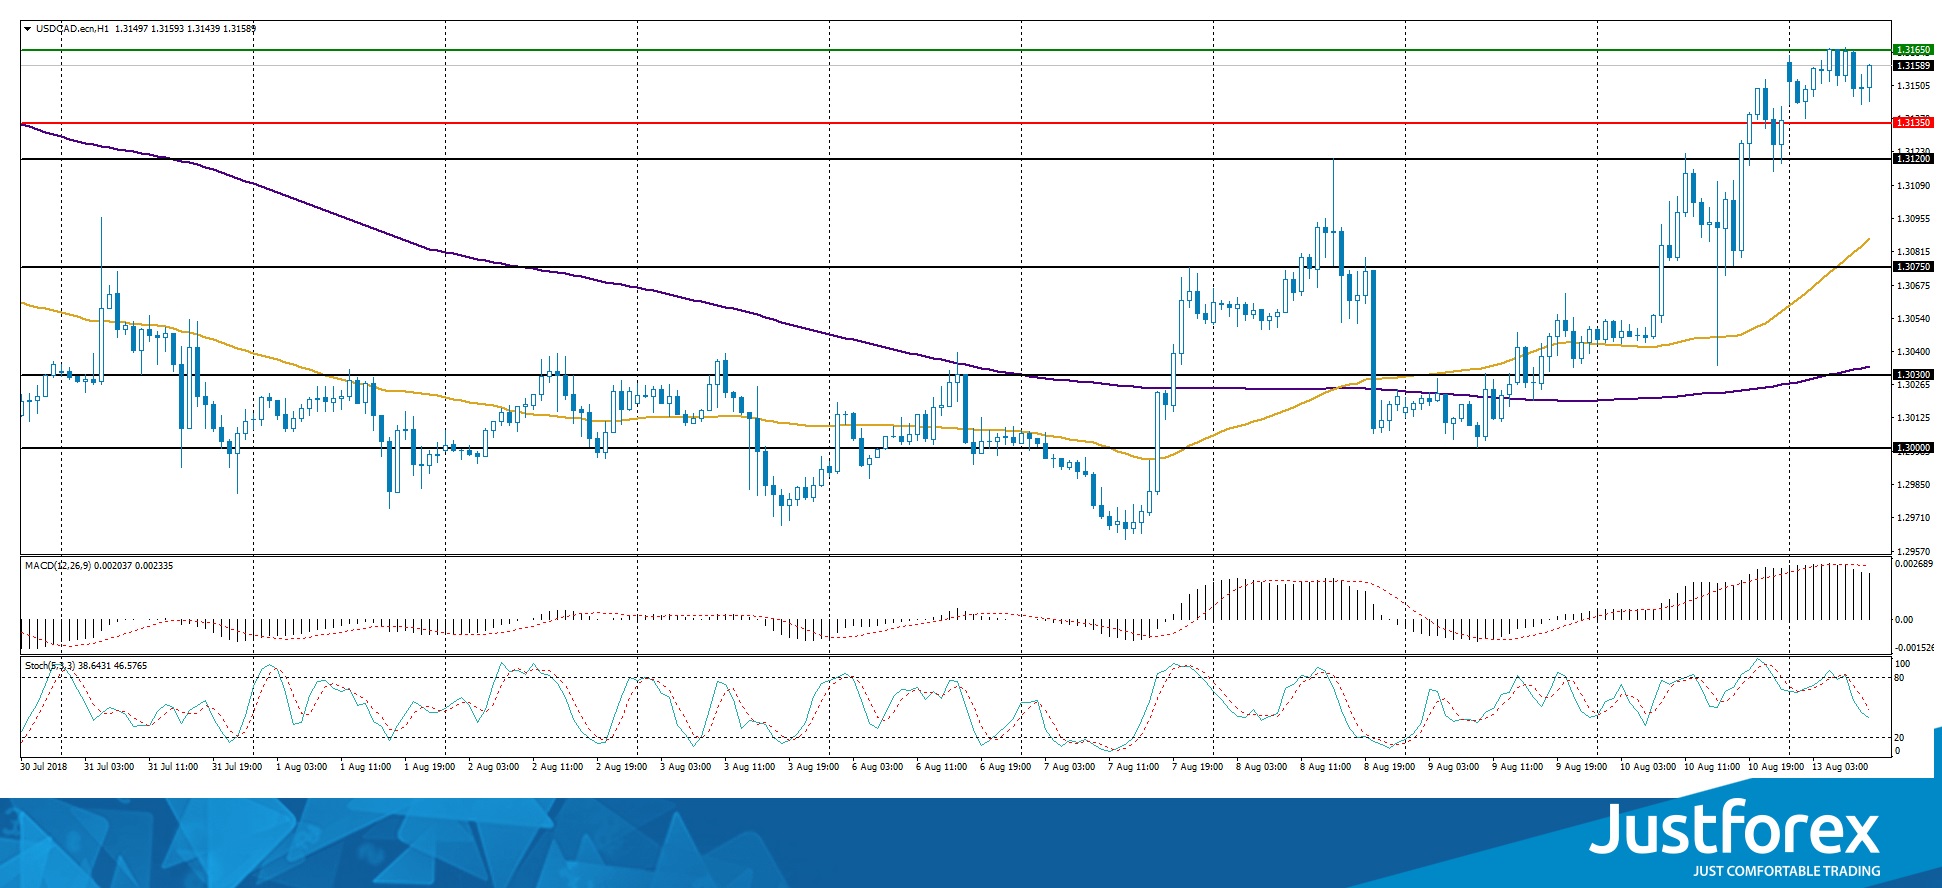
The price has fixed above 50 MA and 200 MA, which indicates the power of buyers.
The MACD histogram is in the positive zone, but below the signal line, which gives a weak signal to buy USD/CAD.
Stochastic Oscillator is located in the neutral zone, the %K line is below the %D line, which indicates the USD/CAD correction.
Trading recommendations
Support levels: 1.31350, 1.30750, 1.30300
Resistance levels: 1.31650, 1.32000
If the price fixes above the resistance level of 1.31650, the USD/CAD quotes are expected to grow. The movement is tending to 1.32000-1.32250.
Alternative option. If the price fixes below 1.31350, it is necessary to consider sales of USD/CAD. The movement is tending to 1.31000-1.30750.
The USD/JPY currency pair
Technical indicators of the currency pair:
Prev Open: 111.005
Open: 110.429
% chg. over the last day: -0.13
Day`s range: 110.109 – 110.751
52 wk range: 104.56 – 114.74
Sales are prevailing on the USD/JPY currency pair. The demand for safe assets grew due to political tension between the US and Turkey. At the moment, the USD/JPY quotes are testing local support of 110.150. The 110.500 mark is already a "mirror" resistance. The trading instrument has the potential for further reduce. We recommend opening positions from the key levels.
The news feed on the economy of Japan is calm.
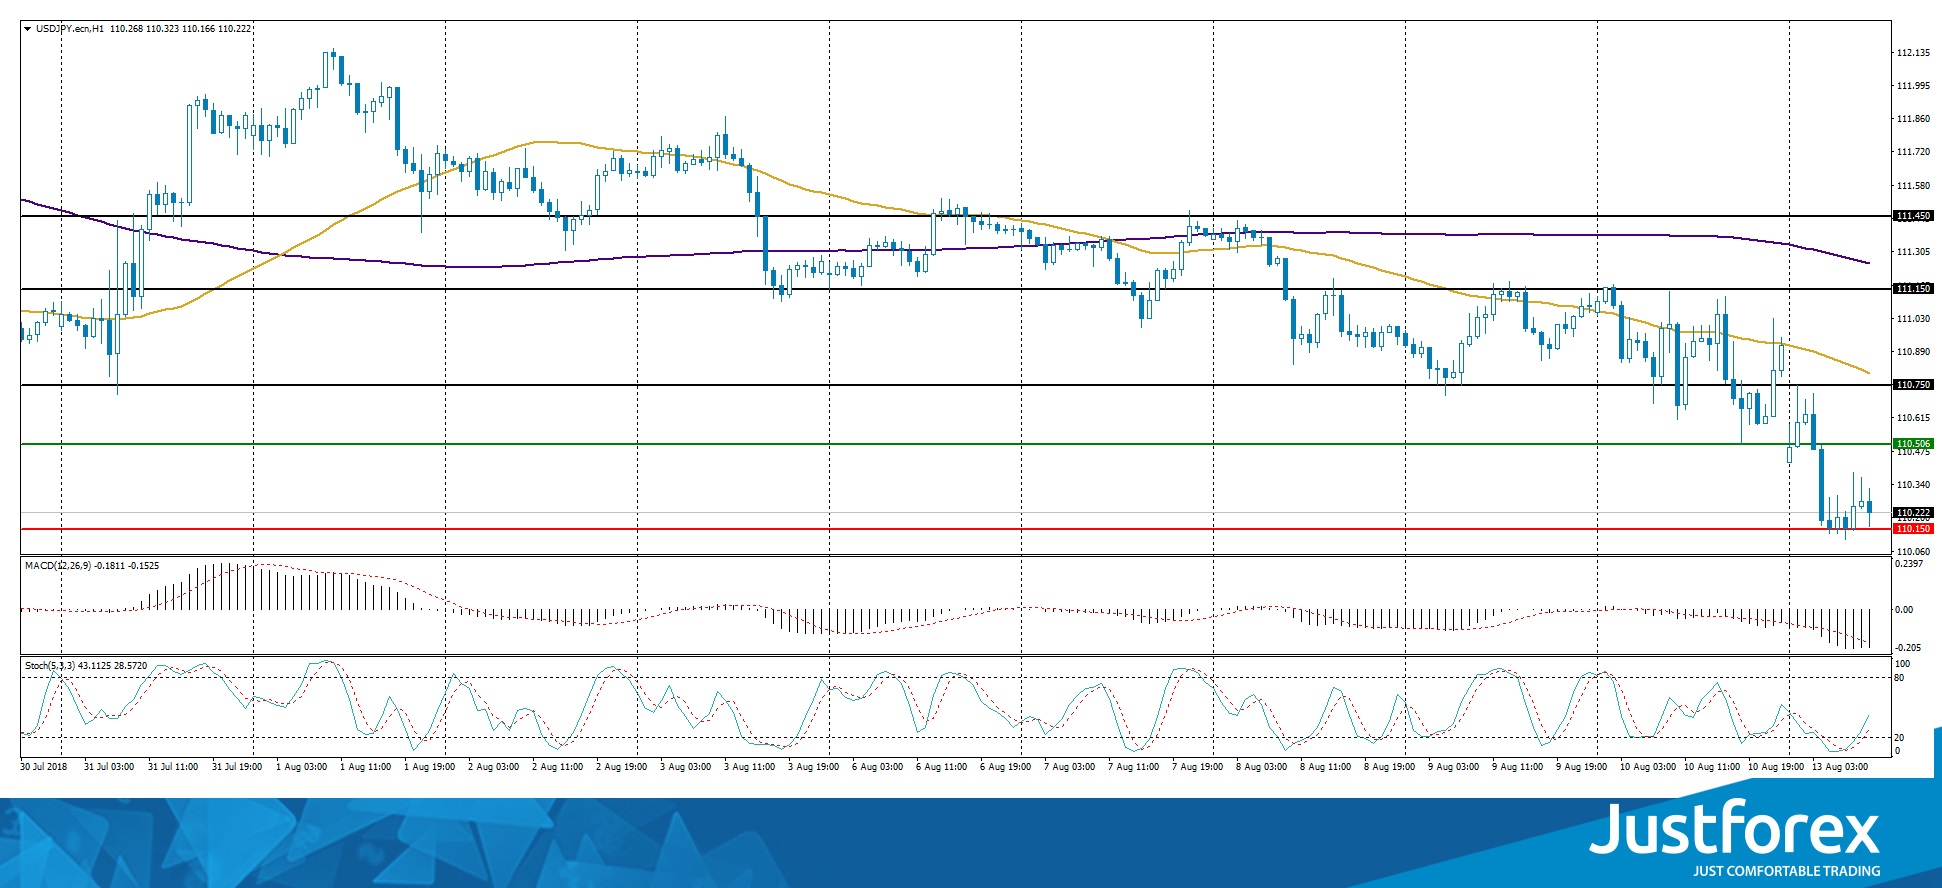
The price has fixed below 50 MA and 200 MA, which indicates the power of sellers.
The MACD histogram is in the negative zone and below the signal line, which gives a strong signal to sell USD/JPY.
Stochastic Oscillator is located in the neutral zone, the %K line is above the %D line, which gives a signal to buy USD/JPY.
Trading recommendations
Support levels: 110.150, 110.000, 109.500
Resistance levels: 110.500, 110.750, 111.150
If the price fixes below the level of 110.150, it is necessary to look for entry points to the market to open short positions. The movement is tending to 109.750-109.500.
Alternative option. If the price fixes above the level of 110.500, the USD/JPY currency pair is expected to grow. The movement is tending to the round level of 111.000.
Conflict Between The US And Turkey Is In The Focus Of Attention
On Friday, the US dollar strengthened significantly against the basket of major currencies. The US dollar index (#DX) updated the monthly high and closed in the positive zone (+0.90%). The growth of the US currency was triggered by the conflict between the US and Turkey. The US imposed sanctions for Turkey due to the arrest of Andrew Brunson, a Protestant pastor and the US citizen. On Friday, Donald Trump doubled duties on Turkish steel and aluminum. Financial market participants assess risks for the European banking system due to a significant weakening of the Turkish lira.
The British pound weakened after the release of weak data on the UK GDP. On a monthly basis, GDP growth slowed down to 0.1%, while experts expected 0.2%. In annual terms, GDP counted to 1.3% in the second quarter, as investors expected. In turn, the manufacturing production in the UK increased by 0.4% in June and was above the expected value of 0.3%. Core consumer price index in the US, as expected, counted to 0.2% in July. The number of employed in Canada rose to 54.1K instead of 17.5K in July.
The "black gold" prices are consolidating. At the moment, futures for the WTI crude oil are testing a mark of $67.45 per barrel.
Market Indicators
On Friday, there was the bearish sentiment in the US stock market: #SPY (-0.67%), #DIA (-0.73%), #QQQ (-0.76%).
At the moment, the 10-year US government bonds yield is at the level of 2.86%-2.87%.
The news feed on 2018.08.13:
Today, important economic data are not expected to be published
Toxic Turkish Lira Can Push Euro To $1.04
The collapse of the Turkish lira spreads its toxic influence on the European and EM financial markets. Asian bourses have been losing more than 1% at Monday morning amid the increased demand for safe-haven assets. The futures on S&P500 lose 0.1% at the start of Monday trades, falling for the fourth trading session in a row.
In addition, most of the emerging countries' currencies, including the Mexican peso and the South African rand, are under pressure. The Turkish lira has lost 11% to 7.11 per dollar since the start of trading on Monday, but somewhat stabilized after the country's Minister of Finance gave an assurance that the government was working on a draft plan to stabilize the situation.
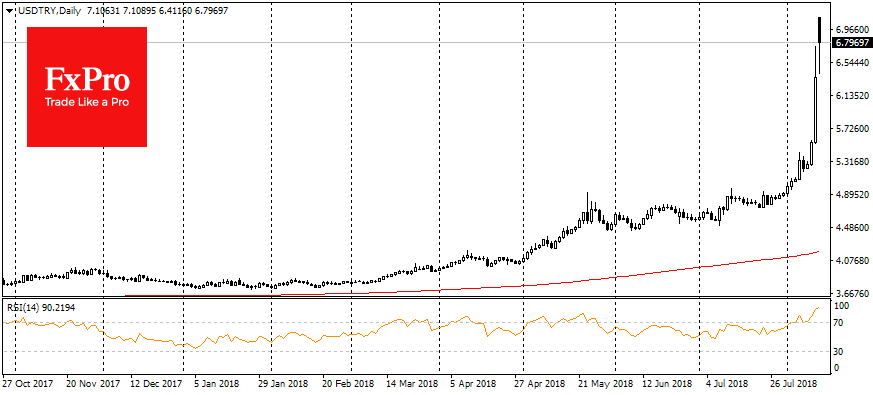
Thus, the epicentre of problems has moved from the Asian region and trade conflicts between the USA and China, the demand for the yen as a currency-haven has again increased. On Monday morning it adds to almost all the most traded currencies, including the dollar.
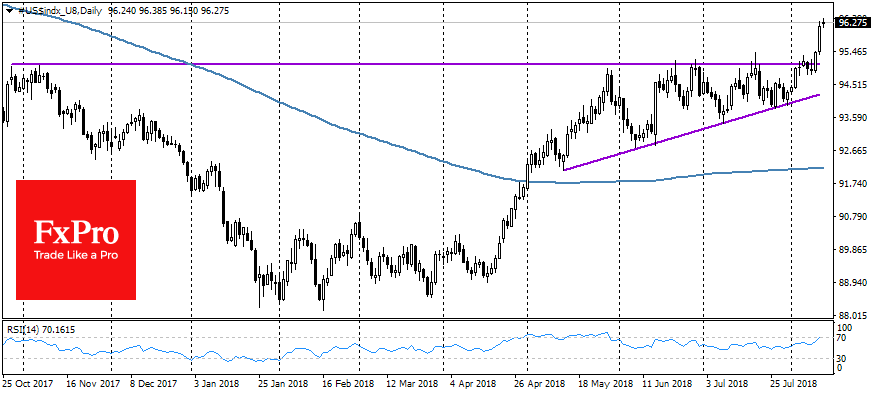
The technical analysis is on the side of dollar bulls. The dollar index came out of the trading range of the previous four months with a powerful movement, which is a strong signal demonstrating the continued growth of the American currency. The targets for the bulls may be near a psychologically important level of 100, which is about 4% higher than the current mark. It is possible that we can see even more decisive offensive of the American currency.
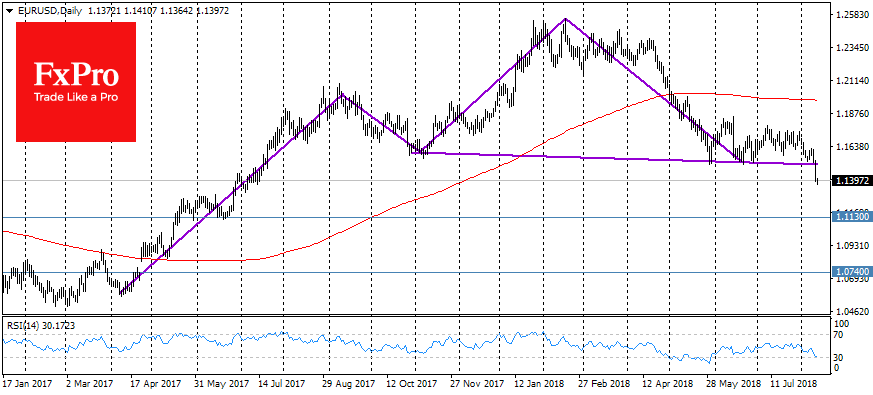
The common currency was also hit. On Monday morning EURUSD loses 0.2% after a decrease of 1% on Friday. The relationship between the Turkish economy, which goes down the drain following the lira, and the EU financial sector is capable of generating speculation that the ECB can change its plans to raise rates by deferring them to a later date than the summer of 2019. The EURUSD collapse last week could be a serious signal to decrease for the single currency.
It is technically worth paying attention to the “head-and-shoulders” formation. The falling below support line at 1.15 last week marked the overcoming of the “neck line” in this technical figure, which opens the way to the area of the start 2017 lows, near 1.04.
The strengthening of the dollar has only limited impact on the gold. The precious metal dropped by $1208 per ounce from $1217, losing 0.8%, but by now it managed to stay above the recent lows for August at about $1205. Taking this mark can open the way to its deeper immersion. However, it is worth noting that the sale of the gold has lost its momentum, and after the consolidation a reversal to growth can be expected. This growth can be supported not only by the seasonal demand, but also by the investors' flight from developing markets to safe-heavens.