Sample Category Title
GBP/USD Recovery Could Face Many Hurdles
Key Highlights
The British Pound declined sharply below the 1.2950 support against the US Dollar.
There are two bearish trend lines in place with resistance at 1.2820 and 1.3010 on the 4-hours chart of GBP/USD.
The pair could correct higher, but it is likely to face sellers near 1.2800 and 1.2850.
Today, the UK Claimant Count Change figure for June 2018 will be released, which is forecasted to post 3.8K.
GBPUSD Technical Analysis
The British Pound tumbled this past week below the 1.2950 and 1.2800 support levels against the US Dollar. The GBP/USD traded as low as 1.2722 and it is currently consolidating in a range below 1.2800.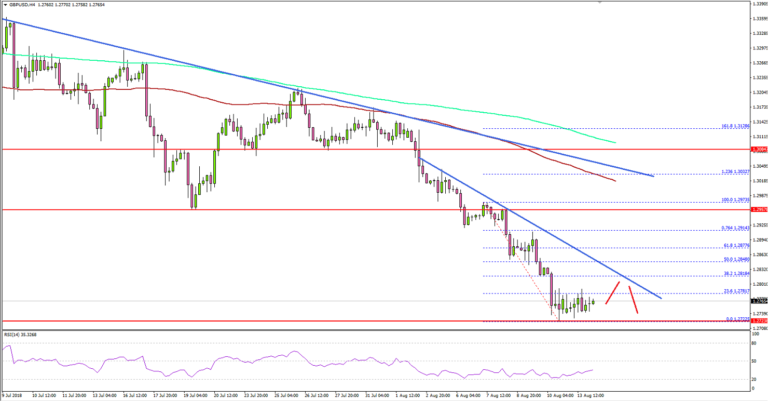
Looking at the 4-hours chart, the pair fell significantly after forming a top near the 1.3150 level. It dropped more than 400 pips and settled below 1.2800 plus the 100 simple moving average (4-hour, red).
It traded as low as 1.2722 and is currently consolidating losses. An initial resistance is around the 1.2780-1.2800 area. It coincides with the 38.2% Fib retracement level of the last decline from the 1.2973 high to 1.2722 low.
Moreover, there are two bearish trend lines in place with resistance at 1.2820 and 1.3010 on the same chart. Above the first trend line, the 50% Fib retracement level of the last decline from the 1.2973 high to 1.2722 low at 1.2848 could act as a resistance.
Therefore, if the pair corrects higher, it may perhaps face many hurdles near the 1.2800, 1.2845 and 1.2900 resistance levels.
On the downside, the recent low of 1.1367 is an initial support. A break below 1.2700-20 could accelerate declines towards the 1.2500 level in the near term.
Economic Releases to Watch Today
- UK Claimant Count Change June 2018 – Forecast 3.8K, versus 7.8K previous.
- UK ILO Unemployment Rate June 2018 (3M) – Forecast 4.2%, versus 4.2% previous.
- German Consumer Price Index for July 2018 (YoY) – Forecast +2.0%, versus +2.0% previous.
- German Consumer Price Index for July 2018 (MoM) – Forecast +0.4%, versus +0.4% previous.
- Euro Zone Gross Domestic Product Q2 2018 (Preliminary) (QoQ) – Forecast 0.3%, versus 0.3% previous.
- US NFIB Business Optimism Index July 2018 – Forecast 106.9, versus 107.2 previous.
Weaker than expected data show further cool down in China
A batch of weaker than expected July economic data from China showed the economy has cooled further.
Retail sales grew 8.8% yoy, down from prior 9.0% and missed expectation of 9.2% yoy. Industrial production grew 6.0% yoy, unchanged from prior 6.0% yoy but missed expectation of 6.3% yoy. Fixed asset investment growth slowed to 5.5% ytd yoy, down from 6.0% yoy and missed expectation of 6.0% yoy. Unemployment rate rose to 5.1%, up from 4.8%.
In particular, fixed asset investment growth was the slowest on record since early 1996. That suggested weakening business confidence that could be hurt by rising trade tensions with the US, as well as China's own deleveraging policy. Weak retail sales highlights the difficulty of shift focus to domestic consumption for growth momentum, in case of a full-blown trade war.
Eco Data 8/14/18
[php_everywhere instance="1"]
Eurozone Industrial Production and German ZEW Economic Sentiment Could be Next to Drive the Euro
While Eurostat’s second GDP growth estimate is expected to confirm on Tuesday that the bloc’s economic growth slowed down in the second quarter, eurozone’s industrial production is anticipated to have picked up steam in June. At the same time in Germany, the ZEW institute is projected to say that economic sentiment in the biggest EU economy has improved but is still negative, with the euro probably bouncing higher if the data indicate a stronger improvement than analysts forecast.
In May, eurozone’s industrial production surprisingly rebounded, printing a growth of 2.4% on a yearly basis, with analysts suggesting now that the measure has further increased positive momentum in June, reaching an expansion pace of 2.6% y/y. The numbers are likely to give some relief to investors who are worried about the EU’s factory performance given the ongoing trade dispute between the US and the rest of the world including the EU, and specifically, Washington’s threats to impose import tariffs on cars and auto parts. A move which if implemented, could hit Germany’s giant auto export market and therefore the bloc’s economic health as the German economy accounts for over a fifth of EU GDP. Recall that Germany’s factory orders tumbled by 4.0% in June on a monthly basis, recording the sharpest decline since March 2017.
Staying in Germany, traders will be closely watching the ZEW indicator of economic sentiment for direction as well. The index is forecast to remain below zero for the third consecutive month in August, probably coming in at -20.7. But compared to July’s bearish mark of -24.7, which was the lowest level reached in almost five years, some investors could speculate that the index has reached a bottom and is now trying to recover.
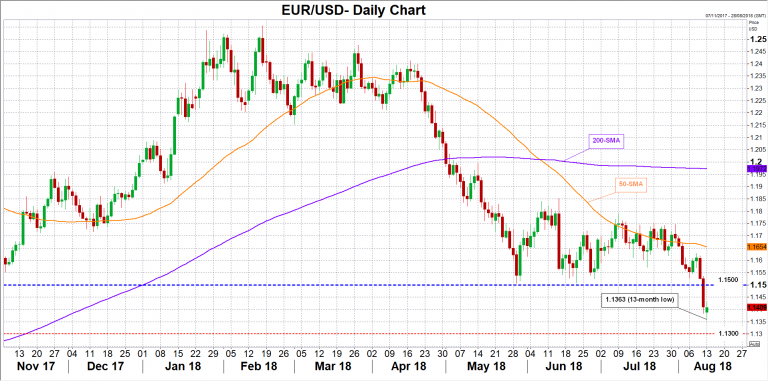
Turning to forex markets, euro/dollar spiked to a 13-month low of 1.1363 on Monday after the Turkish President called the dispute with the US “an economic war”, raising fears that the battered Turkish lira could put European loans provided to Turkish borrowers under risk. Later in the day, the Turkish central bank announced measures to keep liquidity moving but the euro gained little on the news, crawling marginally above the 1.1400 round level. Should eurozone industrial production and/or German ZEW economic sentiment numbers come in higher than analysts estimate, the euro could touch the 1.1500 key level again where the market found strong support between the end of May and early August.
On the other hand, a miss in data could strengthen bearish actions towards the 1.1300 mark.
An update on EUR/JPY short
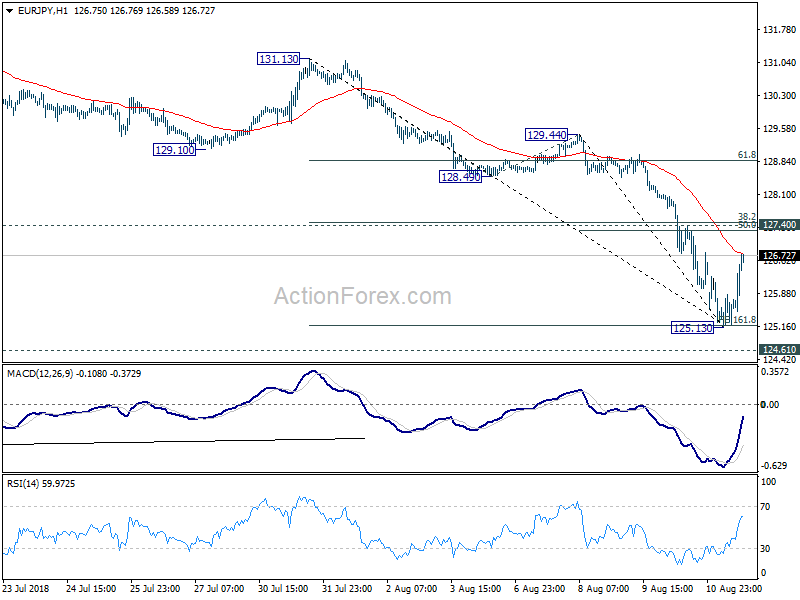
Following up on EUR/JPY short (sold at 128.60, stop at 127.45). Last post here. EUR/JPY's fall to 125.13 and rebound from there today was much quicker than we thought. 161.8% projection of 131.13 to 128.49 from 129.44 at 125.16 was just met but there was no follow through selling. And we actually missed quite a good opportunity to get out and re-sell. Nonetheless, the position short trade is still doing alright.
Based on strong downside momentum, fall from 131.13 is seen as a five wave impulsive move. Rebound from 125.13 should form part of a wave four consolidation pattern. Then there will be another decline to complete the five wave sequence. We'd expect upside of the corrective rise from 125.13 to be limited by 127.40 resistance. This level is close to 38.2% retracement of 131.13 to 125.13, as well as 50% retracement of 129.44 to 125.13.
So, we'll keep the stop at 127.45. Meanwhile, firstly, a wave four consolidation in this case may take quite some time to develope. And the subsequent downside potential could be limited considering that it's already close to 124.61 low. Therefore, we'll close the short position on a dip to 126.00.
How to Write a Trading Plan
The trading plan is a complete guide of what trader will do in the markets. The plan should include clear rules for entering and exiting the market, money management rules, as well as describe time frames, trading instruments. It should be drawn up before starting trading.
The trading plan consists of:
1. Trading style. Define what type of trader you are: scalper, a day, a swing, or a position trader. For example, scalpers execute a big amount of trades during a short period and fix profit in several pips, while swing traders hold transactions from a few days to a couple of weeks.
2. Traded financial instruments. There are a lot of instruments to choose from: currency pairs, metals, commodities, CFDs etc. Each of the instruments has their own characteristics and trading conditions. For beginners, it is recommended to choose 4-5 trading instruments and study them thoroughly.
3. Signals to enter the market. Make an analysis of the current market situation. You can do it using instruments of technical analysis: MACD histogram or Stochastic Oscillator, support and resistance levels, chart patterns etc. Whatever trading strategy the trader is using, it is necessary to make sure of the reliability of a signal.
Analyze the fundamental data and assess their impact on the currency. Monitor the news in the economic calendar. It is not recommended to open transactions 30 minutes before and 30 minutes after the release.
4. Signals to exit the market. Identify when you will close the position. It is important to have a sure strategy according to which you will exit the market.
5. Stop Loss and Take Profit levels. These orders help traders limit losses and fix profits at sharp market movements. To limit losses, determine the amount you can afford to lose and place Stop Loss. The recommended risk level should be 2-3% of the trading capital for each transaction.
Take Profit is used to fix profit. The standard loss/profit ratio is 1:3. The potential profit should exceed the risk in several times.
6. Analysis of transactions. Analyze your closed transactions, note the results and make mistakes correction. In such a way you can improve your trading strategy.
7. Trading goals. Write what you want to achieve on Forex. The goals should be clear and achievable. Strive for ideal deals written in your trading system.
The Forex trading plan has to meet exactly your requirements and strategy and includes specific items that need to be corrected from time to time. Plan your trading and follow your trading plan.
Shaky Pound Turns its Gaze to Key Data for Relief as Brexit Talks Loom
This week will bring a raft of key data points out of the UK, including employment, inflation, and retail sales releases. Forecasts point to figures that are likely to confirm the UK economy remains on a solid footing. While a set of decent prints could help trigger a relief bounce in sterling, any rallies in the currency may remain relatively short-lived, at least until there are some signs of progress in the Brexit talks – which are set to resume on Thursday.
The UK will be on the receiving end of several key economic data this week. Employment figures for June will hit the markets on Tuesday, before CPI inflation prints for July are released on Wednesday, ahead of retail sales numbers for the same month on Thursday – all due out at 0830 GMT on their respective days. After the data releases, market attention will likely turn back to the Brexit negotiations.
Kicking off with the jobs prints, the unemployment rate is projected to remain unchanged at the four-decade low of 4.2%, while average weekly earnings are expected to have risen at the same pace as in the previous month on a yearly basis, both including and excluding bonuses. Specifically, by 2.5% year-on-year including bonuses, and by 2.7% excluding bonus payments.
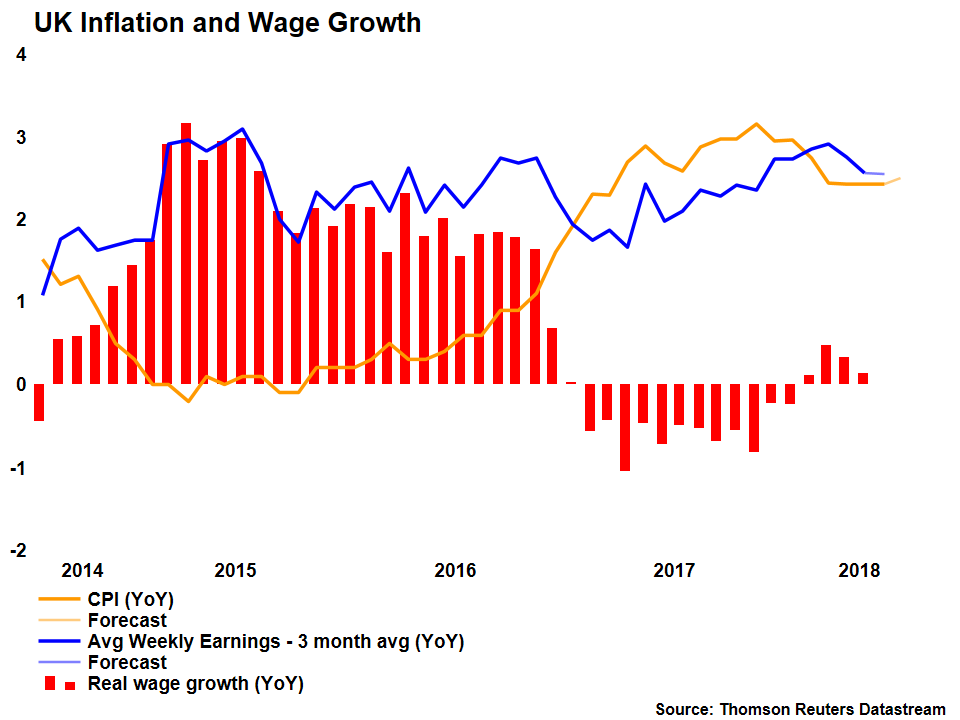
Turning to the inflation numbers, the UK CPI rate is anticipated to have ticked up to 2.5% in yearly terms from 2.4% previously, while the core rate that excludes volatile food and energy items is expected to have held steady at 1.9%, just a hair away from the Bank of England’s (BoE) 2% inflation target. Hence, the anticipated pickup in the headline CPI print appears to be owed mainly to movements in oil prices, which the BoE typically “looks through” as being transitory effects that will fade soon.
Then on Thursday, the nation’s retail sales are forecast to have rebounded to 0.2% in monthly terms, following a 0.5% drop previously. Similarly, the core rate that strips out automobiles and fuel is anticipated to have risen by 0.1%, after falling by 0.6% in the previous month. That said, trackers of retail sales were not particularly encouraging, with the BRC gauge slowing and the CBI distributive trades index declining in July. Consumer spending figures from credit card company Visa were soft as well.
As for the British pound, it has been under severe pressure lately, trading at one-year lows against both the dollar and the yen amid concerns that a no-deal Brexit is becoming increasingly more realistic. The cautious tone by the BoE at its latest policy gathering didn’t do the currency any favors either, dampening expectations for more rate increases in the foreseeable future. Market pricing suggests investors only see an 80% probability for the Bank to raise rates again by December 2019, according to the UK OIS.
While an upbeat set of data this week may bring forward market expectations for a potential BoE rate increase and hence trigger a relief bounce in sterling, one remains hesitant to trust any sustained advances in the currency with the Brexit talks currently at such an uncertain juncture. In other words, until some progress in the EU-UK negotiations is evident, any potential rallies in sterling owed to upbeat data may remain relatively short-lived. The next round of Brexit talks is scheduled to begin on Thursday, 16 August. Any relevant headlines could be critical for the pound’s forthcoming direction, especially after the “data risk” is out of the way.
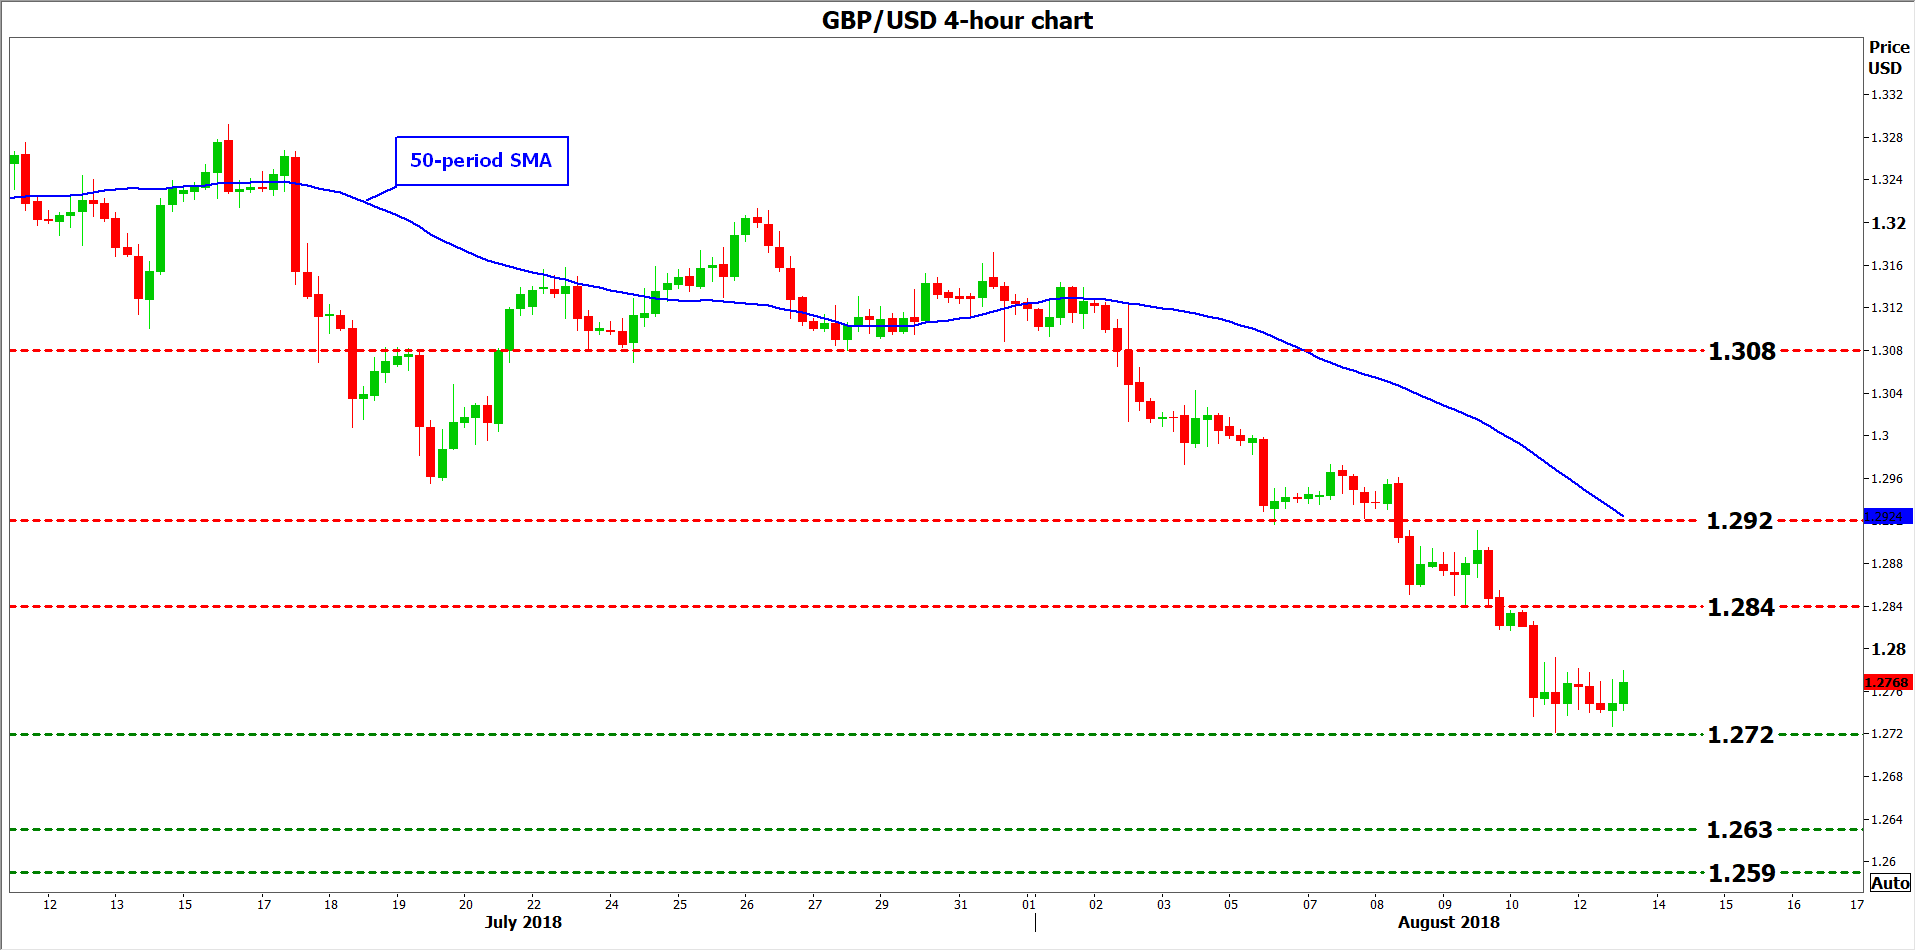
Taking a technical look at sterling/dollar, in case of a rebound immediate resistance to advances may be found near the 1.2840 hurdle, defined by the lows of August 9. Even higher, the 1.2920 area marked by the August 7 lows could attract attention, before the 1.3080 barrier comes into view.
Conversely, in case of further declines, preliminary support may come around the pair’s 14-month low of 1.2720. A downside break could pave the way for the 1.2635 zone initially, identified by the June 12, 2017 lows. Even lower, buy orders may be found near 1.2590, the pair’s trough from June 21, 2017.
AUDJPY Rises following rebound from 21-month low; strongly bearish in near term
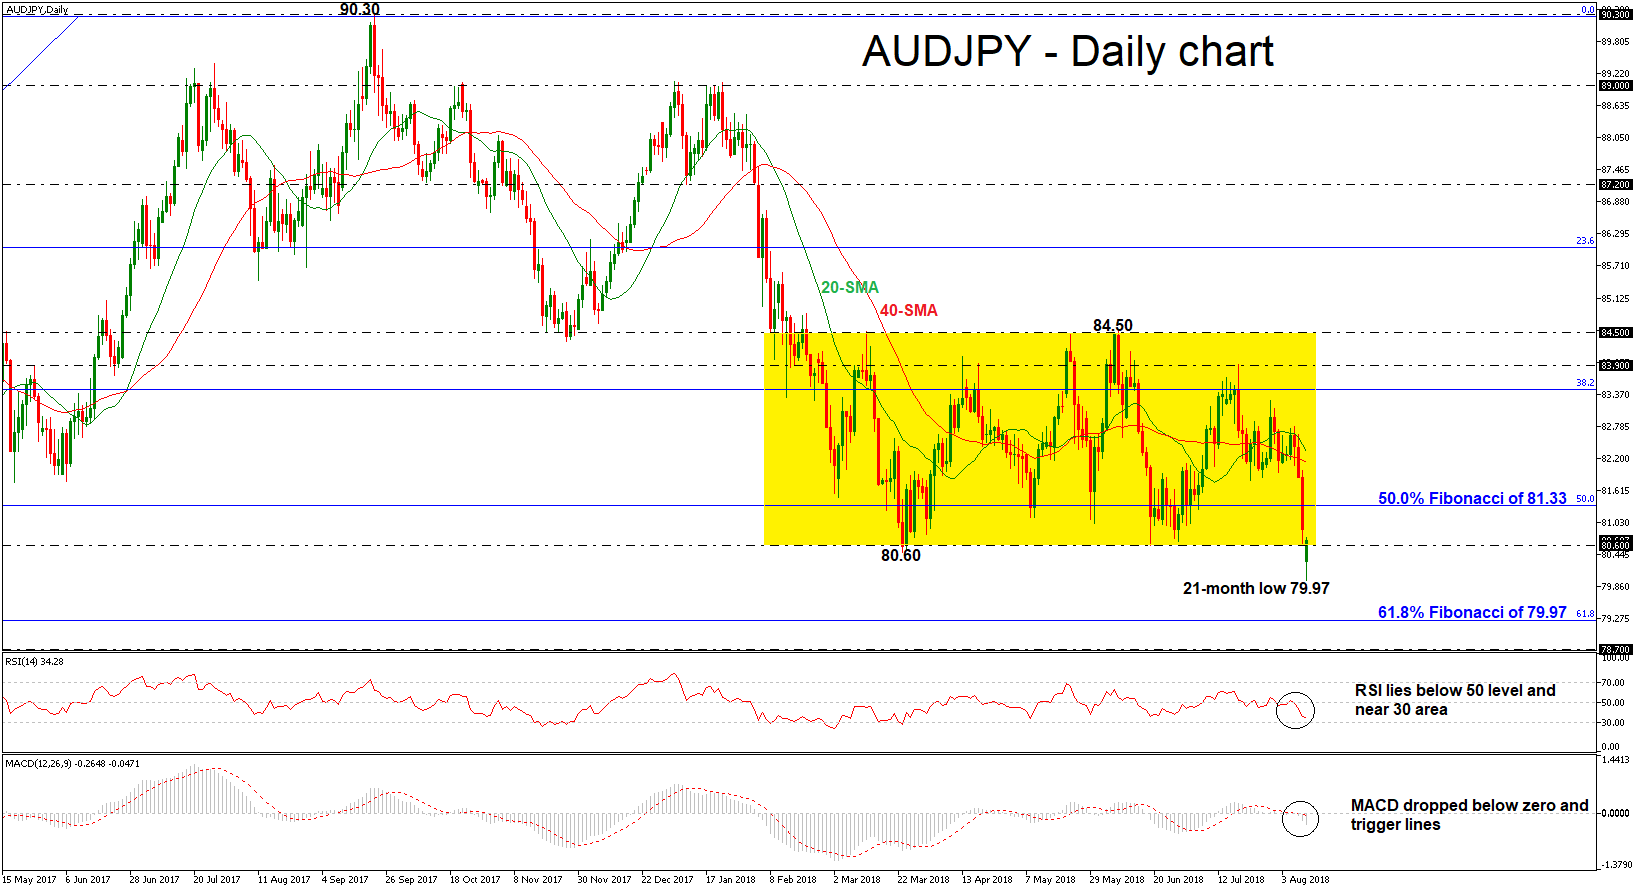
AUDJPY plummeted to a new 21-month low of 79.97 earlier today, slipping below the trading range of 84.50 – 80.60 that had been holding since February 9. The bearish scenario is further supported by the deterioration of the technical indicators and the negative aligned moving averages in the daily timeframe.
Looking at momentum oscillators, further declines are expected in the near future despite the fact that the price is trying to pare the negative gap it posted today. The RSI is below its neutral 50 line, detecting negative momentum, and is also pointing downwards. The MACD, already negative, lies below its trigger and zero lines.
Should the pair manage to strengthen its negative momentum, the next support could come near the 61.8% Fibonacci retracement level of the upleg from 72.41 to 90.29, around 79.97. Below this level, support to declines could come from the 78.70 barrier, taken from the highs in September 2016.
A move to the upside could see immediate resistance at the 80.60 hurdle, and should the market increase positive momentum above this area, the 50.0% Fibonacci of 81.33 could be the next level in focus. A stronger barrier though, could be found at the 38.2% Fibonacci of 83.45, but the price first needs to surpass the 20- and 40-day simple moving averages (SMAs) at 82.14 and 82.35 respectively in the near-term.
Turning to the medium-term picture, the market seems to be in a bearish mode given that the price develops below the consolidation area and the moving averages, which seem ready to record a negative cross.
GBPUSD: Vulnerable, Retains Downside Pressure
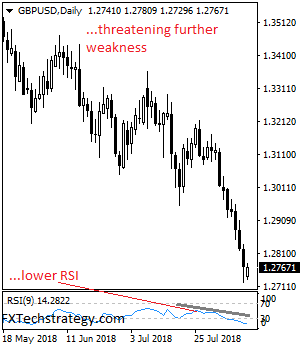
GBPUSD: The pair continues to retain its downside pressure selling as it retains its broader downside pressure. Support lies at the 1.2700 level where a break will turn attention to the 1.2650 level. Further down, support lies at the 1.2600 level. Below here will set the stage for more weakness towards the 1.2550 level. Conversely, resistance stands at the 1.2750 levels with a turn above here allowing more strength to build up towards the 1.2800 level. Further out, resistance resides at the 1.2850 level followed by the 1.2900 level. On the whole, GBPUSD remains biased to the downside medium term.
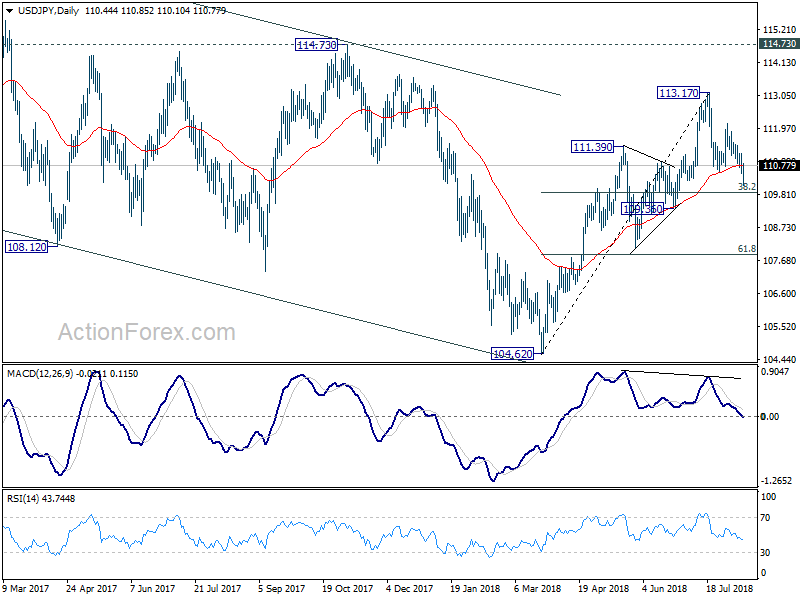
USD/JPY Mid-Day Outlook
Daily Pivots: (S1) 110.57; (P) 110.87; (R1) 111.23; More...
Outlook is USD/JPY remains unchanged. While the correction from 113.17 might still extend lower, we'd expect strong support from 38.2% retracement of 104.62 to 113.17 at 109.90 to contain downside and bring rebound. On the upside, above 111.17 minor resistance will turn bias back to the upside. Further break of 112.14 will bring retest of 113.17 high. However, firm break of 109.90 will put focus on 109.36 key structural support level.
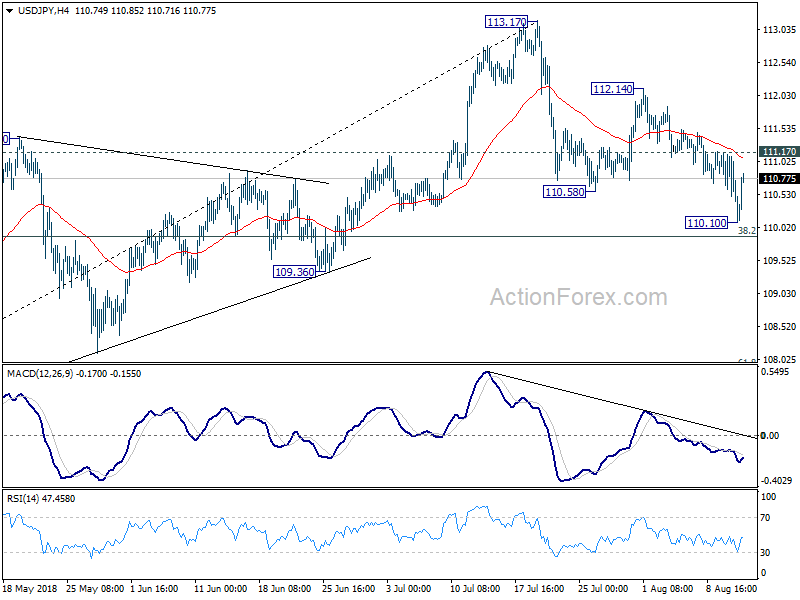
In the bigger picture, corrective fall from 118.65 (2016 high) should have completed with three waves down to 104.62. Decisive break of 114.73 resistance will likely resume whole rally from 98.97 (2016 low) to 100% projection of 98.97 to 118.65 from 104.62 at 124.30, which is reasonably close to 125.85 (2015 high). This will stay as the preferred case as long as 109.36 support holds.