
It was one of those wild week in the financial markets with a number of market moving themes. New Zealand Dollar was the worst performing one after RBNZ made itself clear that interest rate is going to stay low for longer. And the next move could either be up or down. Sterling extended prior week’s post dovish BoE selloff. The markets realized that a no-deal Brexit could now be more likely than not. Euro and Australian Dollar tied for the third weakest. Currency crisis in Turkey prompted deep fear of contagion and sent global stocks markets down. In particular, Eurozone would be vulnerable given its deep tie with Turkey.
Yen ended as the strongest one on risk aversion. Adding to that, 10 year JGB yield remained resilient, closing slightly above 0.1 handle at 0.102. It’s more than double of around 0.4% a month ago. Meanwhile, 10 year German bund yield ended the week down 0.089 to 0.322, comparing to August high at 0.494. US 10 year yields also lost 2.9 handle to close at 2.857, after failing to stay above 3.000 handle. Dollar followed as the second strongest one on safe haven flow while Swiss Franc was the third strongest. Strong Canadian GDP and employment data solidified the chance of October BoC rate hike. But Loonie was mixed as NAFTA negotiation dragged on, without Canada’s participation.
While Turkish currency crisis triggered violent moves in the markets. We’d like to emphasize that it didn’t created any changes in underlying trends. It just intensified the moves.
Turkey in currency crisis and there is no sign of resolution.
Selloff in Turkish Lira intensified last Friday and rocked the global financial markets. In the background, the economic outlook of the country worsened after re-elected President Tayyip Erdogan’s policies failed to alleviate the serious problems of high inflation and rapid currency devaluation. More importantly, his counter-common-sense economic policies are widely disapproved by economists. After Turkish central bank disappointed the markets by keeping interest rates unchanged at the July meeting, versus expectation of 100bps hike, the Lira was already at the edge of a cliff.
The push came from US sanctions for Turkey’s imprisonment of an American pastor. At that moment, Lira was already in deep selloff. And situation quickly worsened further on Thursday after Erdogan declared that “if they have their dollars, we have our people, our God.” Later on Friday, Erdogan showed no sign of backing down from the confrontation with the US, nor any sign of allowing the central bank to raise interest rates to curb inflation and capital outflow. He even called for citizens to save the TRY by selling foreign exchanges and golds. US Trump then fired another shot of “economic attack” on Turkey by announcing to double up the Steel and Aluminum Tariffs.
As a result, on Friday alone, the Lira depreciated 25%. And it’s now very clear that both sides, the US and Turkey, have chosen a confrontational path. There is little sign of de-escalation any time soon. Erdogan also doesn’t appear to have any intention to change his economic course. Though, we’ll see if Erdogan would turn to Russia for financial aid, or would there be some form of capital control to be imposed to curb Lira’s free fall.
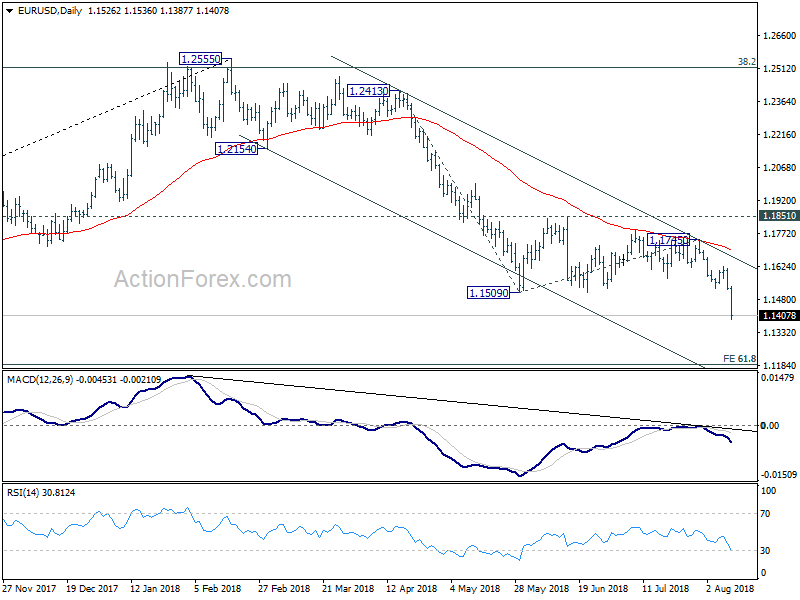
Euro dives on fear of contagion, and risks of longer ECB stimulus
The fear of contagion sent global equities lower while flight to safe haven boosted Dollar, Yen, Swiss Franc, and treasuries. Euro suffered with EUR/USD diving through an important support at 1.15. Spain, France and Italy are believed to be particular vulnerable due to the deep financial tie with Turkey. In particular, Spain’s BBVA, Italy’s UniCredit, and France’s BNP Paribas could be particularly impacted by the ongoing depreciation of the Lira. The development even triggered speculation that ECB could derail from its policy path to counter the worsening situation. That is, there is now risk that ECB would extend the asset purchase program beyond December, and thus, push the first hike farther away.
DAX steep selloff confirmed near term reversal after topping at 12886.83
Nonetheless, while the Turkish crisis prompted huge movements in the financial markets, they were just intensification of what’s already happening. They’re not new trends.
For example, we’ve pointed out last week that DAX has topped out at 12886.83 in near term. It’s initial corrective-looking recovery ended after closing prior Thursday’s gap. Friday’s selloff and break of 12493.20 support confirmed the bearish view that it’s heading back to lower trend line support (12282). There is prospect of falling through 12104.41 support after taking out the trend line. And this will now be the preferred case as long as 55 day EMA (now at 12625.87) holds. Overall, DAX is seen as in consolidation pattern from 13596.89 and some support would likely be seen around 11726.62 even if the selloff intensifies.
US 10 year yields started third leg of consolidation from 3.115, targeting 2.759
We’ve also noted that US treasury yields have probably topped in near term already. Last week’s sharp fall affirmed this view. 3.000 handle is proven to be too much for 10 year yield for now. The choppy rebound from 2.759, second leg of the corrective pattern from 3.115, is likely completed at 3.019. With 55 day EMA firmly taken out, TNX has likely started the third leg and should head to 2.759 and possibly below. Though, we’d expect strong support at 2.717 clusters, 38.2% retracement of 2.033 to 3.115 at 2.701, to contain downside and bring rebound.
Dollar index finally resumed up trend, 97.74/87 to test its real strength
Meanwhile, we’d like to emphasis too that Dollar’s strength is not solely due to problem in Turkey. And more importantly, the developments in the US are clearly Dollar-supportive.
In particular, known dove Chicago Fed President Charles Evans’ hawkish turn is worth a mention. He said that the economy is “extremely strong” and it’s “really a very good period of time” for both the economy and monetary policy setting. And Fed funds rate might eventually enter into “somewhat restrictive” area as economy strengthens while inflation stays above target. He cited it could be roughly 0.5% above his neutral rate of 2.75%. That is a signal that Fed’s tightening cycle could eventually be longer than currently expected.
Supporting that, US CPI was unchanged at 2.9% yoy in July. Core CPI unexpectedly accelerated to 2.4% yoy versus expectation of 2.3% yoy. The impact of trade war with China hasn’t really started to show any effect on prices yet. If further tightening in the labor market finally pushes unemployment rate through the natural rate, inflation could accelerate rather quickly.
And, the trade war with China is just at the beginning stage. Dollar seems to be lifted every time there is an escalation. All these are going to happen with or without the Turkish crisis.
Dollar index finally resumed the up trend from 88.25 and hit as high as 96.45 before closing at 96.35. As usual, there are many ways to interpretation prices actions. One interpretation is that price actions from 95.02 to 91.16 is a consolidation pattern that’s “skewed upwards”. If it’s true, the current rally should be rather powerful. Anyway, near term outlook will stay bullish as long as last week’s low at 94.99 holds. Next target is cluster level at 97.74/87, 61.8% projection of 89.22 to 95.02 from 94.16 at 97.74, 61.8% retracement of 103.82 to 88.25 at 97.87. Reaction to this cluster fibonacci level will reveal how powerful the Dollar’s rally is.
Position trading strategies – Hold short in GBP/CHF, EUR/JPY
We said in last week’s report that we’ll hold short in GBP/CHF and sell EUR/JPY at market when the week started.
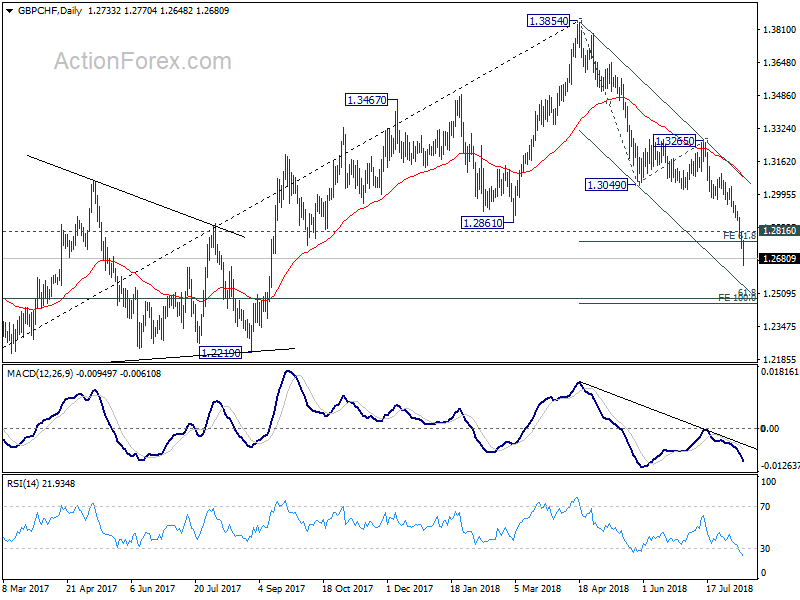
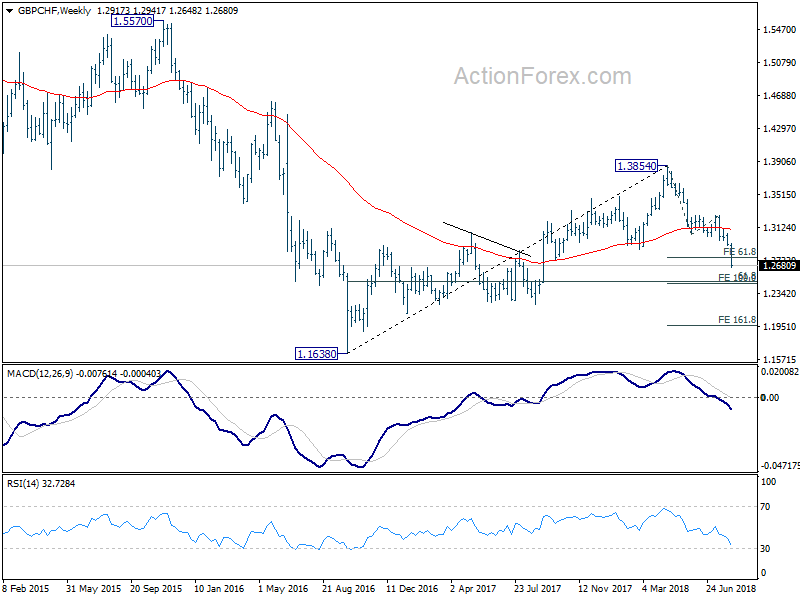
GBP/CHF short (sold at 1.2971) worked quite well as the cross dived to as low as 1.2648 so far. First target of 61.8% projection of 1.3854 to 1.3049 from 1.3265 at 1.2768 was already met. We suggested in this post to tighten up the stop to 1.2820 (slightly above 1.2816 minor resistance). We’ll keep the stop there to give the decline some room to breathe. Meanwhile, 100% projection at 1.2460 is close to 61.8% retracement of 1.1638 to 1.3854 at 1.2485. Hence, we’ll take all profit and exit if 1.2500 is met (slightly above 1.2460 and 1.2485).
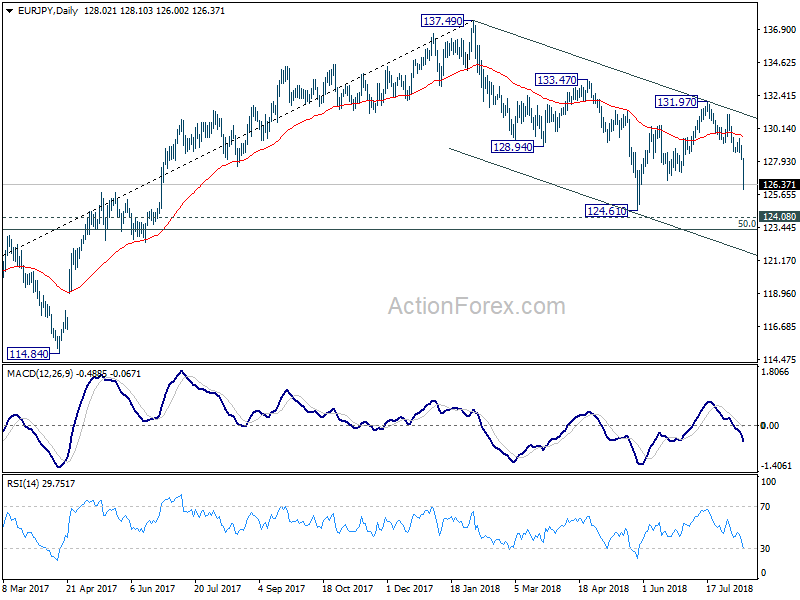
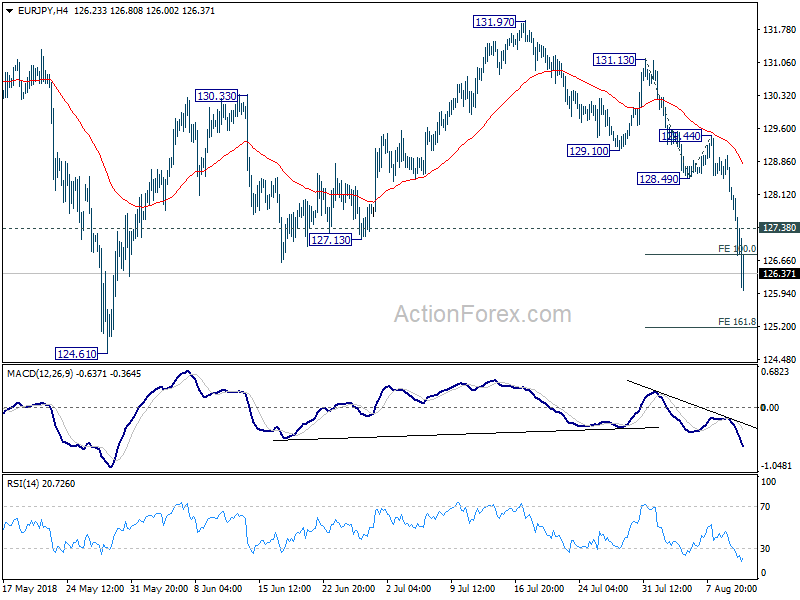
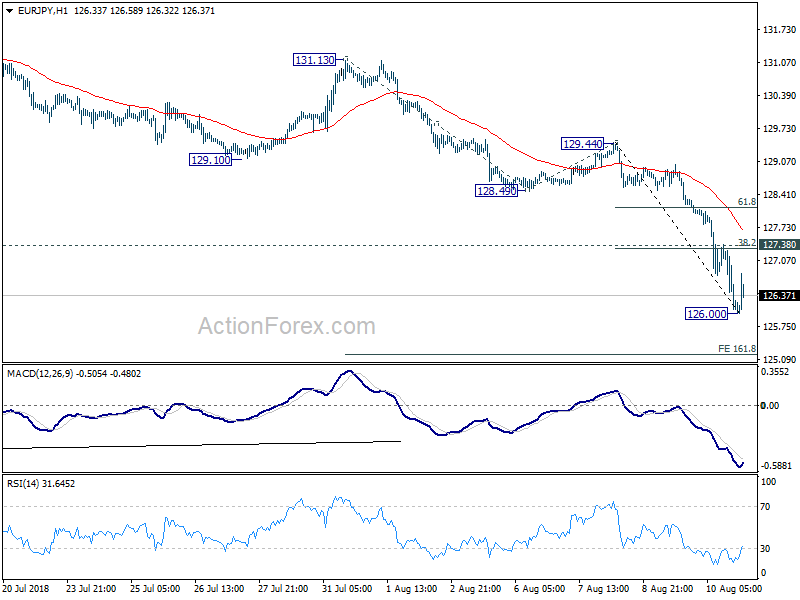
We sold EUR/JPY at open at (128.60) last week. Initial rebound made the strategy look shaky. But our stop at 129.60 wasn’t hit. And subsequent decline to as low as 126.00 is inline with our expectation. In the last update, we lowered the stop to 128.10, and this has to be lowered further for sure. In the bigger picture, we’re expecting fall from 131.97 to have a test on 124.61 low at least. Meanwhile, the fall from 129.44 has gone well past 100% projection of 131.13 to 128.49 from 129.44 at 126.88 already. It argues that EUR/JPY is heading to 161.8% projection at 125.16 in near term. Hence, we don’t want to tightening up the stop too much. Considering all, we’ll lower the stop to 127.45, slightly above 127.38 minor resistance and 38.2% retracement of 129.44 to 126.00 at 127.31. We’ll still tentatively target to take profit at 124.61. But we’ll see how it goes when EUR/JPY drops below 125.00.
As for new strategies, we’ll look for opportunity to buy Dollar given that the up trend has finally resumed. But we’ll wait for the market to exhaust the current move first, before entering in a pull back.
AUD/USD Weekly Outlook
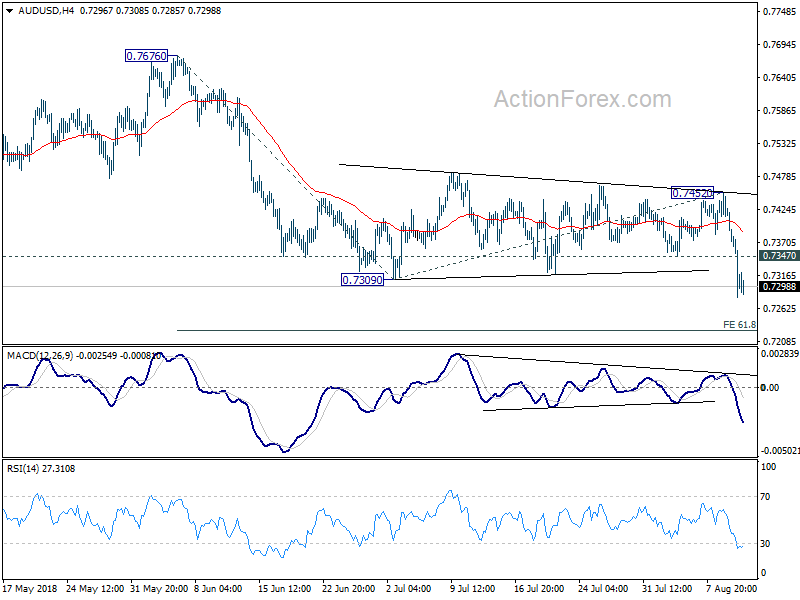
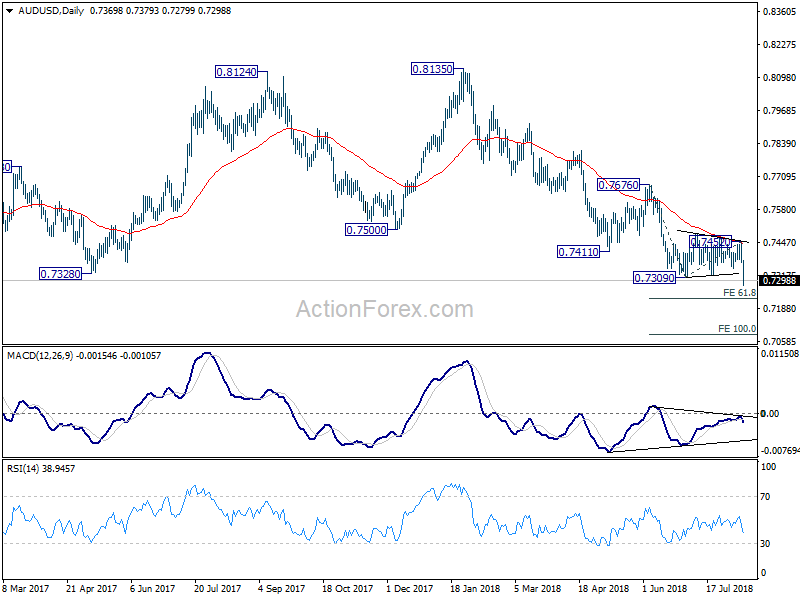
AUD/USD dropped to as low as 0.7279 last week and the break of 0.7309 low finally indicates resumption of down trend from 0.8135. Initial bias stays on the downside this week for 61.8% projection of 0.7676 to 0.7309 from 0.7452 at 0.7225 first. Break will target 100% projection at 0.7085 next. On the upside, above 0.7347 minor resistance will turn intraday bias and bring consolidation. But recovery should be limited below 0.7452 resistance to bring fall resumption.
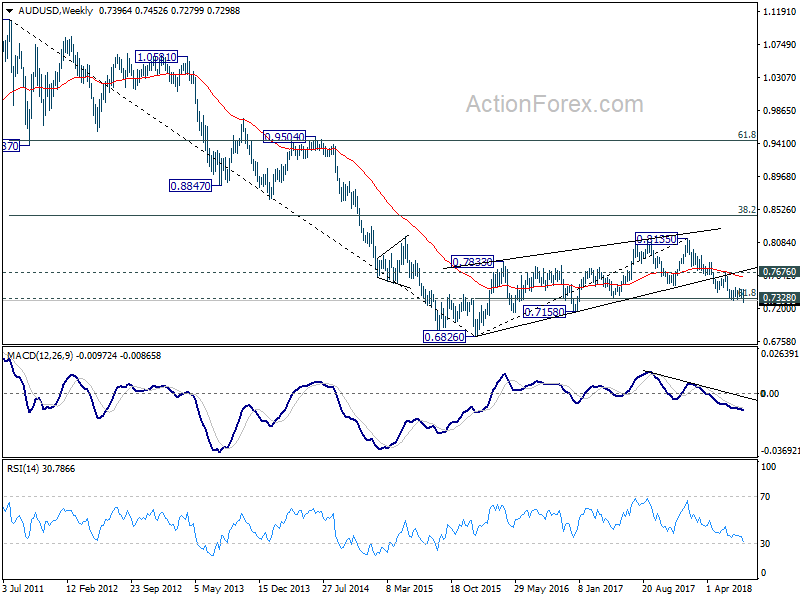
In the bigger picture, medium term rebound from 0.6826 (2016 low) is seen as a corrective move that should be completed at 0.8135. Sustained break of 0.7328 cluster support (61.8% retracement of 0.6826 to 0.8135 at 0.7326) should pave the way to retest 0.6826. There is prospect of resuming long term down trend from 1.1079 (2011 high). But we’ll look at downside momentum to assess at a later stage. On the upside, break of 0.7452 resistance might indicate medium term bottoming. But we’ll continue to favor the bearish view as long as 0.7676 resistance holds.
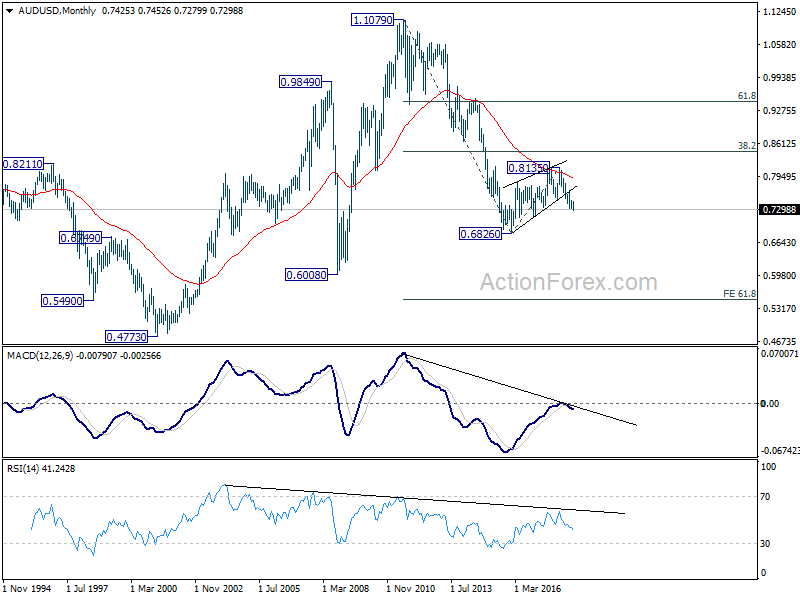
In the longer term picture, rebound from 0.682 (2016 low) should have completed at 0.8135 already. Failure to reach 38.2% retracement of 1.1079 (2011 high) to 0.6826 at 0.8451 carries bearish implications. This is also supported by the corrective structure from 0.6826 to 0.8135, as well as the rejection by 55 month EMA. The down trend from 1.1079 is in favor to extend. On break of 0.6826, next target will be 61.8% projection of 1.1079 to 0.6826 from 0.8135 at 0.5507.


