Sample Category Title
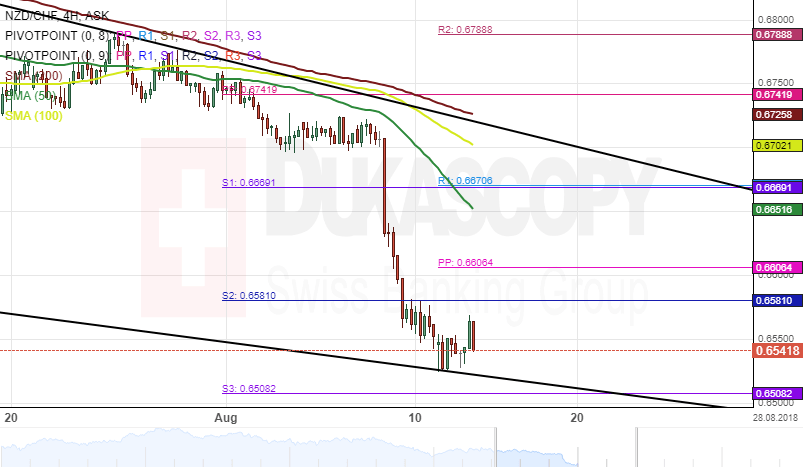
NZD/CHF 4H Chart: Downside Potential
The New Zealand Dollar has depreciated 2.92% against the Swiss Franc since August 8. At the time, the pair pullback from the monthly pivot point at 0.6741 and began a new movement down in a descending channel. During the short period of decline, the rate breached some significant support level. Namely, a support cluster formed by the combination of the weekly and the monthly PPs near the 0.6670 mark.
Given that technical indicators remain bearish on both the smaller and the larger time frames, it is likely that the Kiwi edged lower during the following trading sessions for potential near the weekly S1 at 0.6488
EURUSD Analysis: Reverses From Two-Day Fall
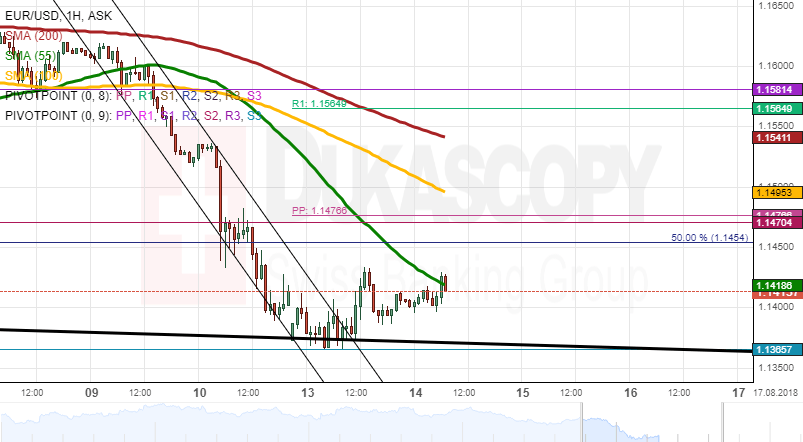
EUR/USD managed to regain some ground following a reversal form the senior channel and the monthly S3 on Monday. This advance, however, was very limited, as the rate remained under pressure by the 55-hour SMA.
This minor appreciation has now picked up the slight upward tendency of technical indicators on both the 1H and 4H time-frames. This means that this week could bring further momentum north. If looking at today, the Euro has to overcome the strong resistance of the aforementioned moving average at 1.1422 in order to move higher. The overall upside potential for today is the 100-hour SMA at 1.15.
In the meantime, a fall should exceed the 1.1350 mark only if some outside pressure is put on the pair.
GBPUSD Analysis: With No Changes
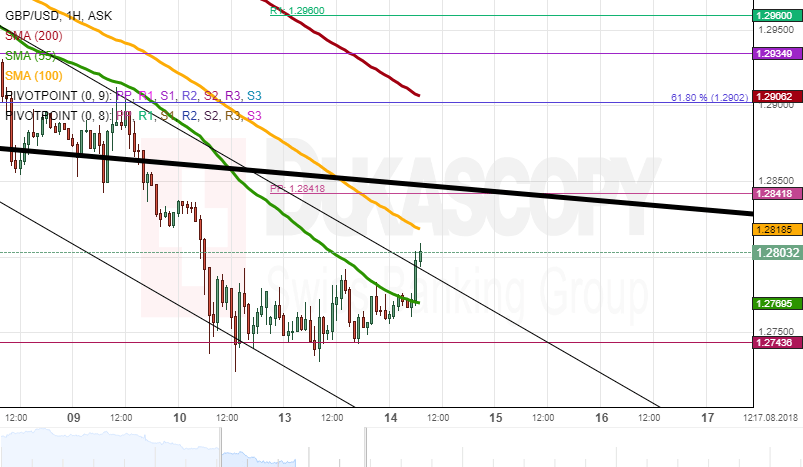
The Sterling has remained stable against the US Dollar for the second consecutive session. During this time, the pair was trading in a narrow range between the 1.28 mark and the monthly S2 at 1.2745.
Even though technical indicators are already recovering, the Sterling has failed to follow this trend, mainly due to the 55-hour SMA blocking any gains. However, it seems that the rate should be ready to surpass this resistance, breach the junior channel and target the breached senior pattern and the weekly PP at 1.2850 today.
Given that bears were unable to push the Sterling lower since mid-Friday, it is unlikely that a fall occurs. In case the bearish scenario does prevail, this decline should not be greater than the weekly S1 near 1.2650.
USDJPY Analysis: Recovers Previous Loses
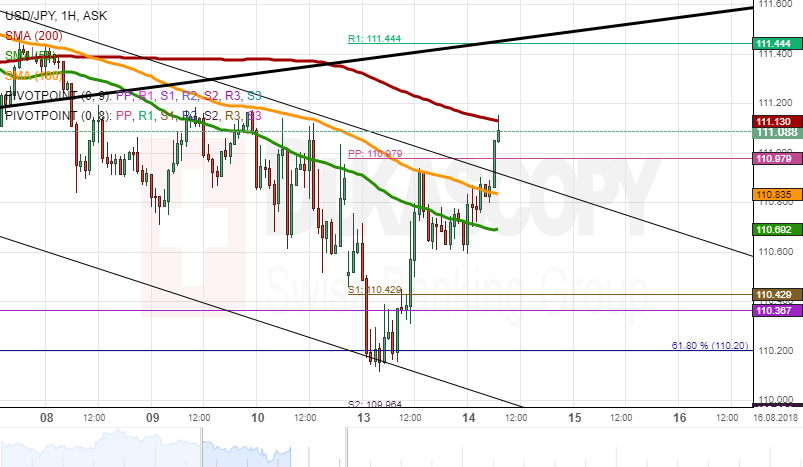
Bulls managed to prevail in the market on Monday and thus send the USD/JPY exchange rate 0.60% higher. Gains above the 110.00 level were stopped by the combined resistance of the 100-hour SMA, the weekly PP and a channel line. By Tuesday morning, the pair had returned for another test of this level.
Even though some gains are possible during the following hours, the US Dollar faces a strong cluster formed by the 55-, 100– and 200-period (4H) SMAs at 111.30. It is unlikely that this resistance is surpassed in this session, as the pair is steadily approaching the overbought territory.
In terms of support, the 55-hour SMA should remain intact. If this level is breached, the next target is the weekly and monthly S1s at 110.40.
XAUUSD Analysis: Is Calm After Plunge
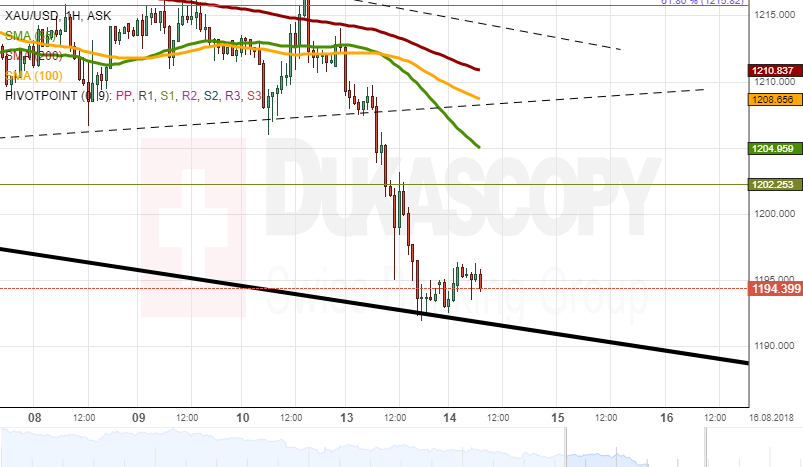
The yellow metal extended gains against the US Dollar on Monday, thus in total losing 2.00% since mid-Friday. This was caused primarily by the stronger US Dollar which gained on the growing crisis in Turkey. As a result, Gold was trading at a new 17-month low near 1,195.00 this morning, thus breaching the prevailing symmetrical triangle to the downside.
The pair is clearly oversold now. This should increase upside risks, as bulls would want to gain on this sudden daily plunge. Upside potential is apparent until a resistance cluster set by the 55-, 100– and 200-hour SMAs circa 1,210.00. In the unlikely event of a fall, Gold should target the monthly S2 at 1,180.00.
Forex Technical Analysis: EUR/USD, USD/JPY, GBP/USD
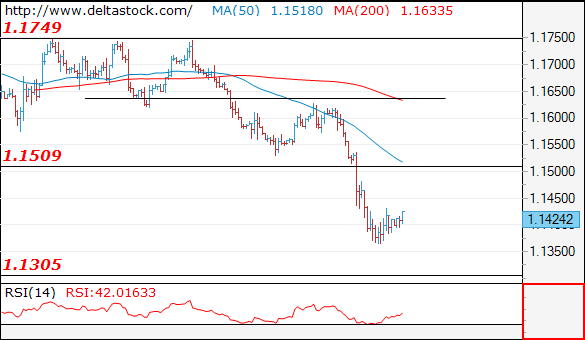
EUR/USD
Current level - 1.1424
Intraday allow a rise towards 1.1480-1510 area before drowning to 1.1300 static support.
| Resistance | Support | ||
| intraday | intraweek | intraday | intraweek |
| 1.1480 | 1.1510 | 1.1360 | 1.1300 |
| 1.1510 | 1.1750 | 1.1300 | 1.1100 |
 USD/JPY
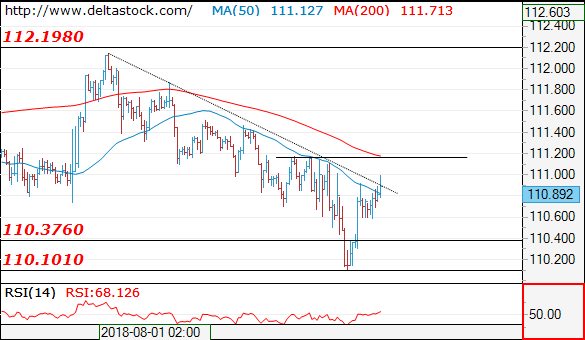
Current level - 110.89
The return above 110.40 has neutralized the bearish outlook and the bias is positive, for a test of 111.20 crucial level. I favor a break through the latter to initiate a rise towards 112.10 peak.
| Resistance | Support | ||
| intraday | intraweek | intraday | intraweek |
| 111.20 | 114.50 | 110.40 | 110.10 |
| 112.10 | 114.50 | 110.10 | 109.30 |
GBP/USD
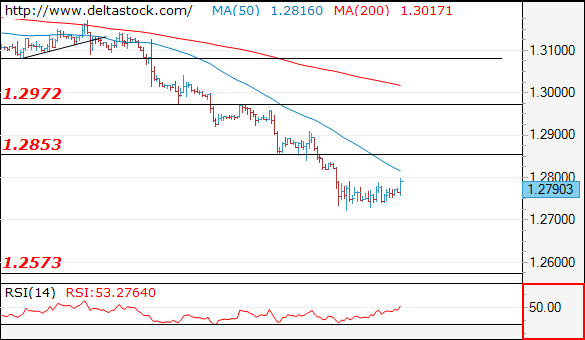
Current level - 1.2790
The rebound after 1.2730 is currently set for a test of 1.2850 and if successful, for a spike to 1.2920 area. The general outlook on the senior frames remains bearish, for a slide towards 1.2570.
| Resistance | Support | ||
| intraday | intraweek | intraday | intraweek |
| 1.2850 | 1.2970 | 1.2730 | 1.2570 |
| 1.2920 | 1.3210 | 1.2630 | 1.2570 |
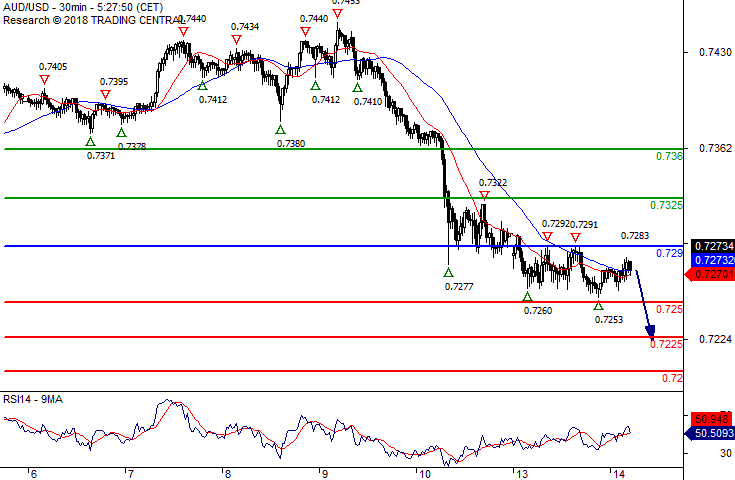
AUD/USD Key Resistance At 0.7290
Pivot (invalidation): 0.7290
Our preference Short positions below 0.7290 with targets at 0.7250 & 0.7225 in extension.
Alternative scenario Above 0.7290 look for further upside with 0.7325 & 0.7360 as targets.
Comment As Long as 0.7290 is resistance, look for choppy price action with a bearish bias.
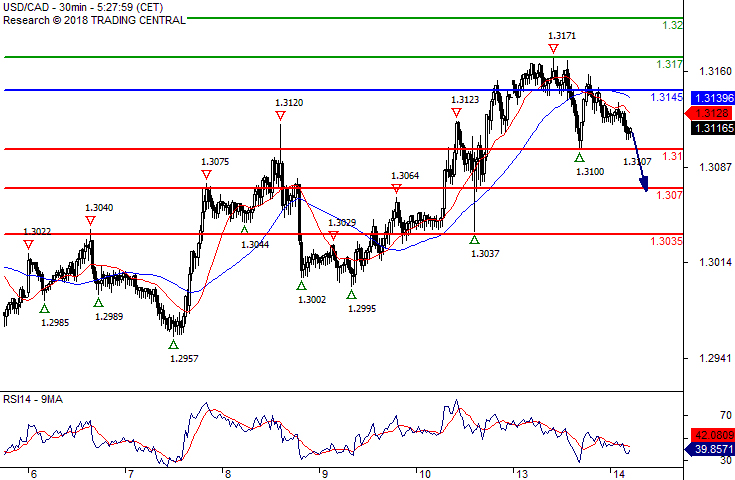
USD/CAD Towards 1.3100
Pivot (invalidation): 1.3145
Our preference Short positions below 1.3145 with targets at 1.3100 & 1.3070 in extension.
Alternative scenario Above 1.3145 look for further upside with 1.3170 & 1.3200 as targets.
Comment A break below 1.3100 would trigger a drop towards 1.3070.
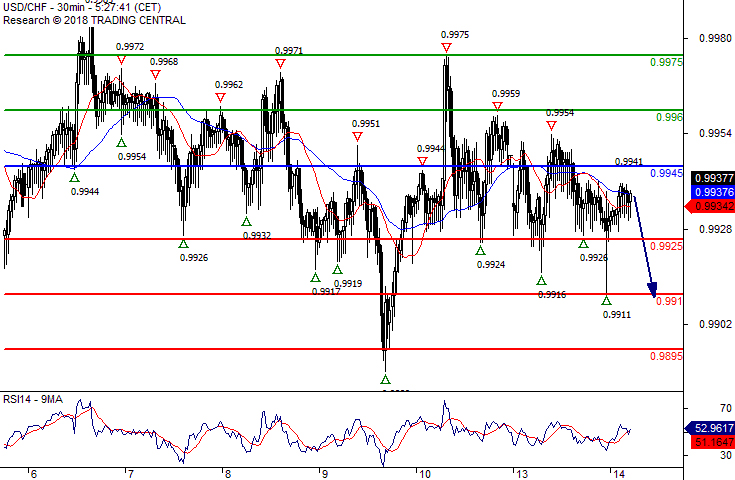
USD/CHF Key Resistance At 0.9945
Pivot (invalidation): 0.9945
Our preference Short positions below 0.9945 with targets at 0.9925 & 0.9910 in extension.
Alternative scenario Above 0.9945 look for further upside with 0.9960 & 0.9975 as targets.
Comment The upward potential is likely to be limited by the resistance at 0.9945.
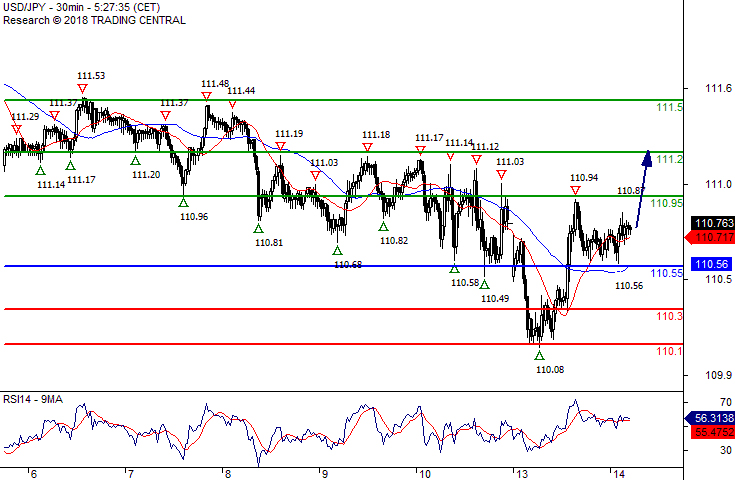
USD/JPY Target 110.95
Pivot (invalidation): 110.55
Our preference Long positions above 110.55 with targets at 110.95 & 111.20 in extension.
Alternative scenario Below 110.55 look for further downside with 110.30 & 110.10 as targets.
Comment The RSI advocates for further upside.