Sample Category Title
Mid-US Session Update: Dollar resumes rally against EUR, GBP, AUD; European Indices closed in red
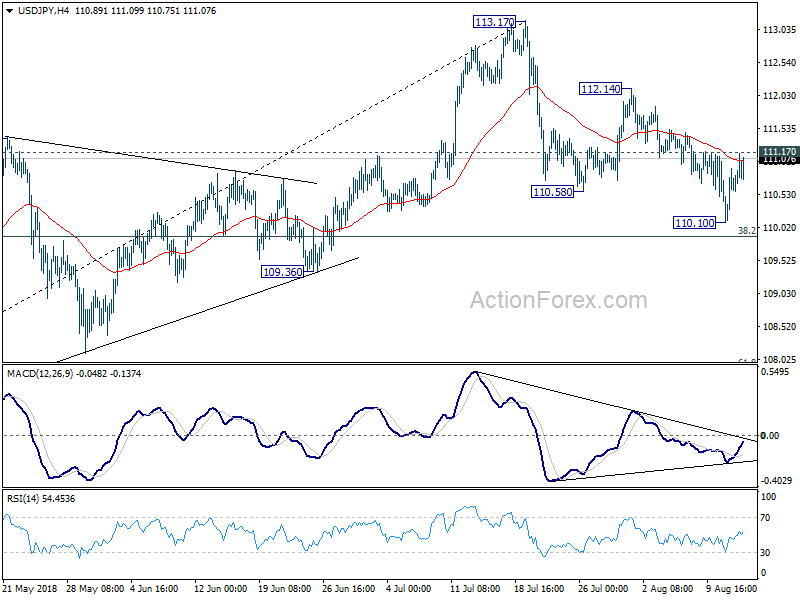
Dollar surges broadly in the first half of US session. EUR/USD, GBP/USD and AUD/USD all resumes recent fall after brief consolidations. Dollar is trading in red against Canadian and New Zealand Dollar. But we can disregard Kiwi as it's just merely digesting recent loss.
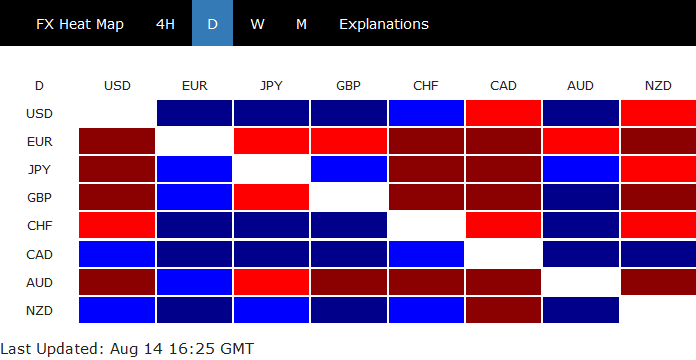
The key is whether USD/CAD has completed the rebound from 1.2961. With 1.3035 minor support intact, we're staying bullish in the pair and expect another rise through 1.3170 to 1.3289 resistance.
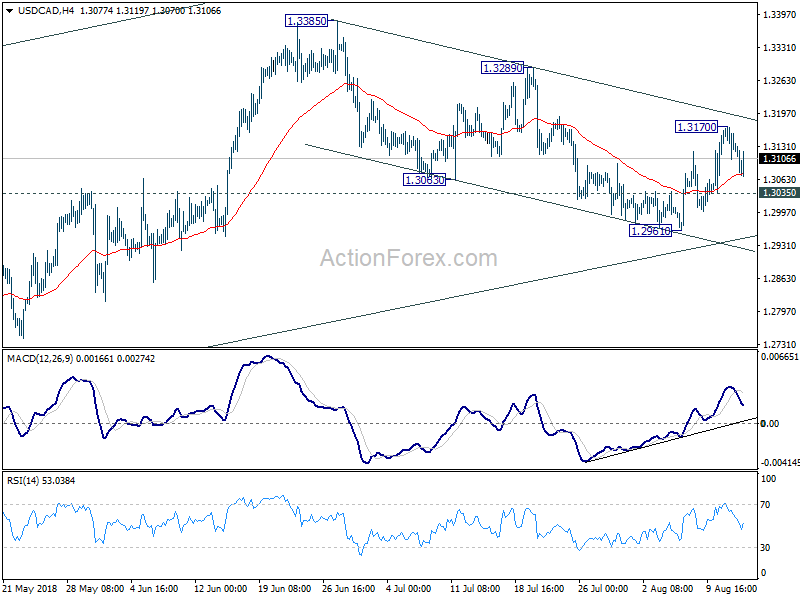
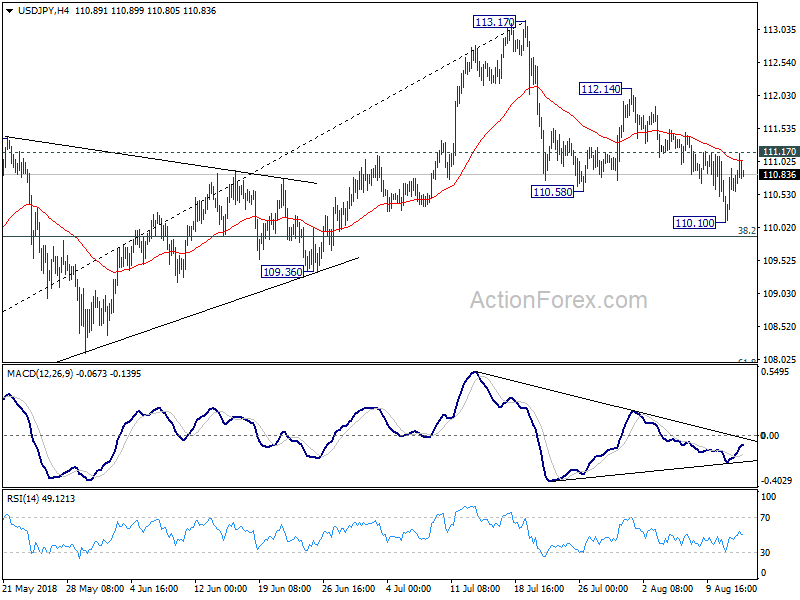
Besides, USD/JPY remains an interesting pair to watch. We're treading the fall from 113.17 as a corrective. That is, we're bullish in the pair. A break of 111.17 resistance will affirm our view and bring a test on 112.14 resistance. That would also indicate that Dollar is finally taking the control back from Yen.
In other markets:
- DAX closed flat at 12358.87, up 0.13 pts, 0.00%
- CAC closed at 5403.41, down -8.891 pts, -0.16%
- FTSE closed at 7611.634, down -30.81 pts, -0.40%.
US indices perform well. At the time of writing
- DOW is up 0.46%
- S&P 500 is up 0.68%
- NASDAQ is up 0.72%
- 10 year yield up 0.0073 at 2.889
EURJPY and GBPJPY Both Completing Their Correction; More Weakness Ahead
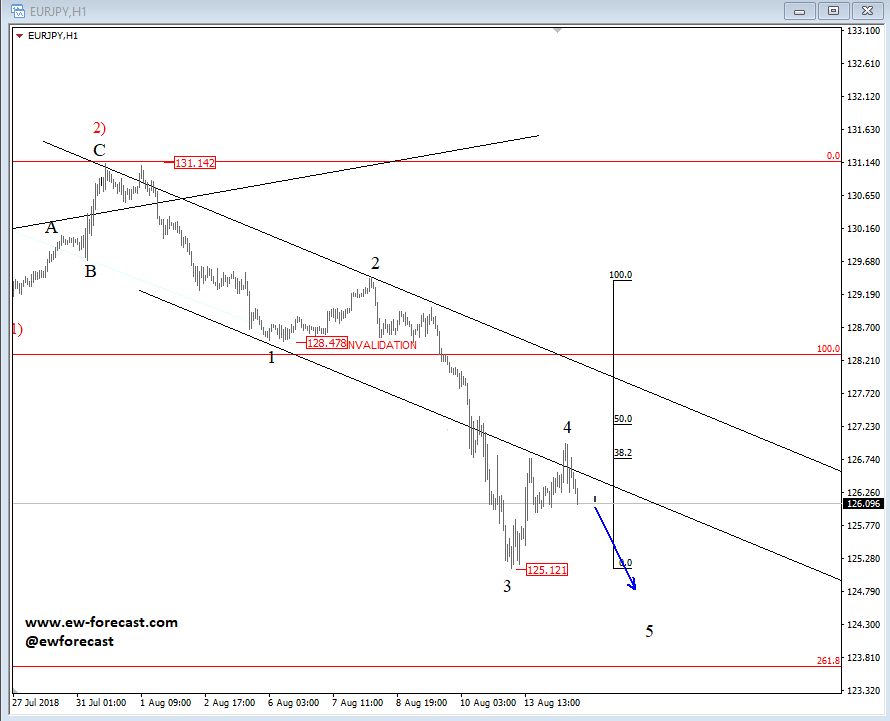
EURJPY can see more weakness while pair trades below 128.47 level, as we see current bounce as fourth wave correction that already reached resistance level around 127.00, so new leg down can be coming soon.
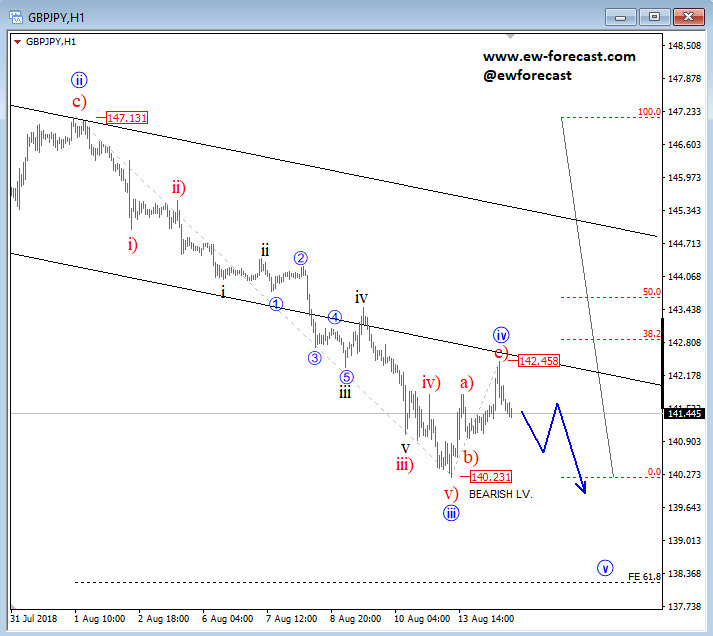
GBPJPY can be just like EURJPY slowly turning to the downside, with a possibly completed three-wave rally within recent corrective wave iv. We see new intra-day drop from the 142.46 level that can be final wave v and can in hours ahead aim below the 140.32 bearish level and towards the 138.37 region.
Sunset Market Commentary
Markets:
The Bund opened lower today as emerging markets stabilized. The Turkish lira even managed to stage a modest recovery even if the stand-off between the US and Turkey remains and as the central bank refrained from taking additional measures to stabilize markets. The initial market optimism rapidly faded and core bonds entered a narrow sideways range. US Treasuries marginally underperformed. EMU eco data printed mixed and left markets unmoved. The same narrative went for US eco data. Tomorrow’s US eco calendar is more interesting with retail sales, industrial production and the empire manufacturing survey. The US yield curve bear flattens at the time of writing with yields up to 8.2 bps (2-yr) higher. The German yield curve shifts 0.7 bps (30-yr) to 1.1 bp (10-yr) higher. Peripheral yield spreads vs Germany narrow by 4 bps (Portugal/Greece) to 8 bps (Italy). Italian PM Conte, Lega leader Salvini and 5SM leader Di Maio are rumoured to have agreed to hold on to debt-to-GDP reduction path agreed upon with Europe. Discussions on the 2019 budget are ongoing.
The Turkish lira was capable of stabilizing yesterday after the Turkish central bank took some measures to safeguard the financial sector. It prevented EUR/TRY from moving above the 8.00-level. Today this improvement in sentiment continued, with the lira even recovering back to 7.50 after news of a planned conference call in which the finance minister will seek to reassure investors whom are concerned by an increased concentration of Erdogan’s powers and him preventing the central to fight double-digit inflation by hiking interest rates. President Erdogan himself said today Turkey is victim of an economic war and as a response imposed sanctions on US electronic products. EUR/USD stabilized yesterday after the pair dropped to 1.14 in recent days. The NFIB Small Business Optimism printed at 107.9, a record high since September 1983, but couldn’t support the dollar further. EUR/USD is currently oscillating around the 1.14-level. The recent break with the 1.15 support level is from a technical point of view paving the way for a further dollar strengthening to 1.12. The pound gained marginally against the euro after UK labour market data slightly beat market expectations. The unemployment rate dropped to a historic 4.0% and Jobless Claims declined from 9.0k to 6.3k. EUR/GBP is currently trading around 0.892. Investors are looking ahead to the restart of negotiations on brexit this Thursday (Irish border), which probably will have a larger impact on sterling.
News Headlines:
The latest UK labour market report proved to be positive but close to market expectations, with the unemployment rate further declining in June to a historic 4.0% (from 4.2% in May; lowest level since February 1975). Jobless claims in July dropped from 9.0k to 6.2k. Weekly earnings slightly declined to 2.7% Y/Y, coming from an upwardly revised 2.8% Y/Y in May.
Eurozone GDP growth was slightly better in the second quarter than initially thought, with an unexpected upward revision to 0.4% (QoQ, from 0.3%). German ZEW investor confidence bounced back in August to -13.7 for the forward looking expectations component (vs -21.3 forecast) coming from -24.7 in July, but international trade tensions remained a key drag.
The US NFIB Small Business Optimism increased to 107.9 (106.8 expected) from 107.2 in June, and records a high since September ’83. US import prices in July were unchanged from July. US export prices dropped 0.5% in July, mostly due to prices for US farm exports declining by 5.3% (the most since 2011) as the trade war heats up.
How to Trade the Wedge Pattern Objectively?
Trading with chart patterns can be one of the simplest ways to find highly profitable trade setups. Despite the ease of trading with chart patterns, there is quite some subjectivity involved which can be a put off for newcomers.
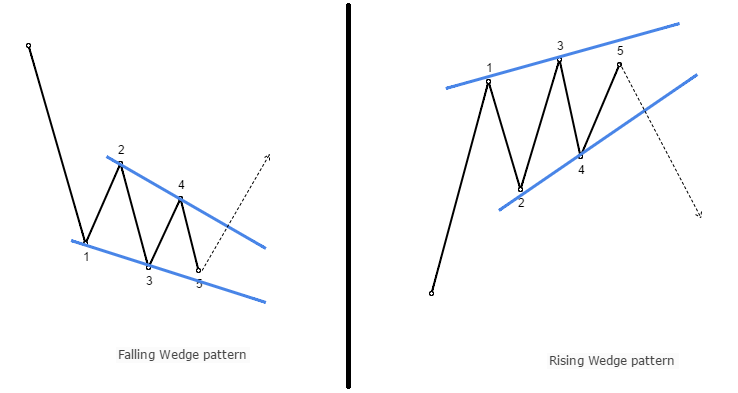
While there are many different chart patterns, one of the most commonly occurring pattern is the wedge pattern. Classified into a rising wedge or a falling wedge, these patterns are formed after a strong rally or a decline in price. They usually occur at the end of the strong move and signals exhaustion in the price momentum. Trading the wedge pattern is a typically counter trend as a breakout from the pattern could either signal a correction or a potential change in trend itself.
The picture below illustrates a rising and a falling wedge pattern at its simplest form.
Characteristics of a Wedge pattern
- There must be a clear trend, prior to the wedge pattern. This is signified by price making higher highs and lows in an uptrend and comes ahead of a rising wedge pattern or lower lows and lower highs in a downtrend which comes ahead of a falling wedge pattern
- Towards the top end of the rally or towards the end of the declines, look for potential consolidation with the peak and valley start to move into a smaller range
- Using a trend line, connect the highs and lows and look for a triangle type of consolidation
- Wait for price to break the wedge or triangle pattern
Note: When trading with stocks, the breakout from the wedge pattern is usually confirmed by higher volume. The following two charts illustrate this point.
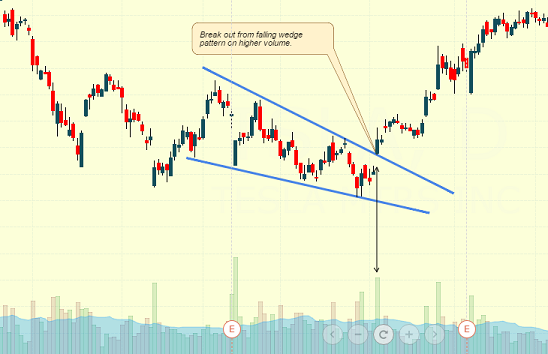
In the first chart below, notice the falling wedge pattern which came after a prolonged downtrend. Then, prices started to consolidate into a wedge pattern with the breakout from the falling wedge coinciding with higher volume.
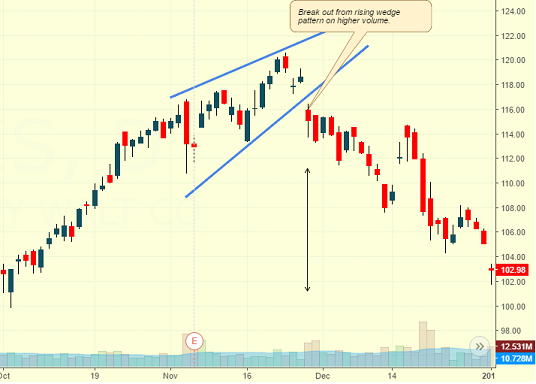
In the next chart, a rising wedge pattern is formed after a steady uptrend. After a series of higher highs and higher lows, price starts to consolidate into a wedge pattern. The breakout is confirmed by the higher volume resulting in prices moving lower.
In the forex markets, the volume cannot be used as an accurate measure due to the de-centralized nature of the forex markets. Therefore, to supplement the volume, we make use of divergence. For divergence, we look for either a bullish or a bearish divergence inside the wedge pattern. To spot the divergence, any oscillator can be used. Typically the RSI, MACD, Stochastics or Awesome oscillator can be used to make it easy.
How to set targets in a wedge pattern?
The wedge pattern can be generally customized in terms of trading the pattern breakout with traders devising their own rules. There are two most widely accepted rules in setting targets in the wedge pattern.
- Target point A or 0, the first peak of valley in the pattern, following the breakout
- Project the highest and lowest point in the wedge from the breakout
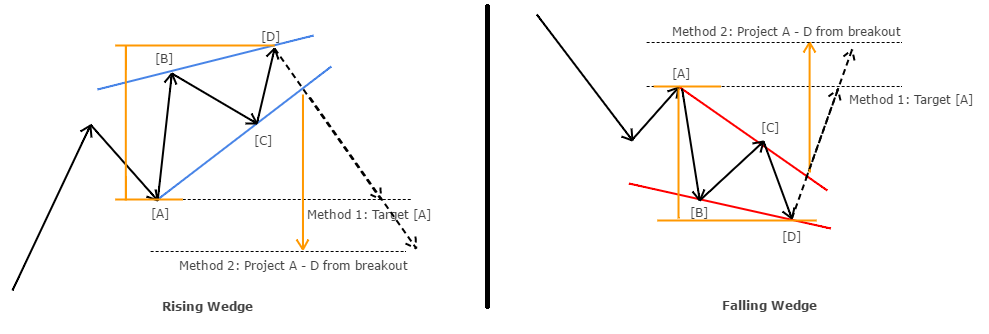
As with most chart patterns and breakout methods, prices can retrace the breakout level before resuming its direction. The wedge pattern is no different either. For stops, the point D, which is the highest point in a rising wedge and the lowest point in the falling wedge is used at a level for set the stop losses.
Trading the rising wedge pattern
The following chart for EURUSD showed a rising wedge pattern that was formed with prices moving steadily higher.
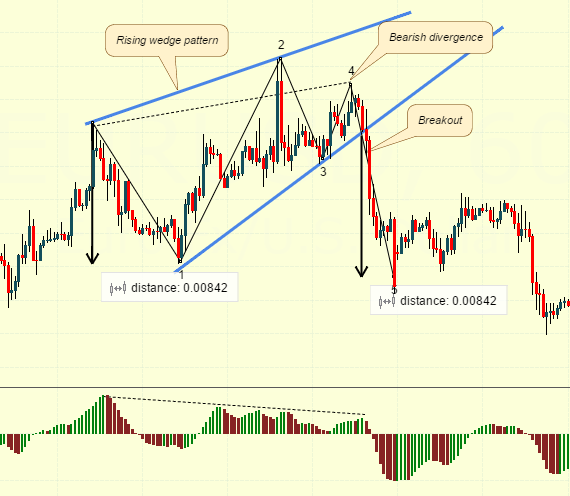
Notice the bearish divergence (marked by the dashed line) that is identified following the rising wedge pattern. This is used as a confirmation that prices will push lower. Following the break of the trend line from the rising wedge pattern, using the distance measured from point 0 – 1 the same distance is projected from the breakout level.
Trading the falling wedge pattern
The next chart below shows a falling wedge pattern, identified on the 30-minute chart time frame.
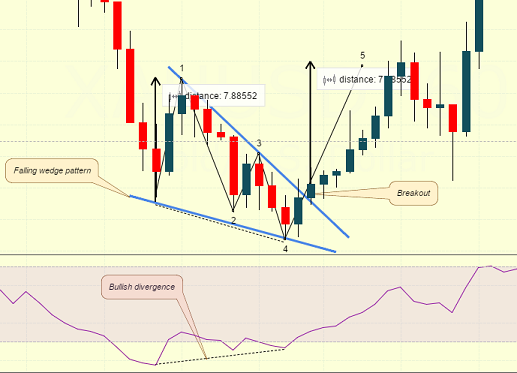
Here, instead of the Awesome Oscillator we make use of the RSI. Following the consolidation pattern and noticing the bullish divergence, a long set-up is taken on the breakout from the falling wedge pattern with the target set to the same distance as from point 0 – 1.
In summary:
- The rising or falling wedge pattern is typically triggered following a strong uptrend or a downtrend;
- The wedge pattern signals exhaustion of momentum that triggered the previous trend. Therefore a successful breakout from a wedge pattern can see price retrace the previous trend, in some cases, it can also signify a change of trend as well;
- Volume is generally used a confirmation of the breakout in stocks. For the forex markets, divergence can be used as a confirmation of the breakout;
- Based on the target methods, the wedge pattern offers a fairly good 1:2 or higher risk reward ratio;
- Using candlestick confirmations on the time frame that the wedge pattern occurred or on higher time frame can bring additional confidence to the trade set up.
Institutional FX Positioning: Don’t Fight The Flow
Informational Imbalances
The development of trends in FX markets relies on the aggregation of institutional order flow to drive a currency or currency pair in a particular direction. Many new traders often find themselves on the wrong side of these moves and typically spend a lot of time in a trap known as “fighting the flow.”
The Forex market has a highly decentralised structure meaning that unlike stock exchanges, there is no physical location for the recording of order flow. Consequently, information on these flows is restricted to bank and larger institutional players. To put this in a simpler context: Bank and institutions are able to track portions of order flow in the market but the individual retail trader cannot.
To understand the importance of this imbalance we can refer to a report produced by the Bank of International Settlements which sought to establish the value of studying client flows in FX. The report, which was published in 2013 but revised in 2016, looked at a number of different aspects including what it is that characterises different FX customer groups (e.g., are they contrarian investors, do they take on risk or hedge against it, do they speculate on trends?) and whether large dealers possess an advantage from their ability to view a large percentage of customer trades?
In terms of establishing the predictive value of the various segments of client flow, the report concluded that:
- Asset Manager flows are aligned with sustained shifts in future FX prices indicating a superior processing of fundamental information in their order flow
- Hedge Funds are associated with temporary currency movement suggesting shorter term positioning and the liquidity effects of large trades.
- Corporate flows appear to be largely uninformed regarding currency direction
- Private client flows reflect contrarian positioning
To quantify the value of these different client flow, the study used a simple portfolio approach which found that currencies with highest net buying pressure outperformed currencies with the highest net selling pressure by 10% pa.
A zero-cost long-short portfolio showed:
- Asset Managers yielding average excess returns of 10%
- Hedge funds yielding average excess returns of 10% pa
- Corporate clients yielding average excess returns of 0%
- Private clients yielding average excess returns of -14%
The conclusion here is that the flow of Institutional players e.g., Banks and Hedge Funds represents a significantly superior alignment with future pricing than that of Corporate and private flows.
So how can the retail trader take advantage of this information?
COT Data
Fortunately, The CFTC compiles weekly Commitment of Traders data reports on the positioning of participants in the currency futures markets, data which translates directly into the spot FX markets.
The data tracks the positioning of Non Commercial players (banks and institutions) as well as Commercial players (Corporates) and Private clients. The weekly report released each Thursday/Friday references the positioning of these players over the weekly period from the Tuesday of the previous week to Tuesday of that week.
The report is long and complicated for new traders, though fortunately many websites now present the data taken from those reports in neat visual graphics updated each week.
Understanding This Data
Essentially, given what we know about the power of institutional order flow as discussed in the BIS report it makes sense that we would look to trade in the same direction as these major institutions and essentially piggyback their order flow.
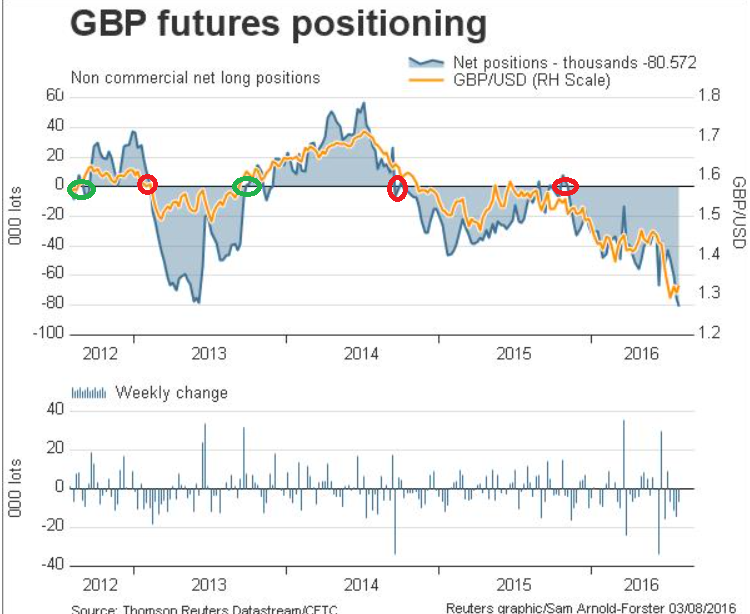
The chart above shows the Non-Commercial positioning in GBPUSD going back to 2012 with the Yellow line representing price and the shaded blue region tracking positioning. When the blue shaded region (positioning) crosses above the center line, it represents a net-long position, and when it crosses below the center line it represents a net-short position. The red circles highlight periods when positioning flipped from long to short and the green circles highlight period where the positioning flipped from short to long.
Of the eight times positioning crossed over 6 resulted in the development of a significant trend. This is incredibly valuable information to have, and the opportunities it can afford should be clear. Looking to trade in the same direction as Non-Commercial players can help individual traders catch major trends
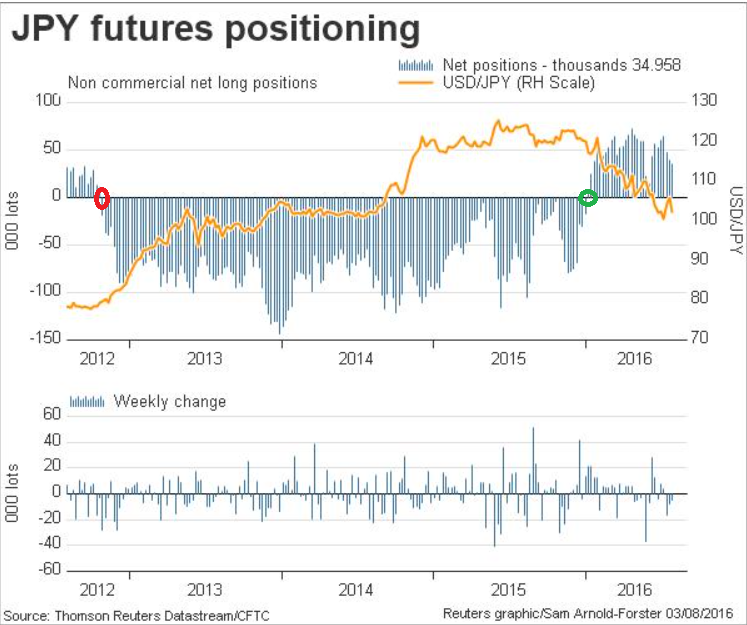
Another chart that clearly demonstrates the power of this data is the USDJPY chart showing the JPY positioning. This time, the data is inverted so the positioning tracks JPY but price shows USD movement. So if JPY positioning is going down, as shown by the first red circle, then USD should be going up and vice versa
How To Use COT Data
COT data clear has great benefit as a sentiment tool for trades helping them to identify the directional bias of major banks and institutions. Checking the data each week to see how the institutions were positioned the prior week can be a good guide as to which direction you should be looking to trade, however, the data can be quite choppy week on week and in terms of identifying a strong signal it is best to use COT in three instances
- Identifying a change in positioning
As shown by the circles, when major institutions shift their bias (e.g., long to short, short to long) these tend to be key times for the market and can often be followed by the development of a significant trend.
- Identifying periods of extreme positioning
The power of following a trend as denoted by positioning can be a fantastic asset to traders but of course, no trends last forever and so it is wise to be alert, though not neurotic, to potential reversal signals. One of the most reliable signals is when positioning moves into extreme levels which usually signals capitulation and exhaustion in the trend and highlights the likelihood of reversal.
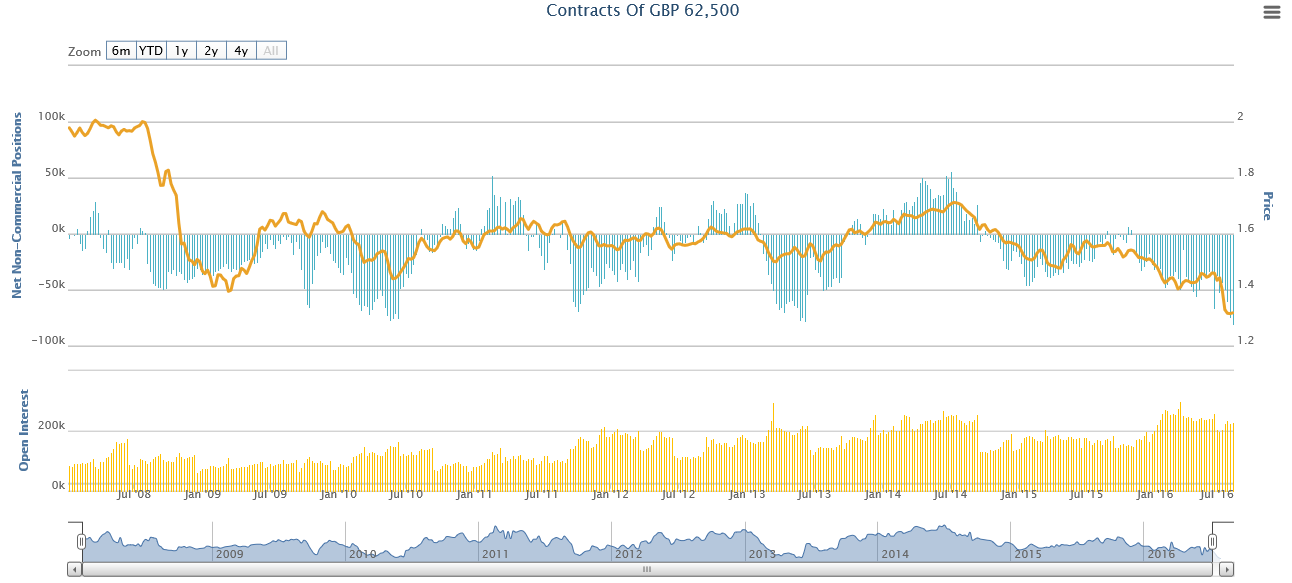
This chart shows the COT positioning in GBPUSD back to 2008, again the shaded blue bars on the price chart are positioning and the yellow line is price. Look how price reacted each time positioning moved to -50, price tended to rally shortly after, and look what happened each time positioning moved to +50, price tended to sell off shortly after.
- Divergent positioning
Similar to what we discussed in point three, identifying divergent positioning can be another tell-tale sign of a potential reversal in the offing as institutions are displaying less interest in pursuing the move.
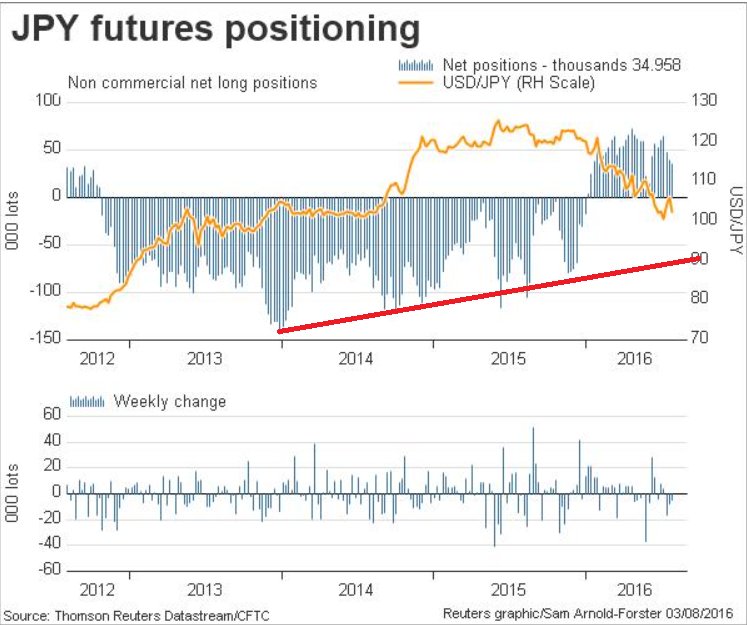
In this example, we can see that USDJPY is moving higher and higher but the actual build in JPY shorts is getting less and less indicating dwindling momentum before finally positioning shifts.
Issues To Be Aware Of
Whilst the data can indeed be a fantastic tool for helping traders establish directional bias in the market as well as identify period of potential reversal there are a few issues that we need to consider.
- Backdated data
First of all the data is backdated meaning it tells us how institutions were positioned the prior week and not right now nor how they will be positioned in future. However, if we are looking to trade with the trend and assume that institutions are following a directional path then it still provides a great guideline. However, as mentioned earlier, rather than using the data week on week look out for key developments such as a shift in positioning and extreme or divergent positioning.
- Doesn’t track entire market
Secondly, the data does not reflect the positioning of the entire Forex market. Whilst the data does a fantastic job of identifying trend and turning points there will be times when price doesn’t follow the data and we need to remember that the CFTC are only able to track a specific portion of the flow
- Isn’t a magic system
And finally , it is important to remember that there is no magic wand in trading and no matter how fantastic a system or indicator or strategy appears, it all depends on how useful you find it. That said, the COT data is a classic tool and is used by many hedge funds and systems traders as an information input for their strategies as well as being used by successful retail traders around the globe. If you can establish a way of using the data as a sentiment tool alongside managing your risk properly and developing a sound trading plan then the COT data can be an invaluable tool for helping you stay on the right side of the institutions and avoid “fighting the flow”
Each week we publish a COT update which reports the change in positioning for the prior week as well as noting key fundamental developments in the market helping you to learn more and stay up to date on the latest positioning
USD/JPY Mid-Day Outlook
Daily Pivots: (S1) 110.24; (P) 110.59; (R1) 111.07; More...
Intraday bias in USD/JPY remains neutral and outlook is unchanged. Correction from 113.17 could still extend lower. But we'd expect strong support from 38.2% retracement of 104.62 to 113.17 at 109.90 to contain downside and bring rebound. On the upside, above 111.17 minor resistance will turn bias back to the upside. Further break of 112.14 will bring retest of 113.17 high. However, firm break of 109.90 will put focus on 109.36 key structural support level.
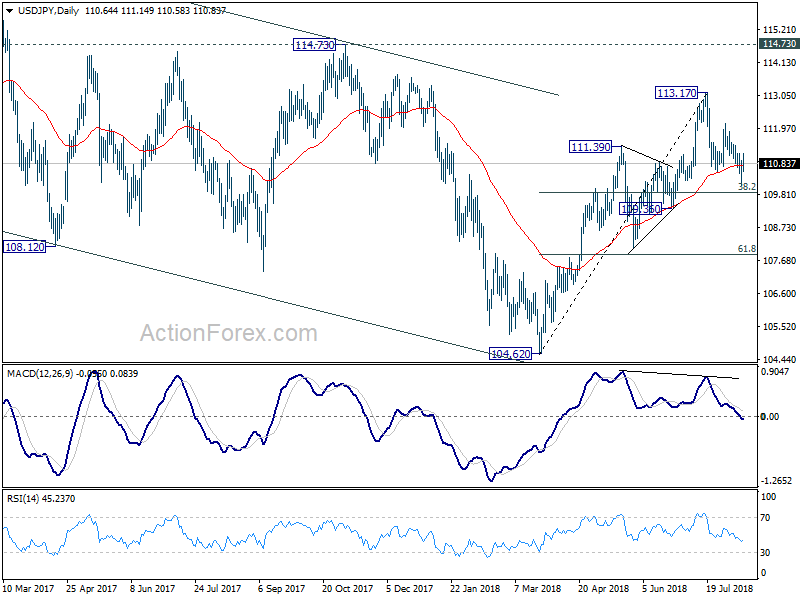
In the bigger picture, corrective fall from 118.65 (2016 high) should have completed with three waves down to 104.62. Decisive break of 114.73 resistance will likely resume whole rally from 98.97 (2016 low) to 100% projection of 98.97 to 118.65 from 104.62 at 124.30, which is reasonably close to 125.85 (2015 high). This will stay as the preferred case as long as 109.36 support holds.
USD/CHF Mid-Day Outlook
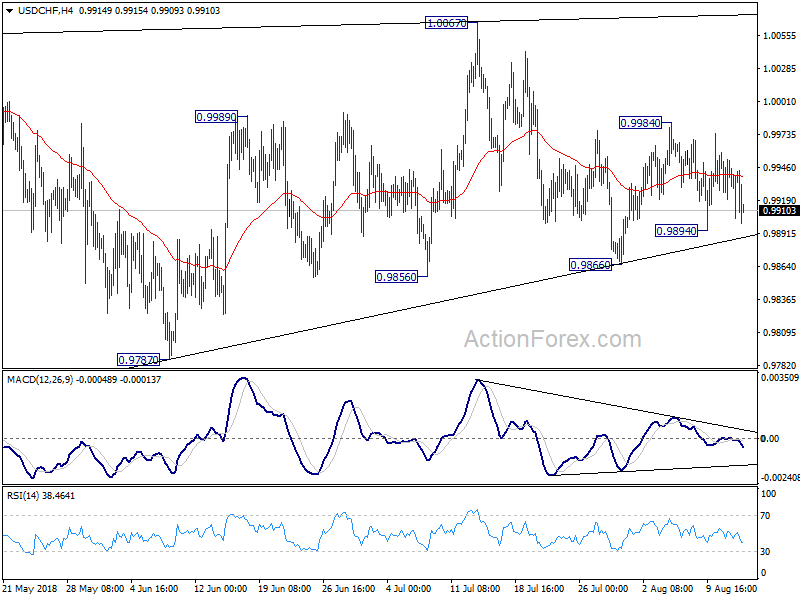
Daily Pivots: (S1) 0.9916; (P) 0.9935; (R1) 0.9951; More....
Intraday bias in USD/CHF remains neutral for range trading inside 0.9894/9984. On the upside, above 0.9984 will resume the rebound from 0.9866 to retest 1.0067 high. Decisive break there will resume whole rally from 0.9186. On the downside, below 0.9894 might extend the consolidation pattern from 1.0056 with another falling leg. But downside should be contained by 38.2% retracement of 0.9186 to 1.0056 at 0.9724 to bring rebound.
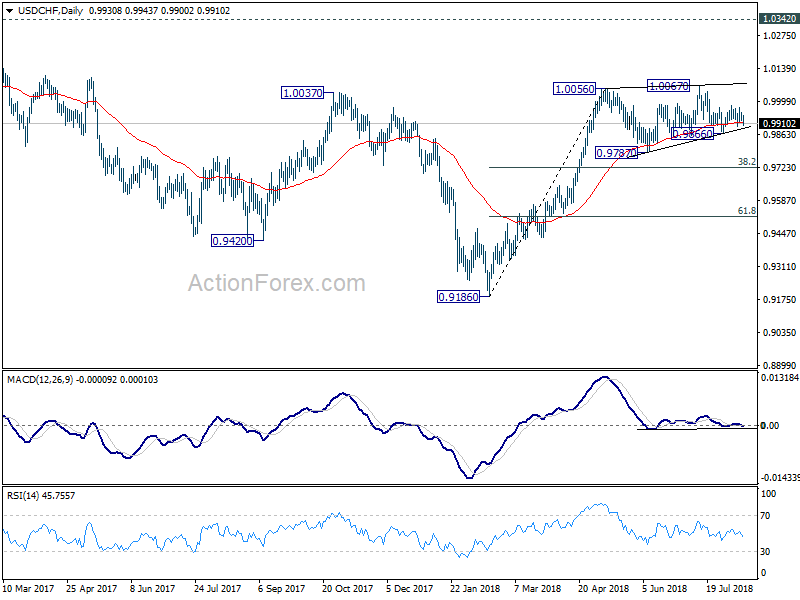
In the bigger picture, current development suggests that the consolidation pattern from 1.0056 is extending with another leg. As long as 38.2% retracement of 0.9186 to 1.0056 at 0.9724 holds, we'd expect rise from 0.9186 to resume at a later stage to retest 1.0342 key resistance (2016 high). However, sustained break of 0.9724 fibonacci level will bring deeper fall, as another declining leg in the long term range pattern.
EUR/USD Mid-Day Outlook
Daily Pivots: (S1) 1.1371; (P) 1.1403 (R1) 1.1440; More.....
Intraday bias in EUR/USD remains neutral for consolidation above 1.1364 temporary low. Stronger recovery cannot be ruled out. But upside should be limited by 1.1529 support turned resistance to bring another fall. On the downside, below 1.1364 will resume larger decline to 61.8% projection of 1.2413 to 1.1509 from 1.1745 at 1.1186. Note that it's a cluster level with 61.8% retracement of 1.0339 to 1.2555 at 1.1186. Hence, we'll tentatively look for short term bottoming around 1.1186.
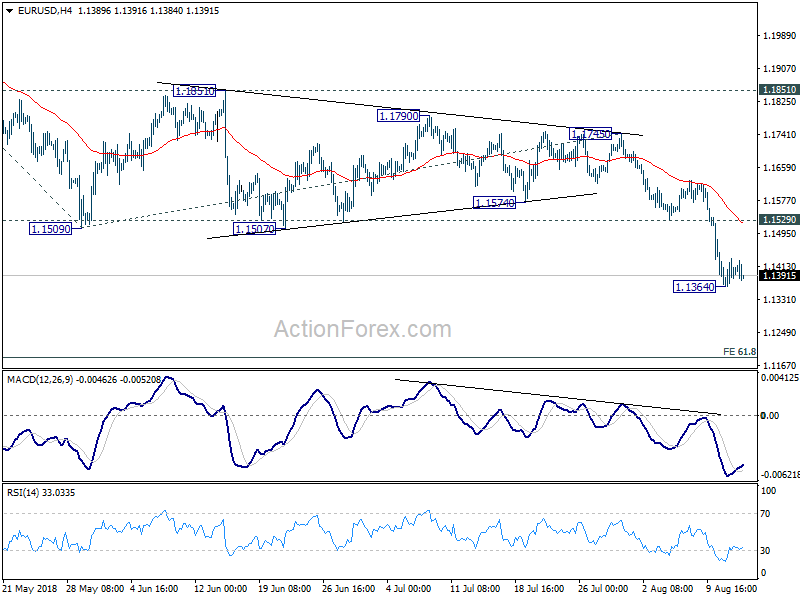
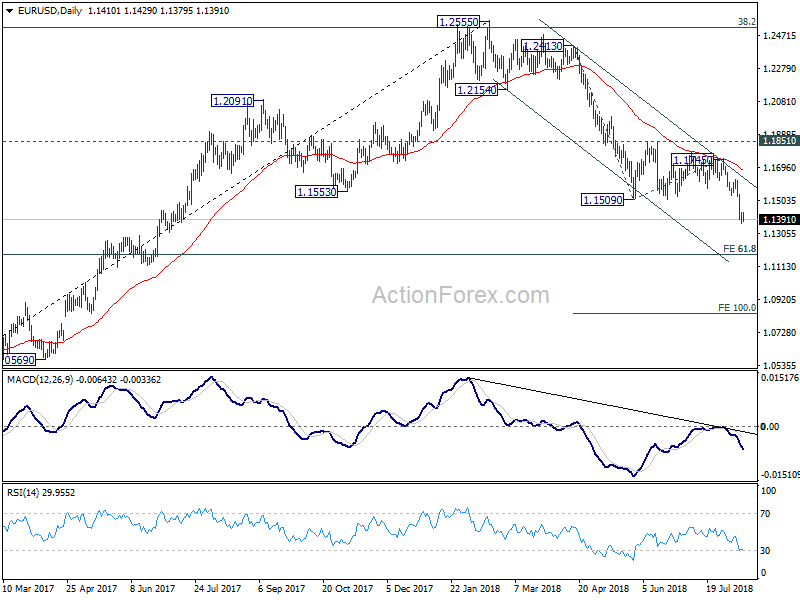
In the bigger picture, the down trend from 1.2555 medium term is in progress for 61.8% retracement of 1.0339 to 1.2555 at 1.1186. Note again that EUR/USD was rejected by 38.2% retracement of 1.6039 (2008 high) to 1.0339 (2017 low) at 1.2516. That carries some long term bearish implications. Sustained break of 1.1186 could pave the way back to retest 1.0339 low. For now, outlook will remain bearish as long as 1.1851 resistance holds, even in case of strong rebound.
EURCHF Tumbles Near 1-Year Low Approaching Rising Trend Line
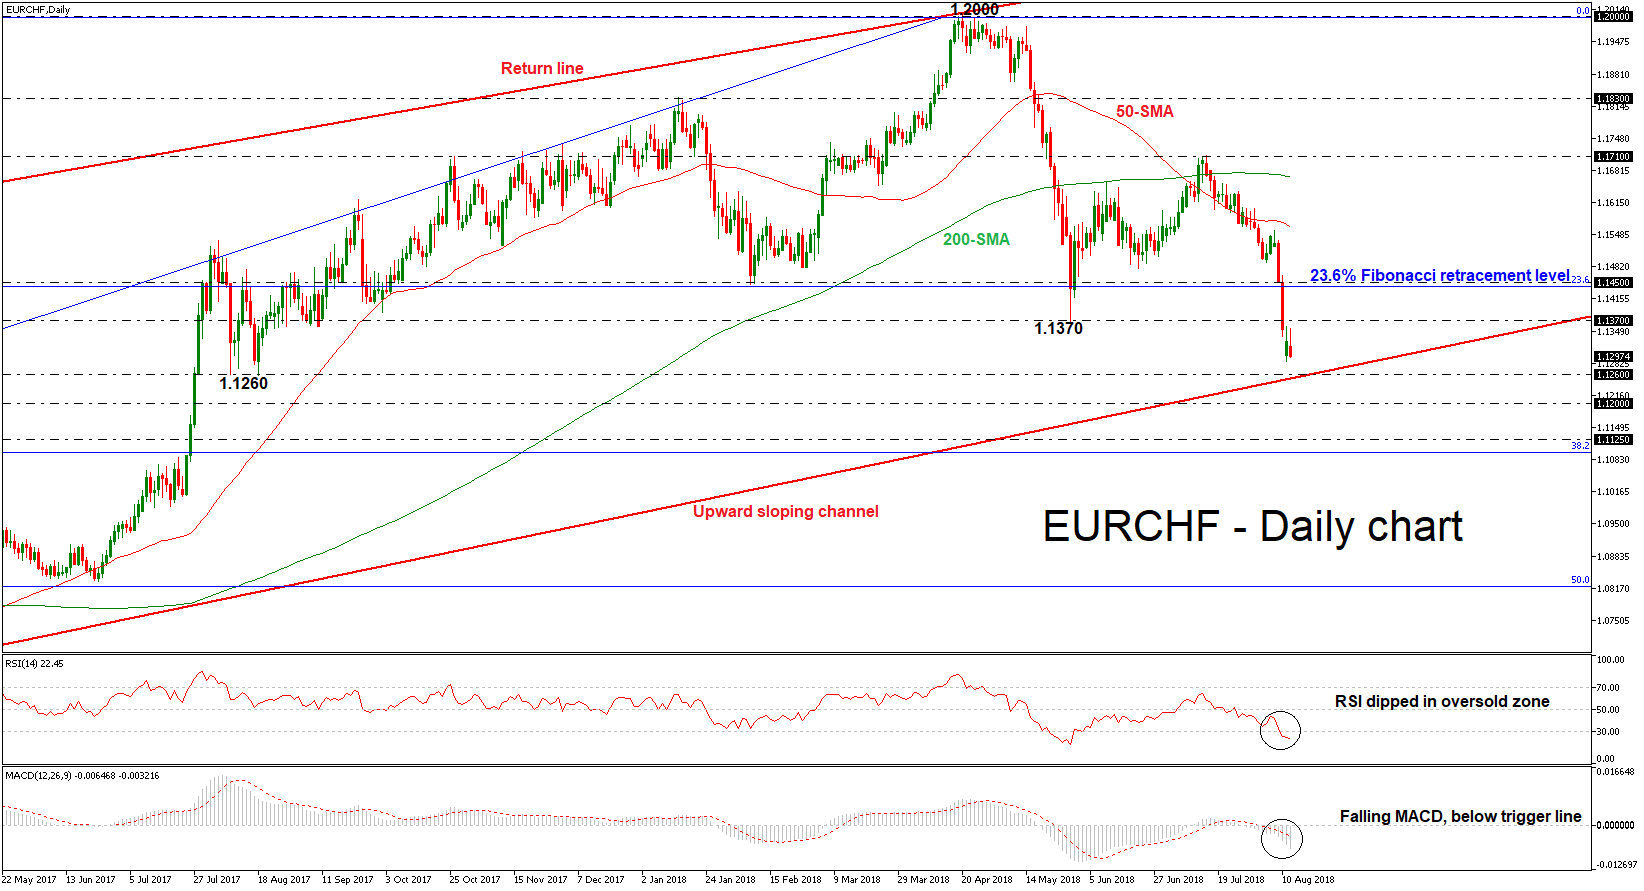
EURCHF is on course for the fifth week of losses, which have taken the pair from above the 1.1700 level to a one-year low of 1.1285. The sharp sell-off drives the price towards the lower boundary of the upward sloping channel, which has been standing since January 2015. The momentum indicators are supportive of the bearish picture, with the RSI falling into oversold territory below 30 and the MACD slipping aggressively below its red signal line.
Immediate support could be provided by the 1.1260 barrier, which holds near the ascending trend line. However, should prices dip lower, the next support could likely come from the 1.1200 handle, taken from the high on January 2016. In case of such a drop, the channel will be penetrated, and the long-term bullish outlook would shift to bearish. Further losses below the ascending trendline could then drive the price until 1.1125, identified by the highs on May.
In case of an upward attempt, the pair could meet resistance at the 1.1370 level, while a jump above this area could potentially ease downside risks and push the price until 23.6% Fibonacci retracement level of the upleg from 0.9650 to 1.2000, around the 1.1450 resistance barrier.
In the long-term, the bullish phase remains in play for now until the price breaks the rising trend line to the downside.
GBP/USD Mid-Day Outlook
Daily Pivots: (S1) 1.2734; (P) 1.2762; (R1) 1.2795; More...
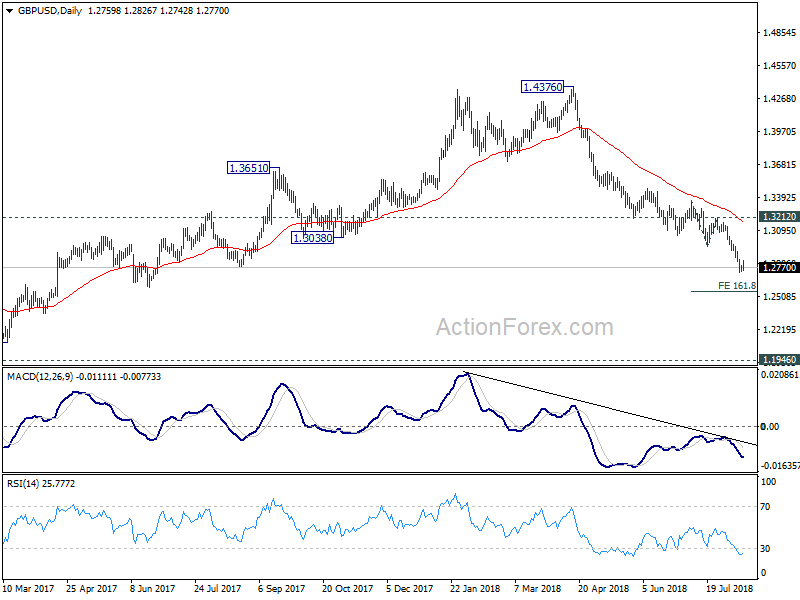
Intraday bias in GBP/USD remains neutral for consolidation above 1.2722 temporary low. Stronger recovery could be seen. But upside should be limited below 1.2956 support turned resistance to bring fall resumption. On the downside, below 1.2722 will extend recent decline to 161.8% projection of 1.3362 to 1.2956 from 1.3212 at 1.2555 next.
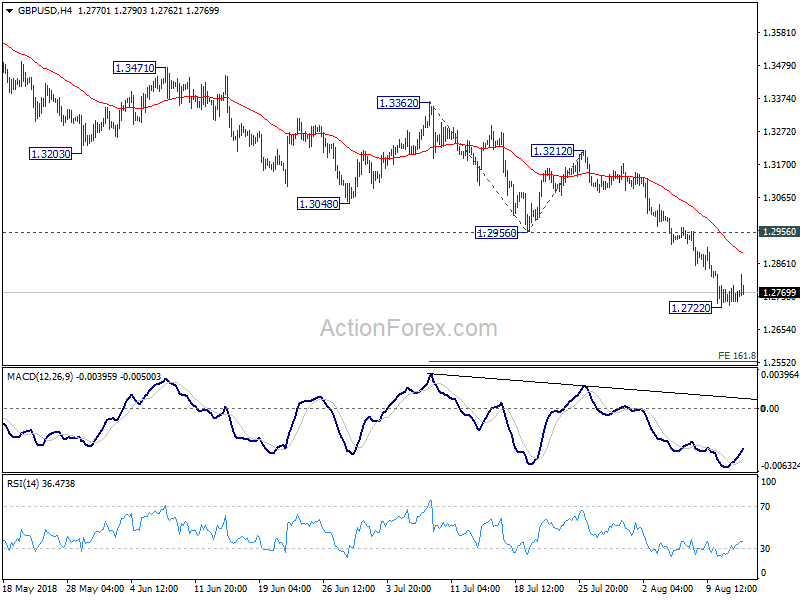
In the bigger picture, whole medium term rebound from 1.1946 (2016 low) should have completed at 1.4376 already, after rejection from 55 month EMA (now at 1.4141). Current downside acceleration argues that it's possibly resuming long term down trend. In any case, outlook will stay bearish as long as 1.3212 resistance holds. Retest of 1.1946 should be seen next.