

Sample Category Title
Crude Oil: Oil Trading Reverses Its Losses In The Asian Session
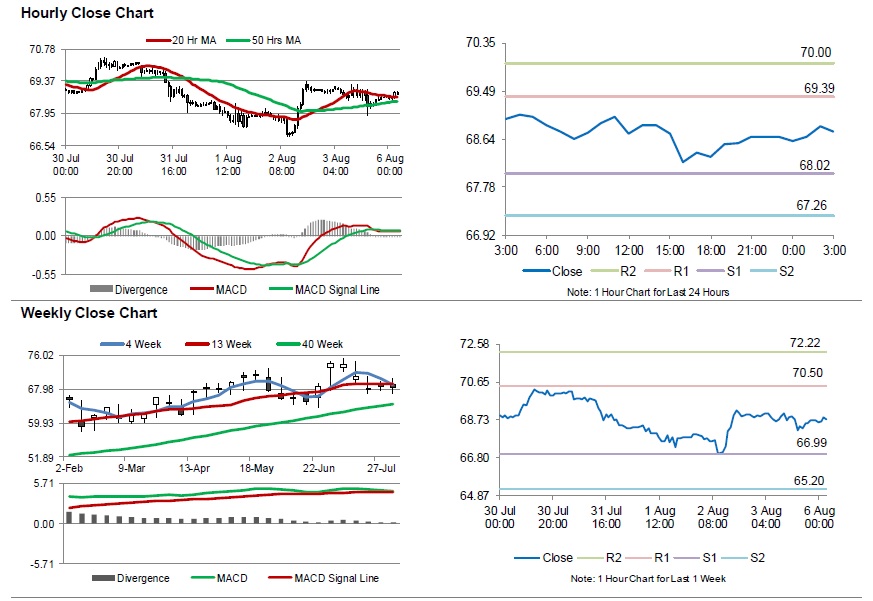
For the 24 hours to 23:00 GMT, Crude Oil declined 0.51% against the USD and closed at USD68.57 per barrel on Friday, amid increasing global crude oil output.
Meanwhile, fresh figures from Baker Hughes disclosed that the number of active oil rigs dropped by 2 at 859 in the week ended 03 August.
In the Asian session, at GMT0300, the pair is trading at 68.78, with oil trading 0.31% higher against the USD from Friday’s close, after Saudi crude production unexpectedly fell in July and as American shale drilling stalled.
The pair is expected to find support at 68.02, and a fall through could take it to the next support level of 67.26. The pair is expected to find its first resistance at 69.39, and a rise through could take it to the next resistance level of 70.00.
Crude oil is showing convergence with its 20 Hr moving average and trading above its 50 Hr moving average.
Weekly Wave Analysis EUR/USD, GBP/USD, USD/JPY
EUR/USD
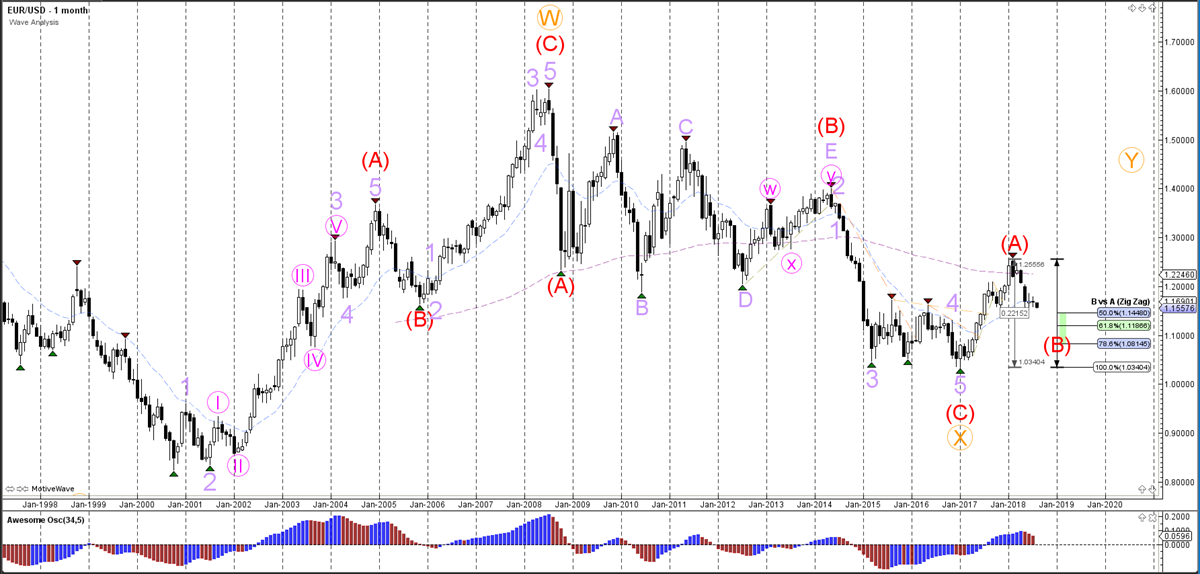
The EUR/USD is retesting the previous bottom near 1.15, which is a critical decision zone for a bullish bounce or bearish breakout. A bull reversal confirms the larger WXY (pink) reversal within wave B (light purple) whereas a bear break indicates a wave pattern change. In that case, wave 4-5 (pink) within wave A (light purple) is still open.
Daily chart:
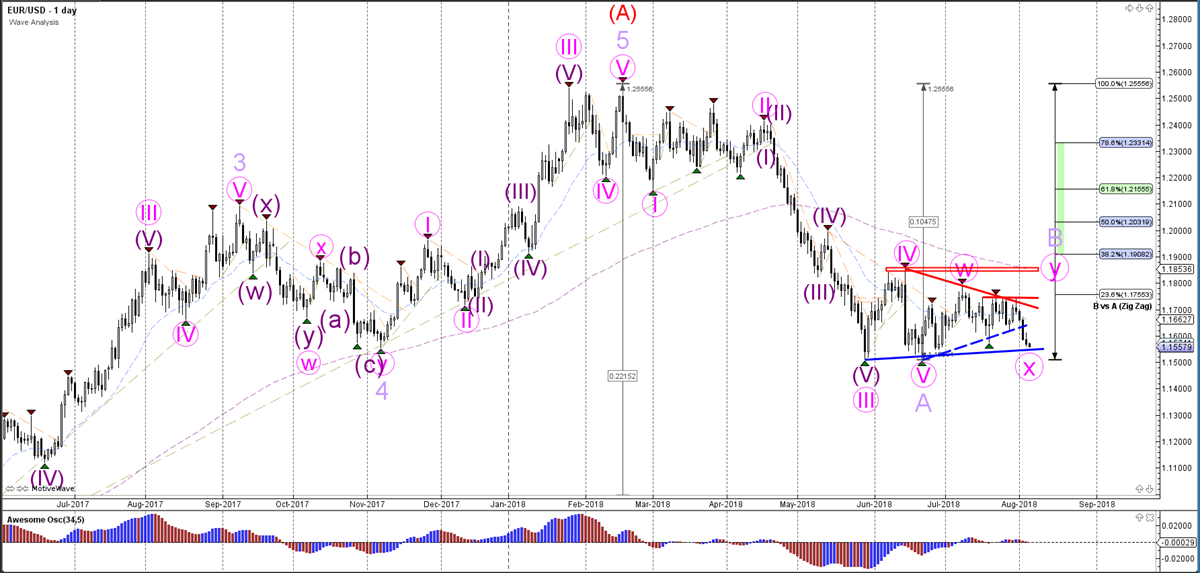
The EUR/USD seems to be building a bearish ABC (purple) correction within wave B (red).
Weekly chart:
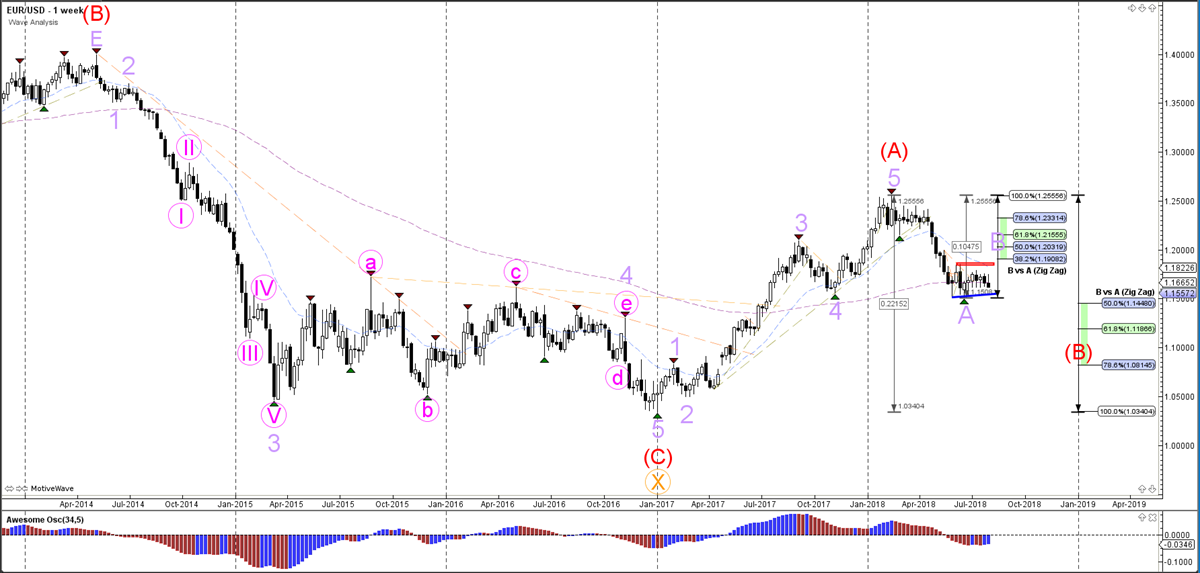
The EUR/USD has completed wave A (red) and price is most likely retracing to the Fibonacci levels of wave B (red).
Monthly chart:
GBP/USD
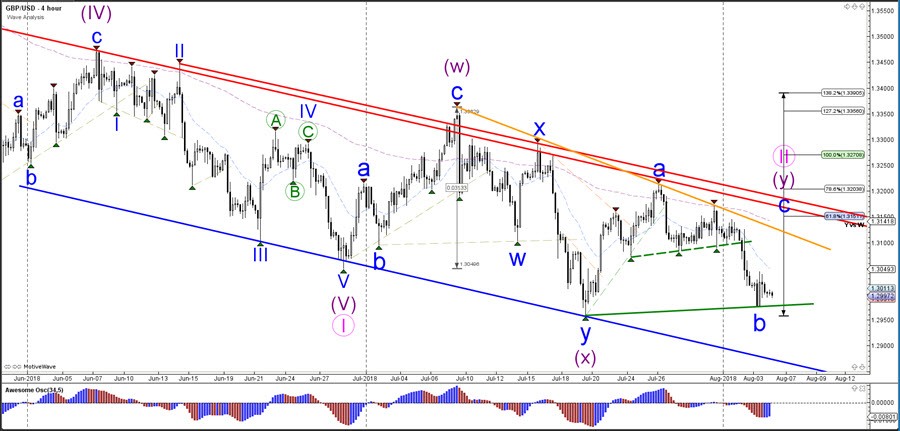
The GBP/USD remains in a downtrend channel but price is now challenging a key support trend line (green). A bullish bounce could confirm the potential WXY (purple) correction within wave 2 (pink) whereas a bearish break below the Fibonacci levels of wave X vs W invalidates the correction and makes a downtrend likely.
Daily chart:
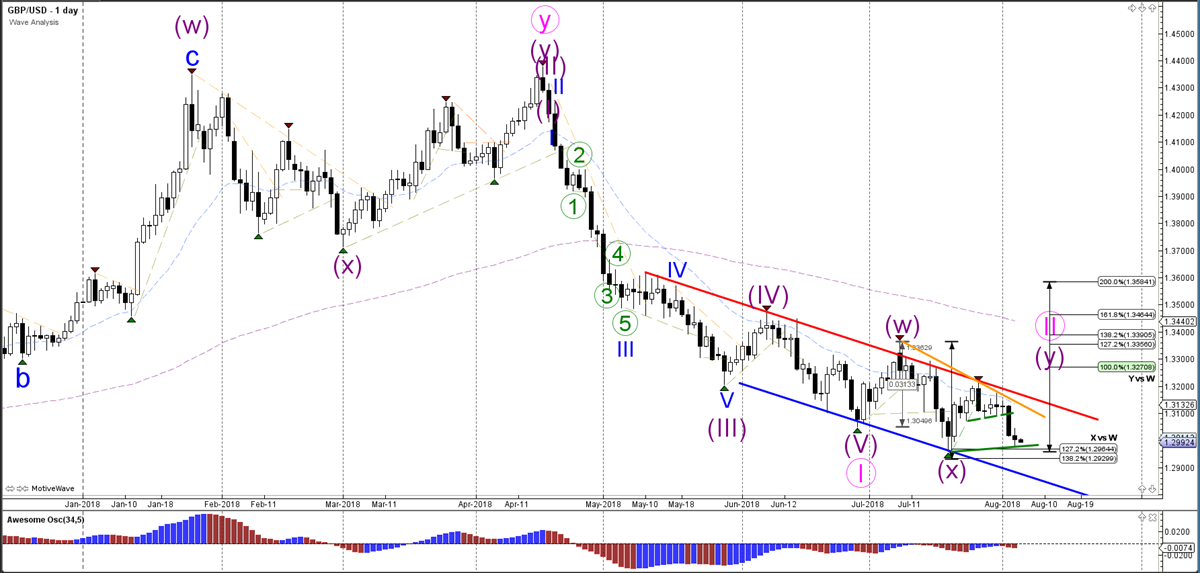
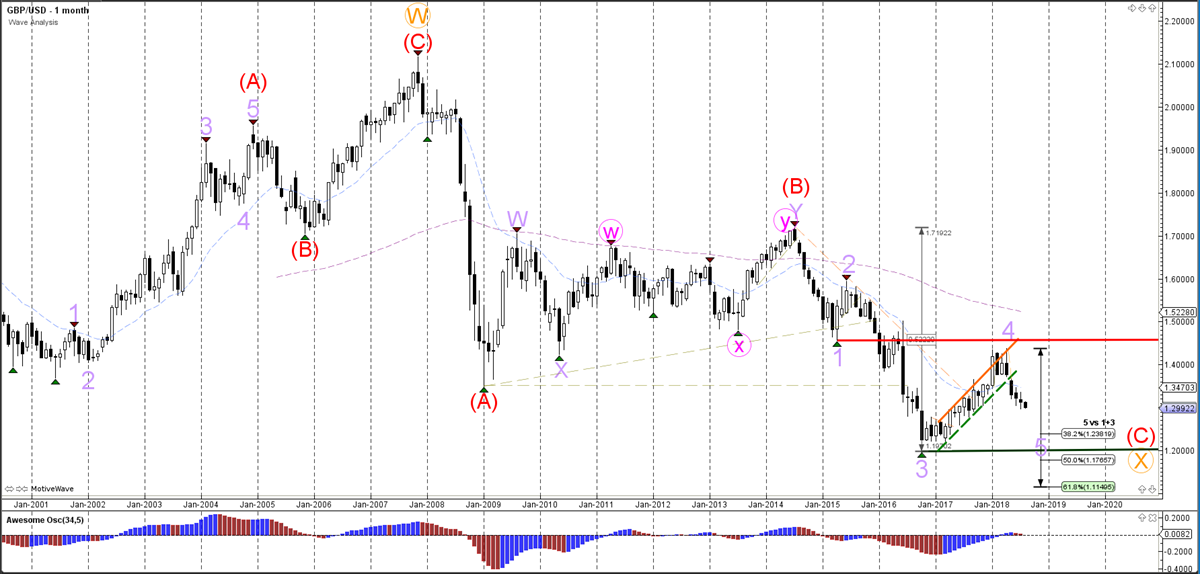
The GBP/USD has probably started the bearish wave 5 after price has completed a wave 4 (light purple) correction.
Weekly chart
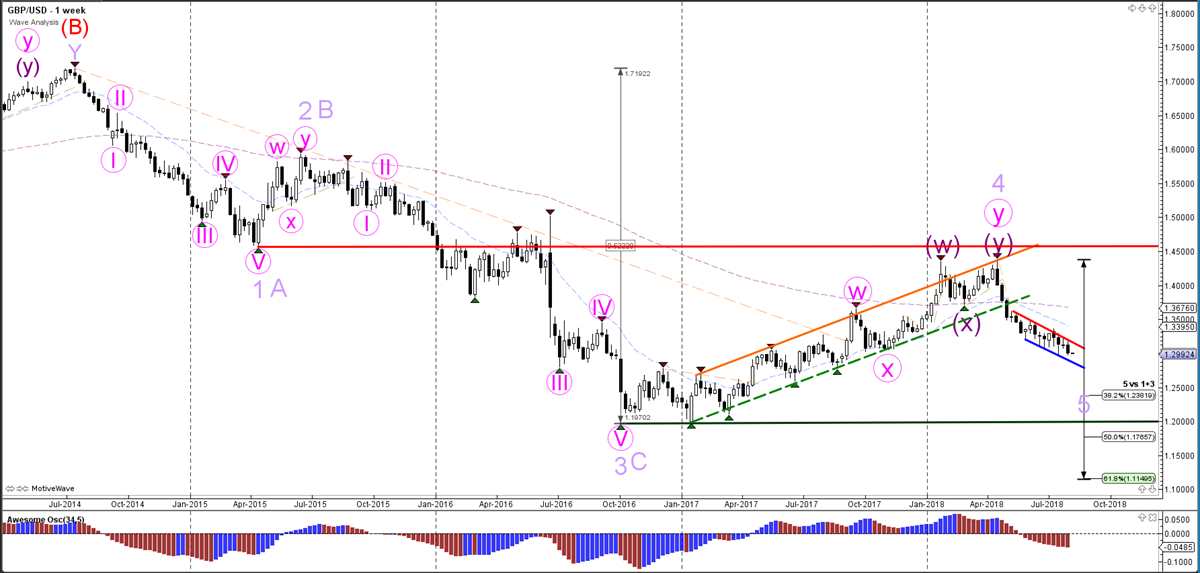
The GBP/USD bearish breakout is probably indicating the start of wave 5 (purple) whereas a bullish break above resistance (red) indicates that a different wave pattern is valid.
Monthly chart:
USD/JPY
The USD/JPY is probably building a bearish ABC (red) within the final leg of the triangle pattern, which is wave E (light purple).
Daily chart:
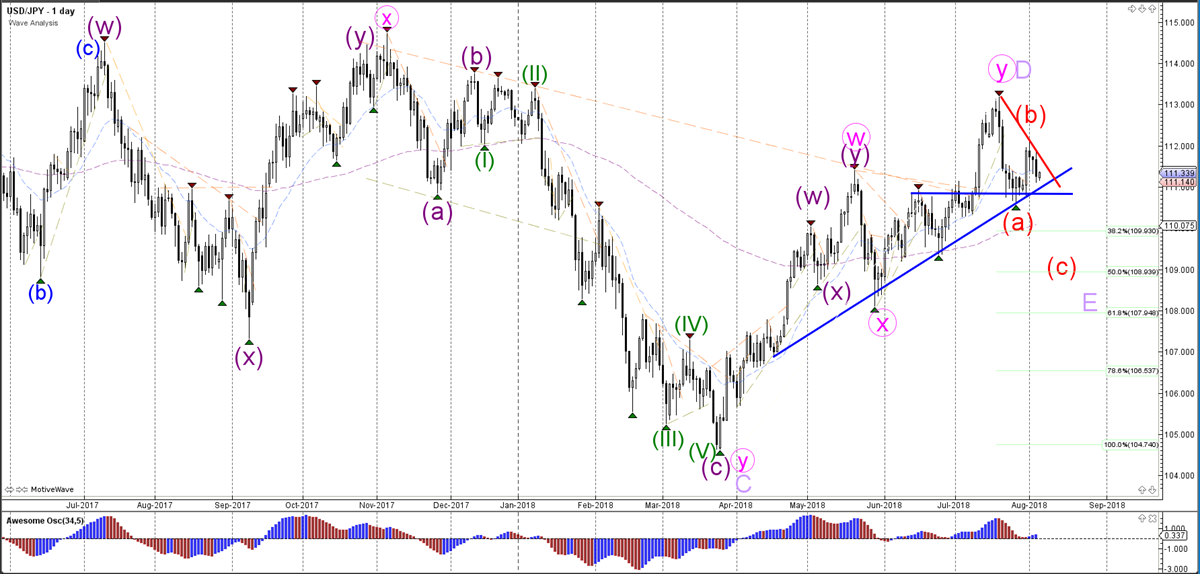
The USD/JPY could be building an ABCDE triangle (light purple) within wave B (red).
Weekly chart:
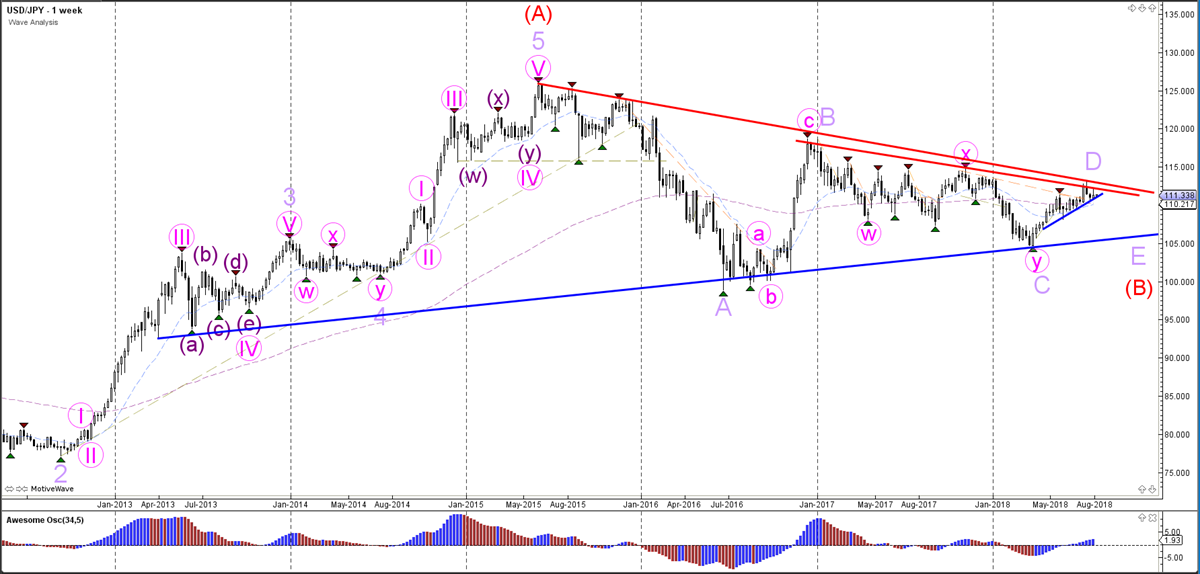
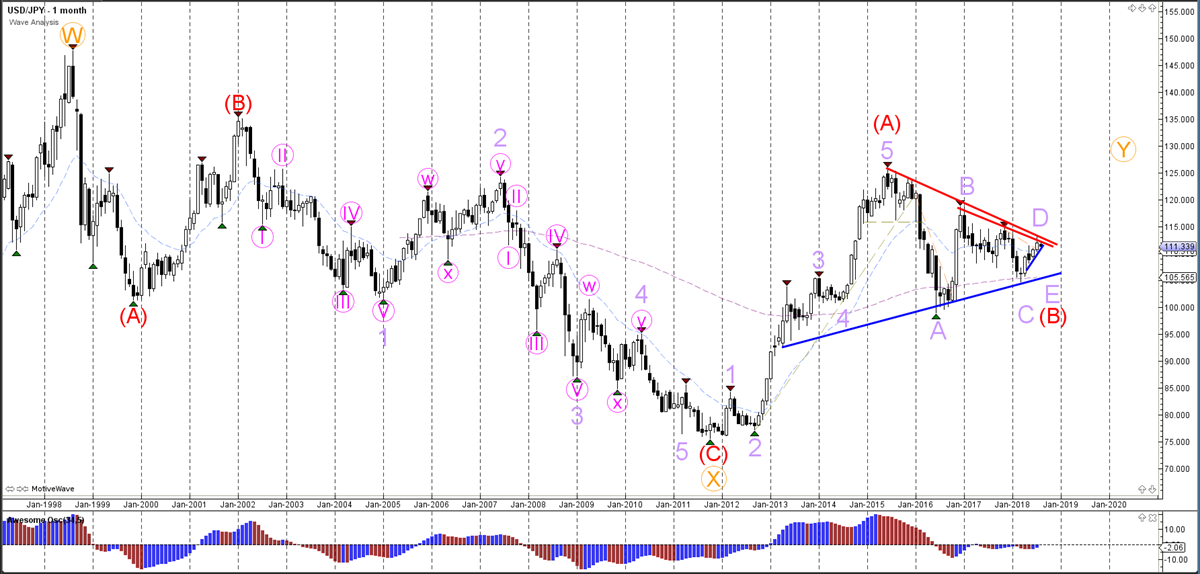
The USD/JPY is in the wave E (light purple) of the triangle pattern.
Monthly chart:
EUR/USD Bearish Impulse Challenges 1.15 Support Zone
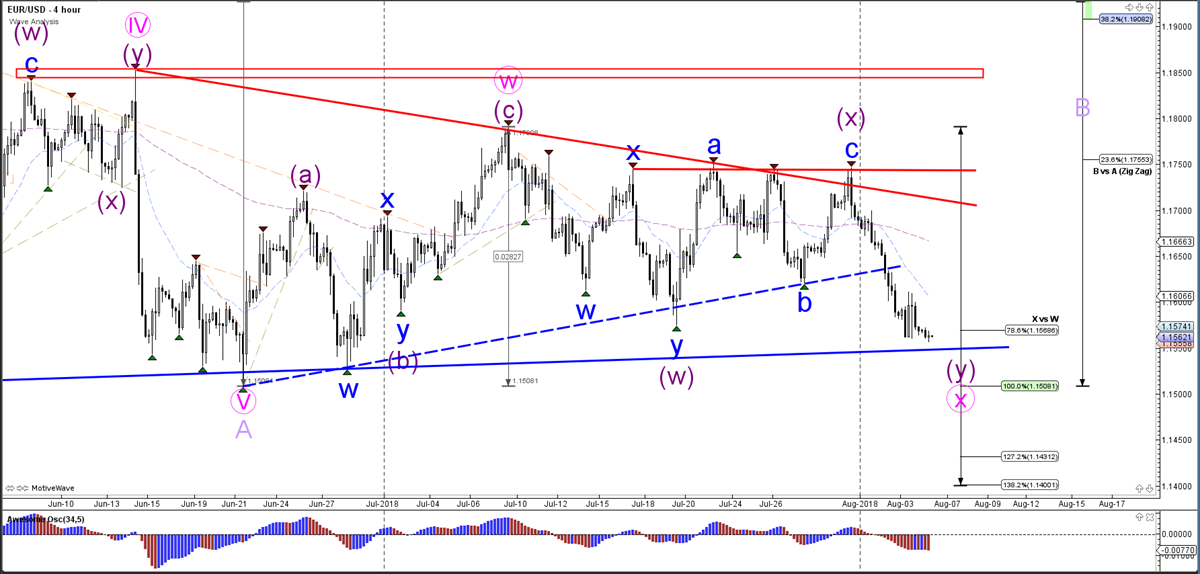
The EUR/USD broke the support trend line (dotted blue) and could either be re-starting the downtrend or extending the bullish correction (pink WXY as indicated in the image). A break below the bottom (blue) of the range at 1.15 could indicate a change in wave patterns: in that case, price has probably completed a wave 4 and is now ready for a bearish wave 5.
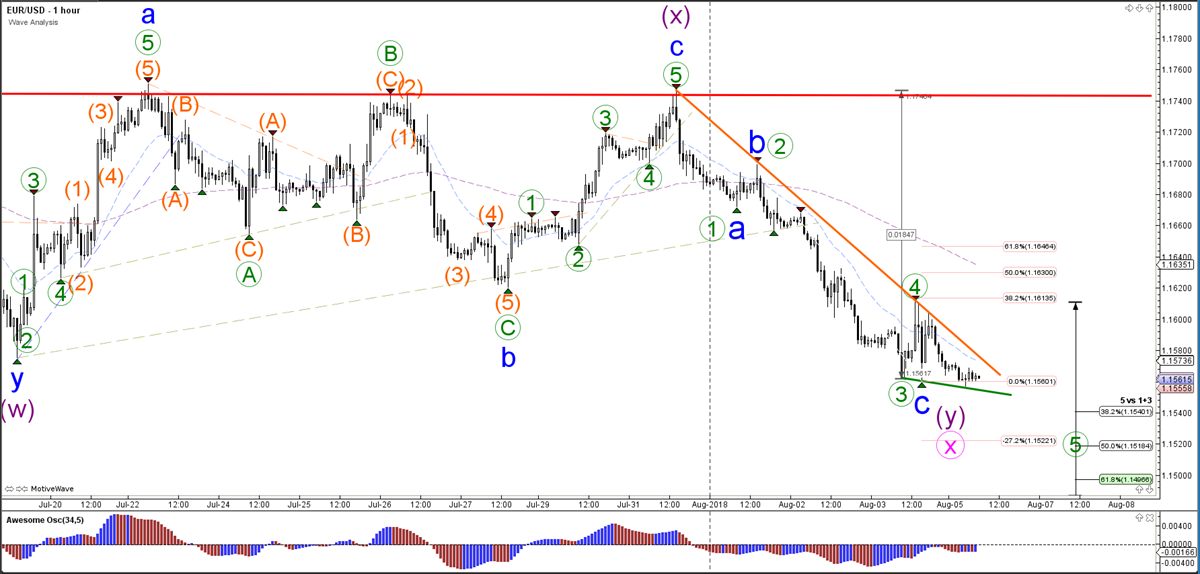
The EUR/USD has either completed a bearish ABC (blue) zigzag pattern or price is developing an impulsive 5 (green) wave down. A wave 4 (green) is probable as long as price stays below the Fibonacci resistance levels (red box), otherwise a bigger bullish breakout is possible. A bearish breakout could aim for the Fibonacci targets of wave 5 vs 1+3.
GBP/USD Close To Confirming Bearish Wave 3 OR C
The GBP/USD is testing a key support level which is a decision zone for a bullish bounce or bearish breakout. The current wave patterns favour a reversal to retest resistance levels.
The GBP/USD wave pattern is indicating that a larger bullish ABC (blue) remains likely at the moment. The wave B (blue) however is invalidated if price manages to break below the bottom of wave X (purple). In that case, a bearish downtrend is likely to restart.
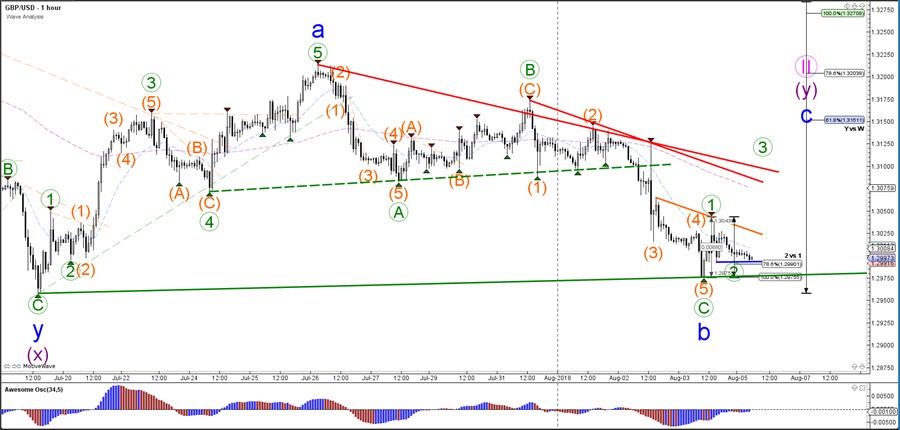
The GBP/USD has completed 5 bearish waves (orange) within a wave C (green) of a larger wave B (blue) if the larger bullish ABC (blue) will indeed take place. The confirmation will probably occur if price manages to break above the resistance trend lines. A break below the bottom of wave 2 vs 1 (green) means that price probably completed a wave 3 rather than a wave C (green).
The Italian Government Held A Meeting On The Budget
Market movers today
With no significant market movers on the agenda today, the focus will be on new signals from China and the US in the ongoing trade war after Chinese authorities pledged on Friday to impose tariffs on USD60bn of imports from the US in retaliation to US trade restrictions.
In the euro area, the Sentix investor confidence indicator will be released with market consensus expecting a slight increase to 12.6 in August after declining significantly for most of 2018.
The Italian government bond market has been under a lot of pressure in recent weeks given the uncertainty on fiscal policy. On Friday, the Italian government held a meeting on the budget, but so far we have not had any details on the deal, and according to the Italian Minister of Finance, the deal will be published in September.
Selected market news
The Chinese yuan strengthened after the Chinese Central Bank (PBoC) surprised the markets on Friday afternoon by making it more expensive to be short the Chinese yuan. The PBoC will impose a reserve requirement of 20% on some trading of FX forwards. It did this before back in 2015 in order to stabilise the currency. The move has supported the yuan this morning.
The risk of a 'no deal' situation is increasing, according to one of the UK ministers in Theresa May's government. The warning was given by Liam Fox, who is Minister for International Trade in an interview with the Sunday Times. This risk will keep pressure on the GBP going forward.
Sentiment has been mixed in the Asian equity markets this morning as the earnings season continues this week, where the trade conflict between China and the US is weighing on the Chinese equity market, while some of the Asian indices are gaining this morning.
The yield on the 10Y Japanese government bond has been range bound around 10bp this morning, and the 10Y US Treasury closed below 3% ahead of this week's sale of USD78bn in 3Y, 10Y and 30Y US Treasuries.
AUD/USD Daily Outlook
Daily Pivots: (S1) 0.7360; (P) 0.7386; (R1) 0.7424; More...
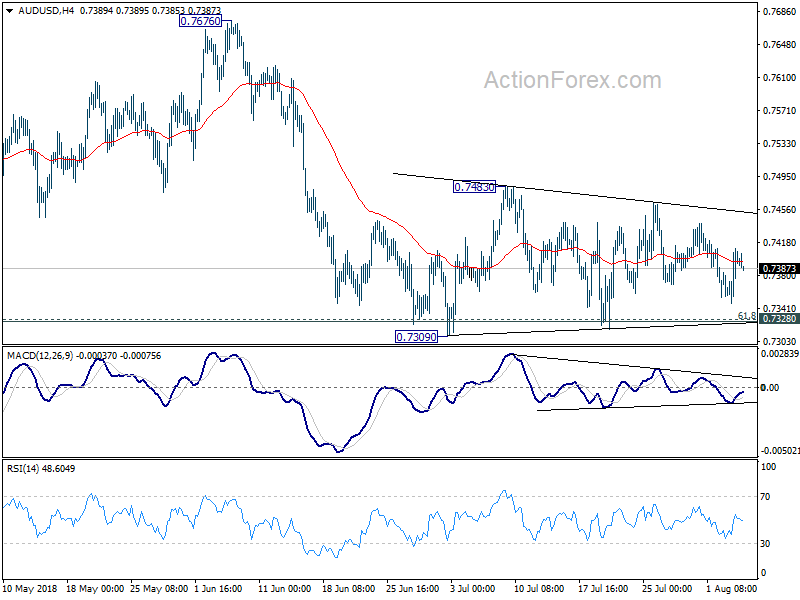
Intraday bias in AUD/USD stays neutral as sideway consolidation from 0.7309 is extending. On the downside, break of 0.7309 and sustained trading below 0.7328 cluster support (61.8% retracement of 0.6826 to 0.8135 at 0.7326) will extend the fall from 0.8135 to 0.7158 support next. On the upside, above 0.7483 resistance will bring stronger rebound. But upside should be limited below 0.7676 resistance to bring larger fall resumption eventually.
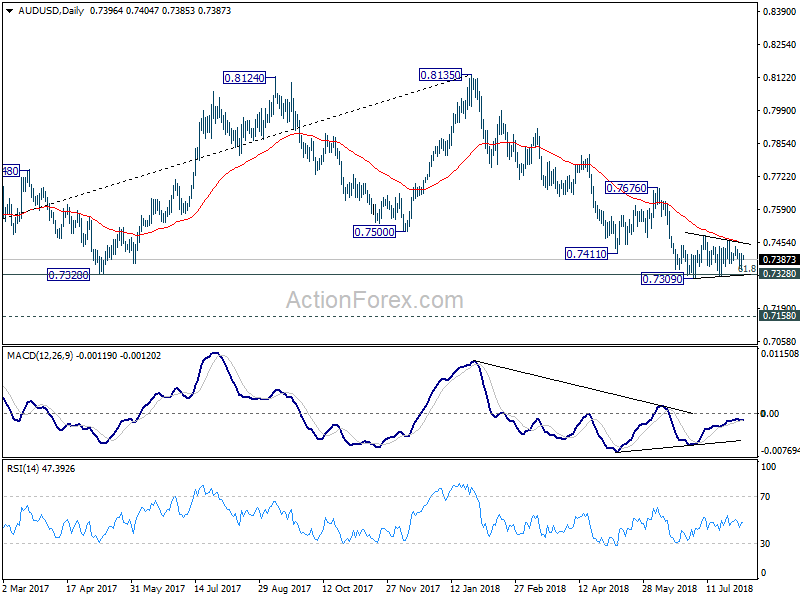
In the bigger picture, medium term rebound from 0.6826 is seen as a corrective move that should be completed at 0.8135. Deeper decline would be seen back to retest 0.6826 low. This will now remain the favored case as long as 0.7676 resistance holds.
USD/CAD Daily Outlook
Daily Pivots: (S1) 1.2959; (P) 1.2999; (R1) 1.3031; More...
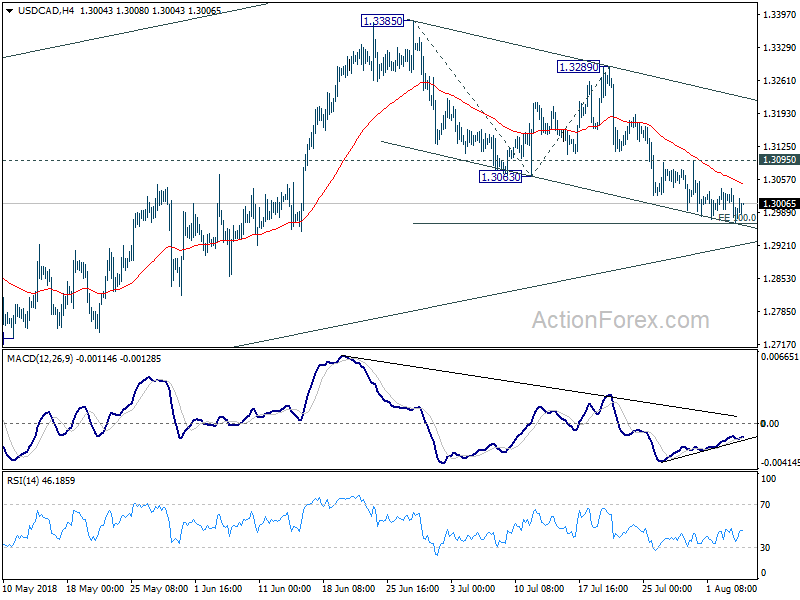
While downside momentum is diminishing as seen in 4 hour MACD, deeper fall cannot be ruled out yet. Still, we'd continue to expect strong support from rising channel line (now at 1.2912) to contain downside to finish the correction from 1.3385. On the upside, firm break of 1.3095 resistance will turn bias to the upside for 1.3289 resistance.
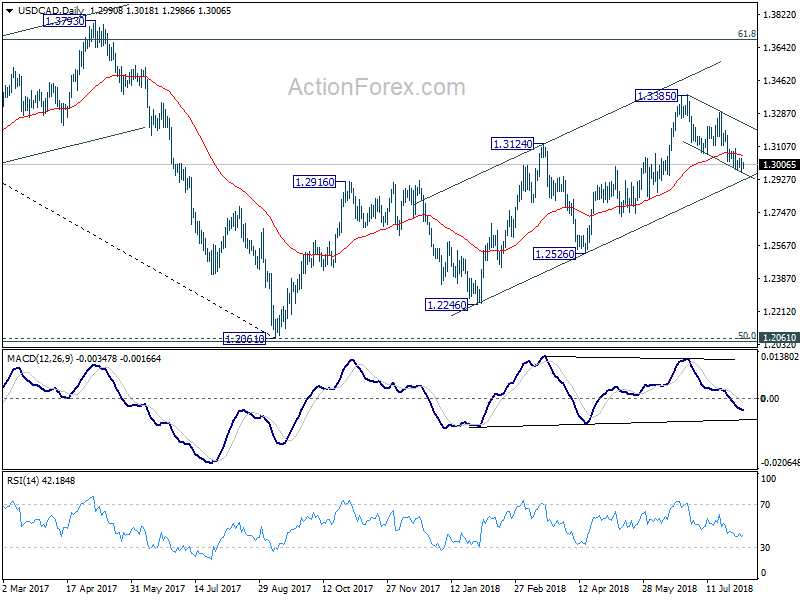
In the bigger picture, as long as channel support (now at 1.2912) holds, we're holding to the bullish view. That is, fall from 1.4689 (2015 high) has completed at 1.2061, ahead of 50% retracement of 0.9406 (2011 low) to 1.4689 (2015 high) at 1.2048. Further rally should be seen for 61.8% retracement of 1.4689 to 1.2061 at 1.3685 and above. However, sustained break of the channel support will argue that rise from 1.2061 has completed and will bring deeper fall to 1.2526 support to confirm.
USD/JPY Daily Outlook
Daily Pivots: (S1) 110.95; (P) 111.41; (R1) 111.72; More...
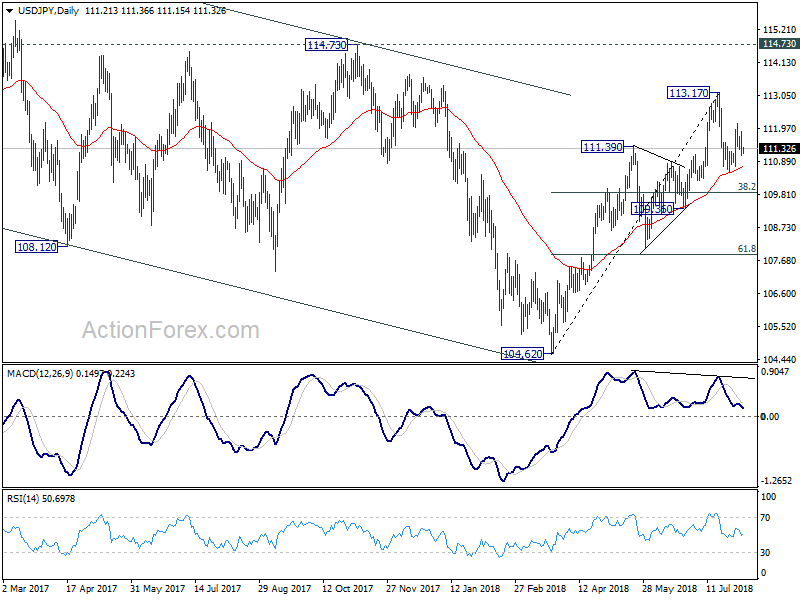
For now, intraday bias in USD/JPY stays mildly on the downside for 110.58 support. Break will extend the correction from 113.17. But still, we'd expect strong support from 38.2% retracement of 104.62 to 113.17 at 109.90 to bring rebound. On the upside, above 112.14 will target a test on 113.17 high.

In the bigger picture, corrective fall from 118.65 (2016 high) should have completed with three waves down to 104.62. Decisive break of 114.73 resistance will likely resume whole rally from 98.97 (2016 low) to 100% projection of 98.97 to 118.65 from 104.62 at 124.30, which is reasonably close to 125.85 (2015 high). This will stay as the preferred case as long as 109.36 support holds.
USD/CHF Daily Outlook
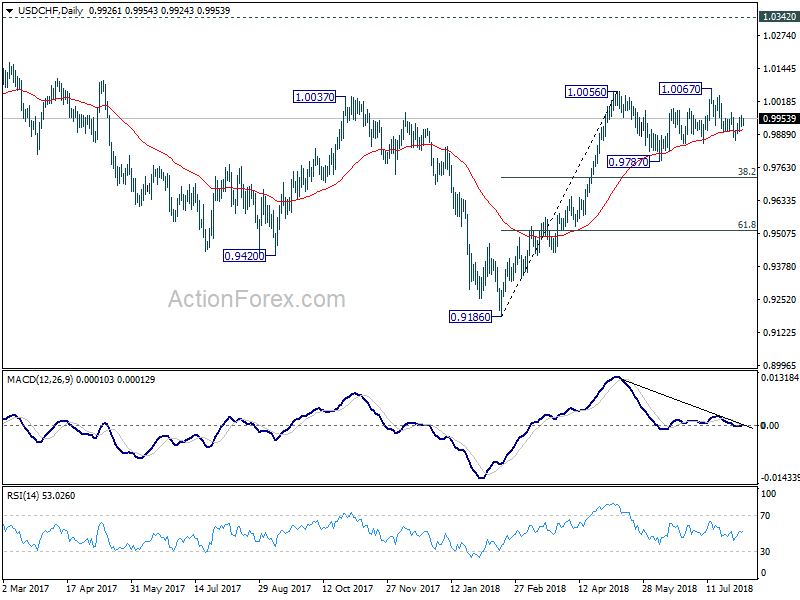
Daily Pivots: (S1) 0.9922; (P) 0.9944; (R1) 0.9967; More...
Intraday bias in USD/CHF remains neutral at this point, with focus on 0.9977 resistance. . On the upside, break of 0.9977 will suggest that the pull back from 1.0067 has completed. And that will bring retest of 1.0067 first. Decisive break there will resume larger rally from 0.9186. On the downside, below 0.9866 will extend the fall from 1.0067 through 0.9856 to 0.9787 support. As price actions from 1.0056 are seen as a corrective pattern, downside should be contained by 38.2% retracement of 0.9186 to 1.0056 at 0.9724 to bring rebound.
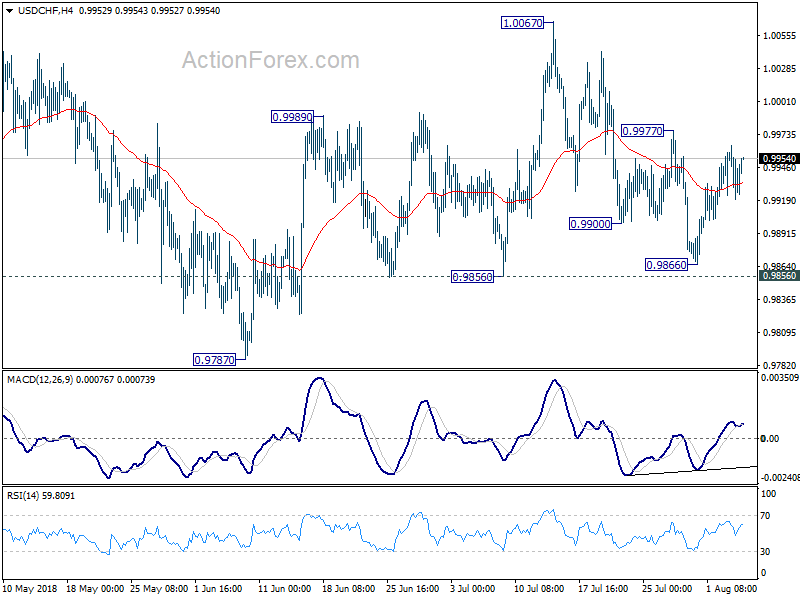
In the bigger picture, current development suggests that the consolidation pattern from 1.0056 is extending with another leg. As long as 38.2% retracement of 0.9186 to 1.0056 at 0.9724 holds, we'd expect rise from 0.9186 to resume at a later stage to retest 1.0342 key resistance (2016 high). However, sustained break of 0.9724 fibonacci level will bring deeper fall, as another declining leg in the long term range pattern.
GBP/USD Daily Outlook
Daily Pivots: (S1) 1.2970; (P) 1.3007; (R1) 1.3039; More...
Intraday bias in GBP/USD remains on the downside for 1.2956 low. Firm break there will resume larger decline from 1.4376 for 1.2874 fibonacci level next. On the upside, above 1.3064 minor resistance will possibly extend the correction from 1.2956 with another rebound through 1.3212. But even in that case, upside should be limited by 1.3362 resistance to bring larger decline resumption eventually.

In the bigger picture, whole medium term rebound from 1.1946 (2016 low) should have completed at 1.4376 already, after rejection from 55 month EMA (now at 1.4141). Fall from 1.4376 should extend to 61.8% retracement of 1.1946 (2016 low) to 1.4376 at 1.2874 next. Decisive break of 1.2874 will raise the chance of long term down trend resumption through 1.1946 low. On the upside, break of 1.3362 resistance is needed to be the first indication of medium term bottoming. Otherwise, outlook will remain bearish even in case of strong rebound.
