

Sample Category Title
EUR/JPY Weekly Outlook
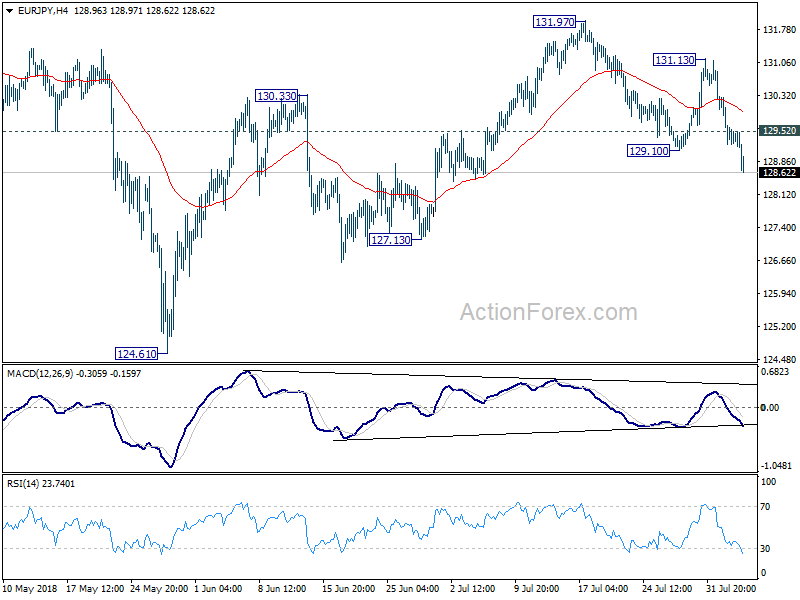
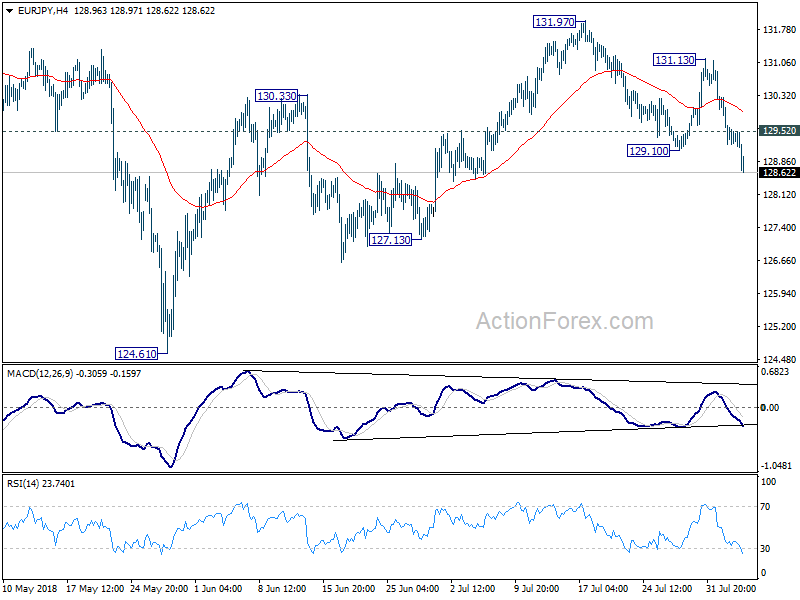
The rebound to 131.13 last week was brief. EUR/JPY drops sharply since then, through 129.10 support to close at 128.62. The development revives the case that corrective rebound from 124.61 has completed with three waves up to 131.97. Initial bias stays on the downside this week for 127.13 support first. Decisive break there will bring retest of 124.61 low. On the upside, above 129.52 minor resistance will turn intraday bias neutral first. But near term outlook will remain cautiously bearish as long as 131.13 resistance holds.
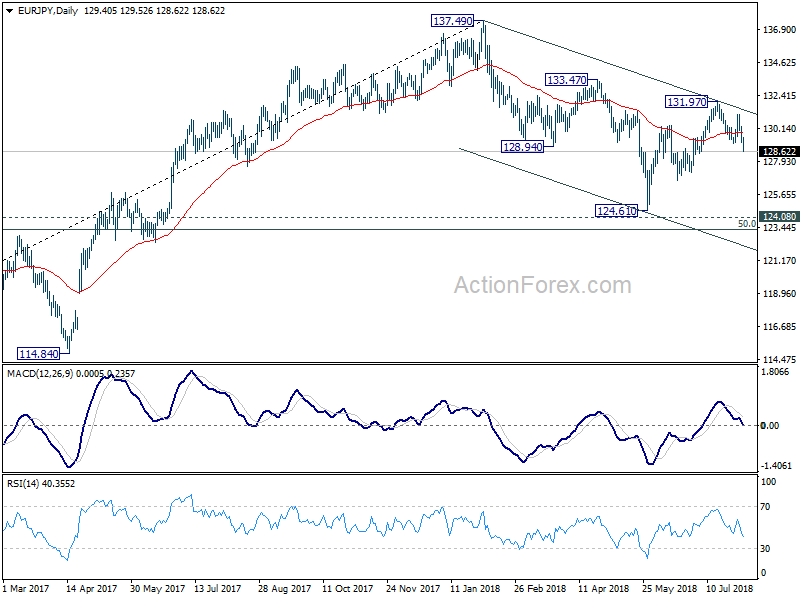
In the bigger picture, for now, EUR/JPY is still holding above 124.08 key support turned resistance. And the larger rise from 109.03 (2016 low) mildly in favor to resume. Break of 133.47 should send the cross through 137.49 high. However, decisive break of 124.08 will confirm medium term reversal and could then pave the way back to 109.03 low and below.
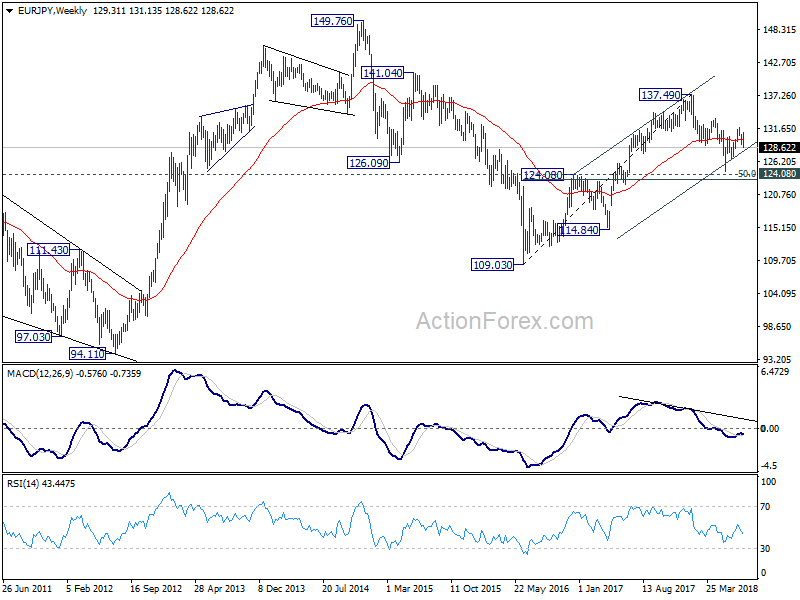
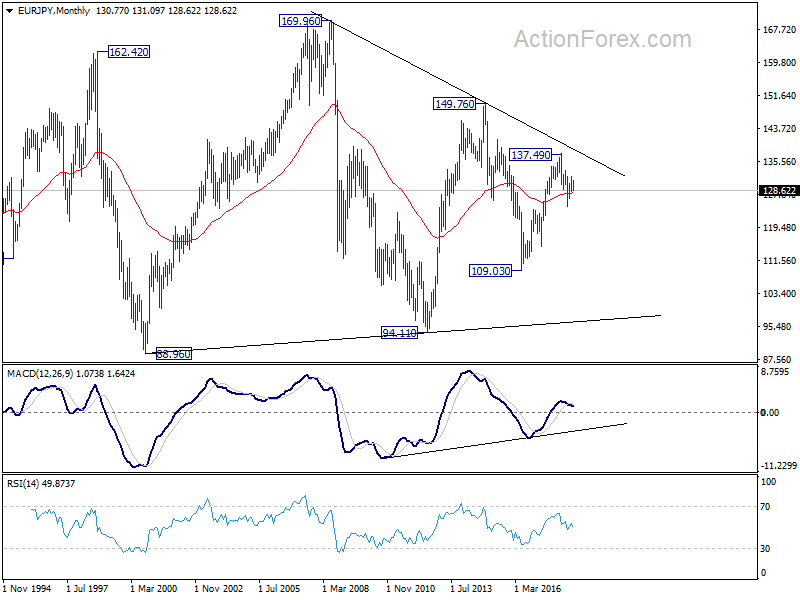
In the long term picture, at this point, EUR/JPY is staying in long term sideway pattern, established since 2000. Rise from 109.03 is seen as a leg inside the pattern. As long as 124.08 support holds, further rally is in favor in medium to long term through 149.76 high. However, break of 124.08 could extend the fall through 109.03 low instead.
EUR/GBP Weekly Outlook
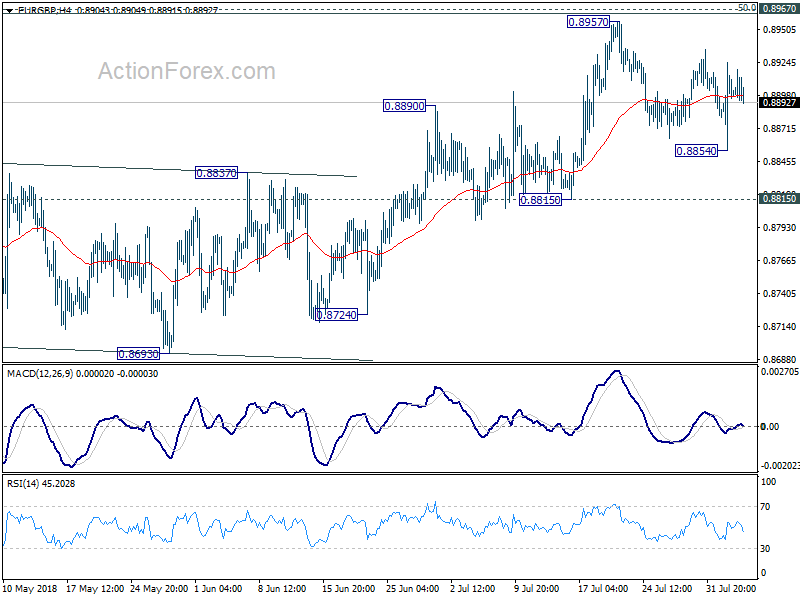
After all the volatility, EUR/GBP remains bounded in consolidation from 0.8957. There is no clear sign of breakout yet. Initial bias stays neutral this week for more range trading. As long as 0.8815 support holds, outlook remains bearish and further rise is expected in the cross. On the upside, decisive break of 0.8967 cluster resistance (50% retracement of 0.9305 to 0.8620 at 0.8963) should confirm completion of whole decline from 0.9305. EUR/GBP should then target 61.8% retracement at 0.9043 next.
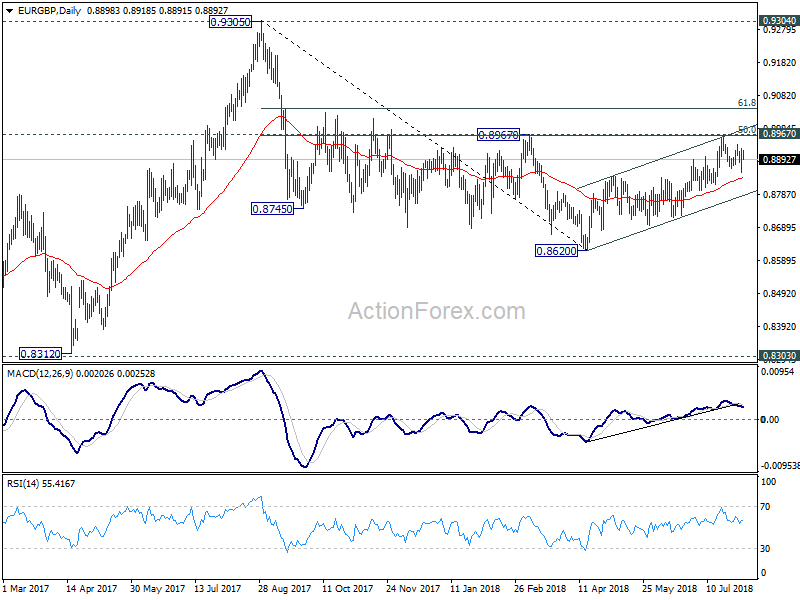
In the bigger picture, EUR/GBP is staying in long term range pattern from 0.9304 (2016 high). The corrective structure of the fall from 0.9305 to 0.8620 is raising the chance that rise from 0.8312 to 0.9305 is an impulsive move. But we're not too confident on it yet. In any case, we'd stay cautious on strong resistance from 0.9304/5 to limit upside in case of further rally. Meanwhile, if there is another medium term decline, strong support will likely be seen from 0.8303 to contain downside.
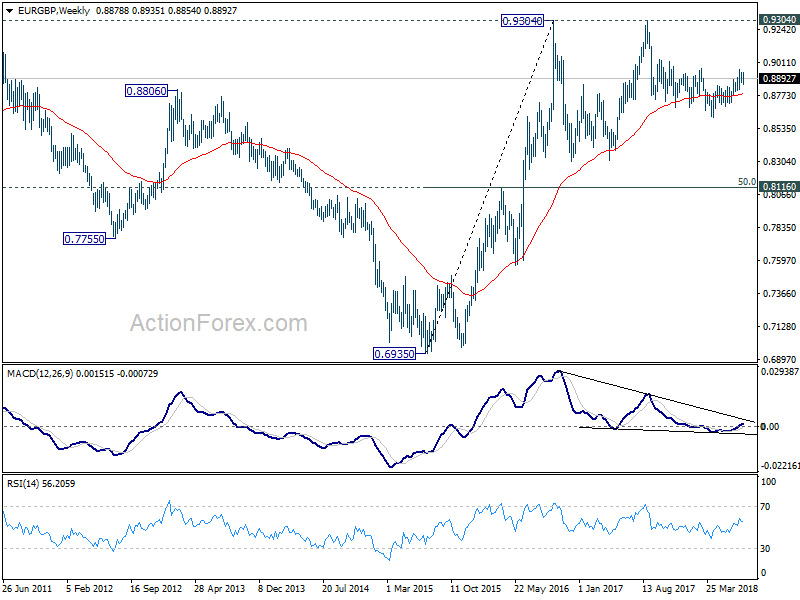
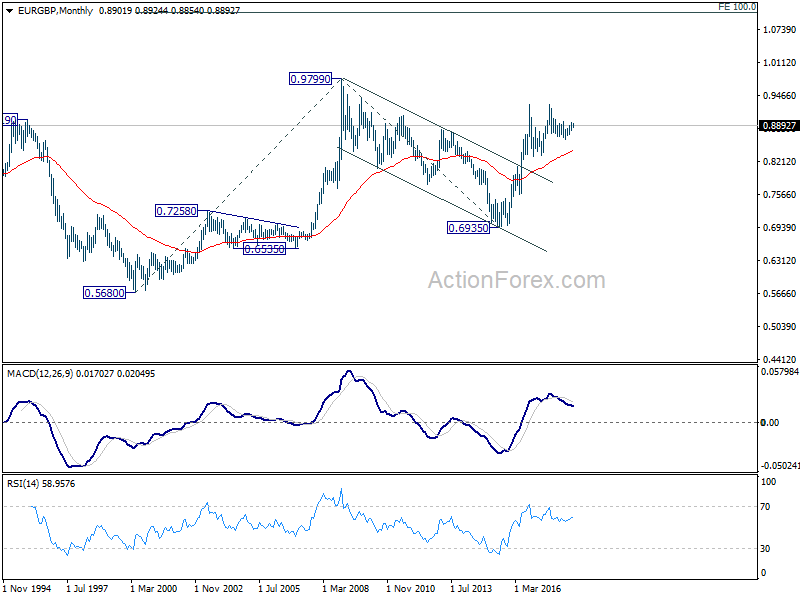
In the long term picture, we're holding on to the view that rise from 0.6935 (2015 low) is resuming the up trend from 0.5680 (2000 low). Hence, after the consolidation from 0.9304 completes, we'd expect another medium term up trend through 0.9799 to 100% projection of 0.5680 to 0.9799 from 0.6935 at 1.1054.
EUR/AUD Weekly Outlook
EUR/AUD dropped sharply to as low as 1.5626 last week. The strong break of 1.5651 support argues that rebound from 1.5271 has completed at 1.5888 already. Initial bias is now on the downside this week for 61.8% retracement of 1.5271 to 1.5888 at 1.5507. Sustained break there will pave the way to retest 1.5271 low. On the upside, break of 1.5749 minor resistance will turn bias back to the upside for 1.5888 instead.
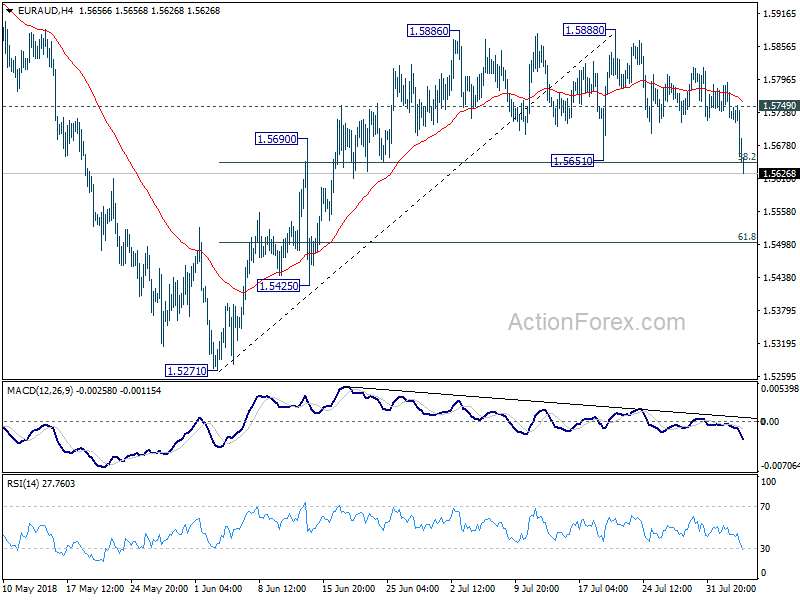
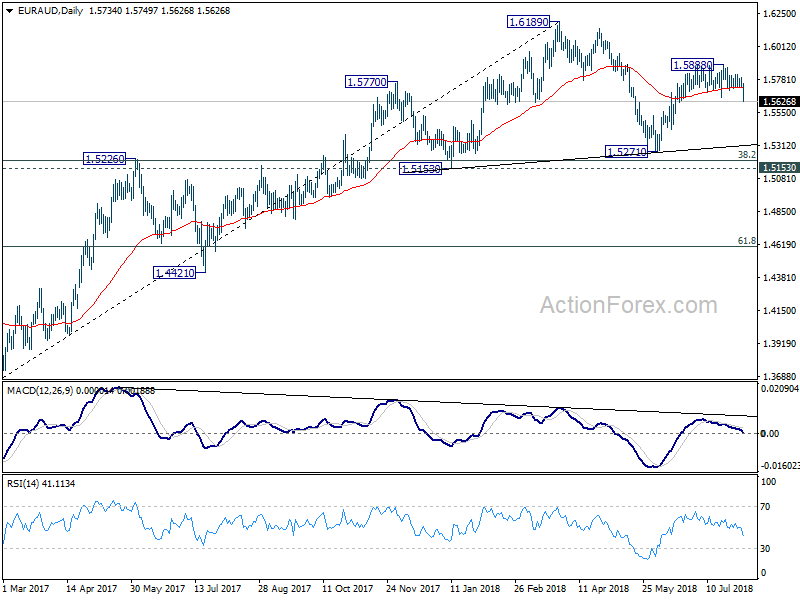
In the bigger picture, the rebound from 1.5271 was somewhat weaker than expected. EUR/AUD also failed to sustain above 55 day EMA and hints on some underlying bearishness. Though, for now, as long as 1.5271 support holds, medium term rise from m 1.3624 (2017 low) is still mildly in favor to extend through 1.6189 high, to 1.6587 key resistance (2015 high). Nevertheless, firm break of 1.5271 will complete a head and shoulder top pattern (ls: 1.5770, h: 1.6189, rs: 1.5888). That would indicate medium term reversal and turn outlook bearish.
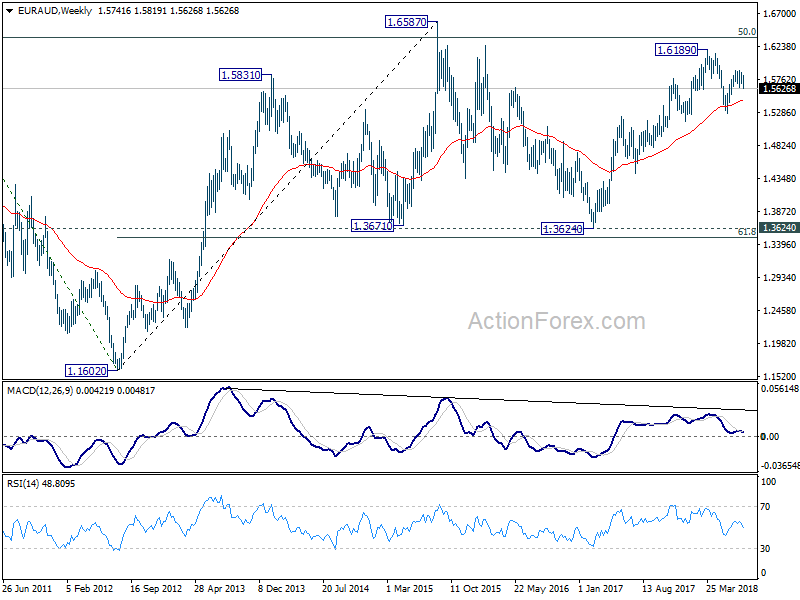
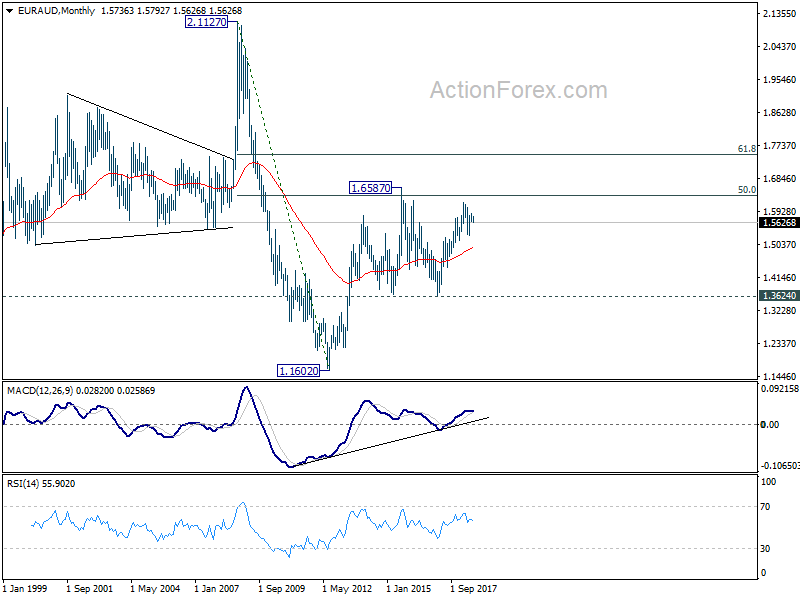
In the longer term picture, the rise from 1.1602 long term bottom (2012 low) isn't over yet. We'll keep monitoring the development but there is prospect of extending the rise to 61.8% retracement of 2.1127 to 1.1602 at 1.7488 and above. However, sustained trading below 1.3624 key support should indicate long term reversal and target 1.1602 long term bottom again.
EUR/CHF Weekly Outlook
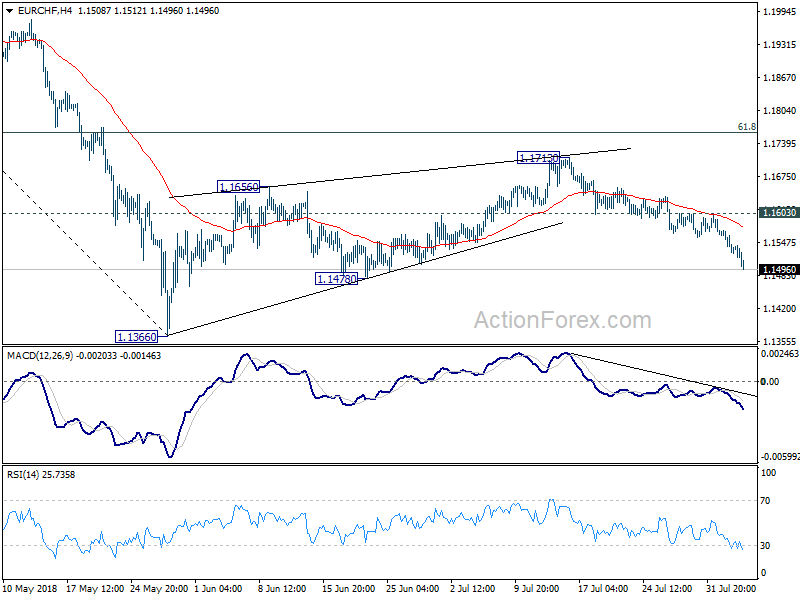
EUR/CHF's fall from 1.1713 extended last week as expected. Downside acceleration affirm our bearish view that corrective rebound from 1.1366 has completed with three waves up to 1.1713 already. Initial bias stays on the downside this week. Break of 1.1478 support will further confirm our view and target 1.1366 low. On the upside, break of 1.1603 resistance is needed to indicate completion of the fall from 1.1713. Otherwise, near term outlook will stay bearish in case of recovery.
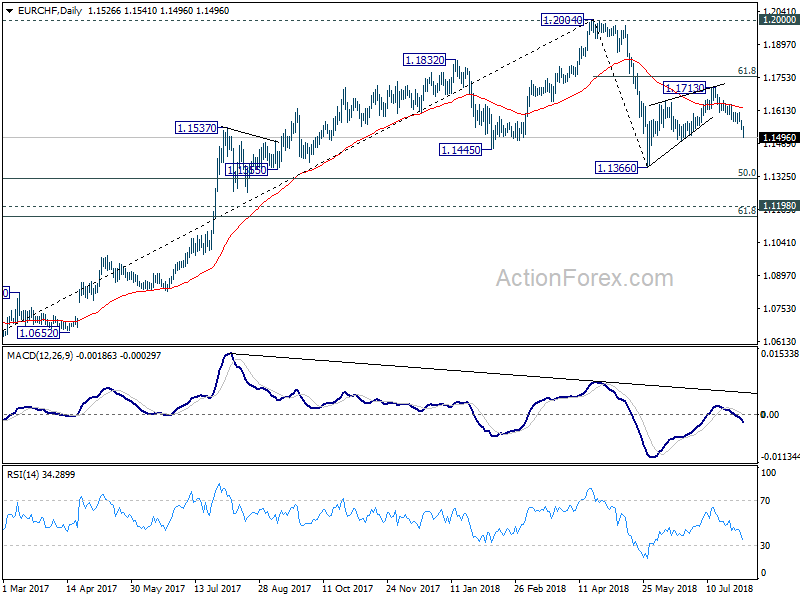
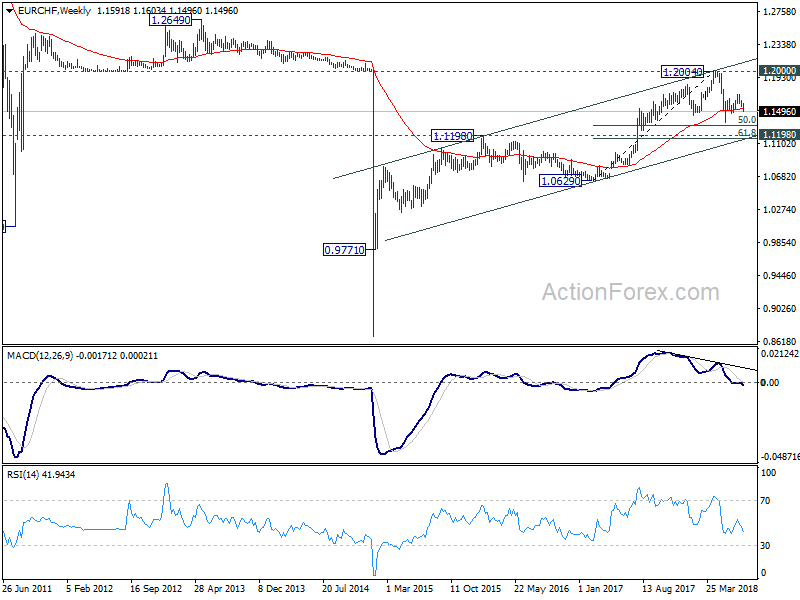
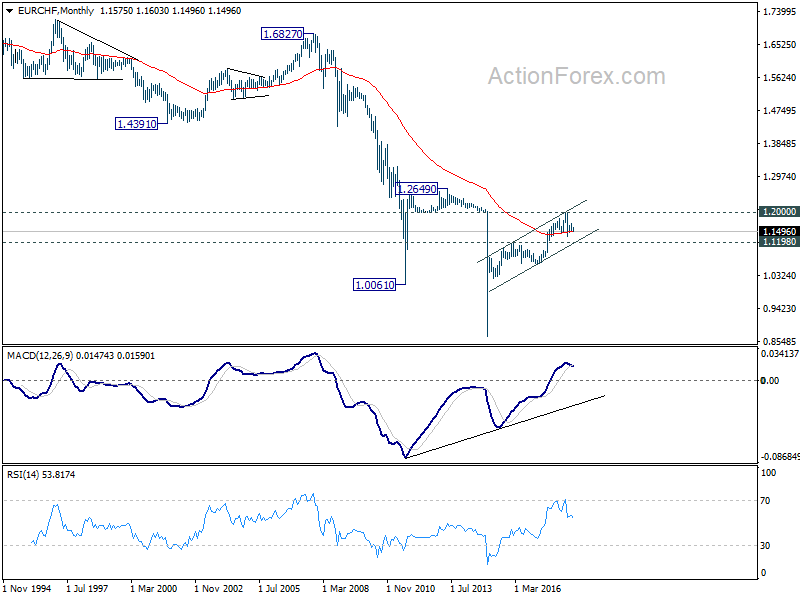
In the bigger picture, 1.2004 is seen as a medium term top with bearish divergence condition in daily and weekly MACD. 1.2000 is also an important resistance level. Hence, the corrective pattern from 1.2004 is expected to extend for a while before completion. We're not anticipating a break of 1.2004 in near term. Another decline cannot be ruled out yet. But in that case, strong support should be seen at 1.1198 (2016 high), 61.8% retracement of 1.0629 to 1.2004 at 1.1154 to contain downside.
Euro as a Casualty as US-China Trade War Turns into Something Bigger
Much volatility was seen in the markets last week with a lot of themes developed. Canadian Dollar ended as the strongest one as strong data boosted chance of August BoC hike. Swiss Franc followed as the second strongest on risk aversion in Europe. Dollar was original set to perform better as trade tension escalated again. But it only ended as the third strongest after Chinese intervention in Yuan, as well as mixed non-farm payroll report. Meanwhile, Sterling was the worst performer after dovish BoE hike. Euro followed as second weakest as it's a casualty of US-China trade war.
Canadian Dollar boosted by strong economy and NAFTA optimism
Canadian Dollar ended as the strongest one last week with support from optimism in the economy, as well as progress in NAFTA renegotiation. GDP grew an impressive 0.5% mom in May, with broad-based strength. 19 out of 20 industries reported growth, except utilities. Further than that trade data released on Friday also showed resilience, with 2.1% jump in export in volume terms. And more importantly, the June data revealed that after steel and aluminum tariffs by US came in to effect, steel exports dropped -37% mom while aluminum export dropped -7%. Growth elsewhere were more than enough to offset such contraction.
There was some jitter for Canadian Dollar as the country was kicked out of the bilateral NAFTA talks between the US and Mexico. Traders initially took that as a negative but could have later changed their mind. There appeared to be some concrete progress between the US and Mexico. Mexican Economy Minister Ildefonso Guajardo declared on Friday that major stumbling blocks were cleared. And, he added that "technically, we are ready to move into finishing the issues, Mexico-U.S. issues, the most next week. There are very good probabilities that we'll be landing solutions." Also Guajardo said there could be a deal before end of August and Canada could jump in any time to make it trilateral.
The markets are now seeing around 75% chance of another rate hike by Bank of Canada in October.
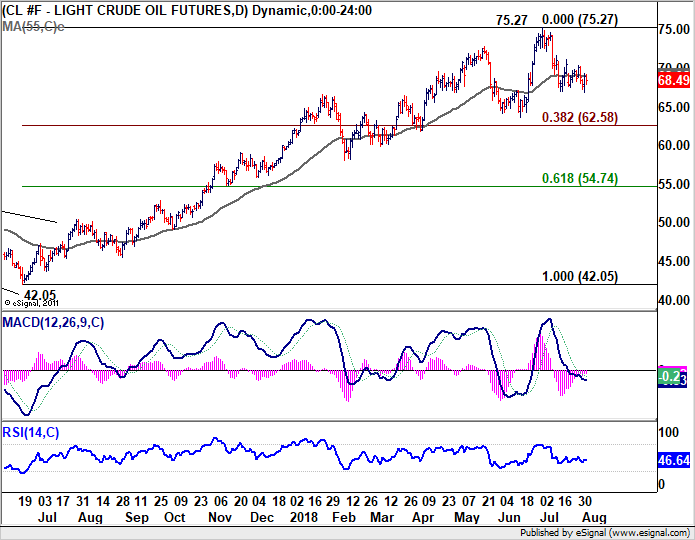
From intermarket correlation point of view, weakness in oil price could be a factor that holds the Loonie back. Nonetheless, while WTI crude oil struggles to regain 70 handle on recovery, it's just hovering around a flat 55 day EMA. And based on diminishing downside momentum as seen in daily MACD, even in case of another fall, downside will likely be contained by 38.2% retracement of 42.05 to 75.27 at 62.58 to set the range.
Sterling weakened broadly after dovish BoE hike
Sterling ended as the weakest one last week primarily due to the dovish rate hike by BoE. The decision to raise the Bank Rate by 25bps to 0.75% matched general market expectations. The unanimous 9-0 vote at first looked hawkish with doves giving in. But at a second glance, it's indeed the result of compromise that the next hike is quite distant away.
The most important part of the announcement was found in the quarterly Inflation Report. There, BoE used a conditioning path that implied Bank rate will hit 0.9% in Q4 2019 1.1% in Q4 2020 and stay there till Q3 2021. In May's conditioning path, the Bank rate will reach 1.0% already in Q3 2019, and then 1.2% in Q3 2020 and stays there till Q2 2021. That is, the current path argues that the next hike could happen in Q1 2020, instead of Q3 2019. And there could be no more rate hike in the forecast horizon.
Also, with such conditioning path, GDP (exclude backcast) is projected to growth faster by 1.5% in the four-quarter to Q3 2018, and 1.8% in the four-quarter to Q3, 2019. But GDP growth in the four-quarter to Q3 2020 is unchanged at 1.7%. Inflation will return to target later at 2.0% in Q3 2021, instead of Q3 2020. But, at 2.2% in Q3 2019 and 2.1% in Q3 2020, it's reasonably close to target.
The dovish message was further affirmed by BoE Governor Mark Carney during the press conference. Carney said that tightening would be gradually as "structural factors that have pushed down the trend equilibrium real rate are likely to persist." It will be limited because "domestic short-term factors (particularly headwinds from uncertainty and fiscal drag) will fade slowly." Also also R* is expected to rise only gradually, and "policy needs to walk – not run".
Sharp fall in DAX weighed down Euro and lifted Swiss Franc
Euro ended the week as the second worst performer while Swiss Franc was the second biggest gainer. Such could be explained by risk aversion in the European markets. DAX gapped sharply lower on Thursday after disappointing results of Siemens and BMW. Escalation of trade tension between US and China also weighed on sentiments.
The DIHK Chambers of Industry and Commerce also warned that US-China trade conflict is already hurting German companies doing businesses in the two countries. Its trade chief Volker Treier warned that "the impact is huge: nearly half of the imports from German companies are directly or indirectly affected by the new tariffs, for example because they source raw materials or components from the other country."
So, Germany would inevitably be affected by global trade tension even though EU could strike a deal with the US to avert direct auto tariffs. Eurozone could be the unintended casualty
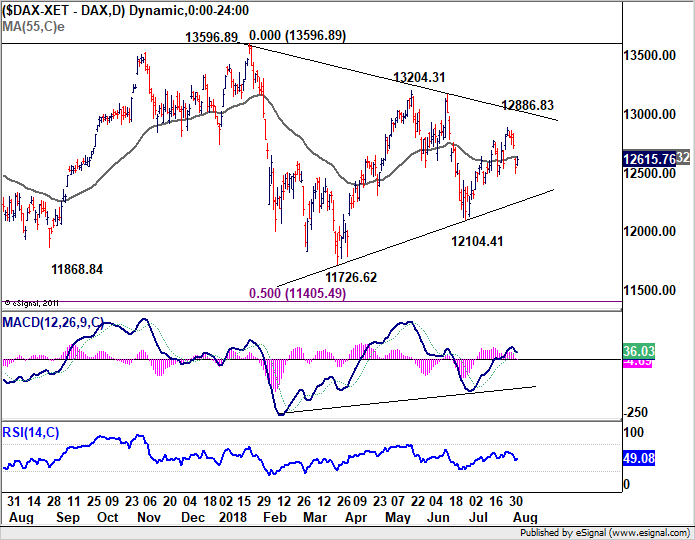
DAX's choppy rebound could have completed at 12886.83, well ahead of the falling trend line resistance. As pointed out last week, the index is seen as bounded in consolidative trading in converging range since 13596.89. The close below 55 day EMA now puts near term focus back to lower trend line support (now at 12270). Break there will pave the way down, possibly through 12104.41 support. And such development would weigh on EUR/CHF further.
JGB yield regained strength after BoJ's strong dovish message
There were a lot of false expectation on BoJ but all were cleared after Governor Haruhiko Kuroda's strong message. Kuroda said with emphasis that there were some speculations that BoJ could seek an "early exit" from ultra loose monetary policy. And he hoped the strengthening of the framework can "dispel such speculation.
In short, BoJ widened the target on 10 year JGB yield from near 0% to a 0.2% band from -0.1% to 0.1%. The objective was to "improve functions in the government bond market, which had been deteriorating" and "help make our easy-policy more sustainable".
Secondly, BoJ introduced forward guidance on interest rates. It "intends to maintain the current extremely low levels of short- and long-term interest rates for an extended period of time". Kuroda said it's for strengthening the "commitment to achieve our 2 percent inflation target". And, "we've adopted this to ensure market trust in our policy as we will be maintaining our massive stimulus longer than initially expected."
Additionally, he also admitted that it takes "longer than expected" for inflation to pick up. Hence, "achievement of our target will be beyond our (three-year) forecast timeframe".
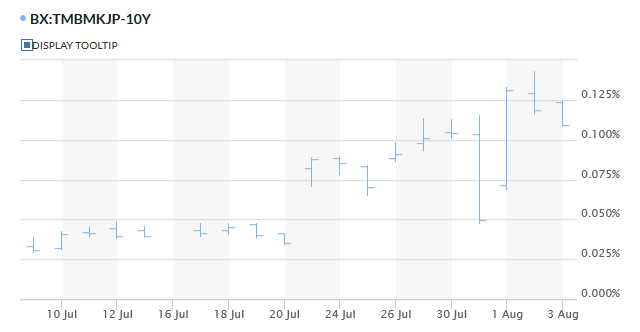
10 year JGB yield once dived to as low as 0.047 initially after BoJ. But it more than revered the loss to hit at high as 0.143 before closing at 0.109. Yen ended the week mixed
It's now more than a trade war between US and China
Now back to US-China trade tension. US raised the stakes last week by announcing the intention to impose 25% tariffs on USD 200B in Chinese imports, instead of 10%. There is no effective date yet. In a some what delayed fashion, China announce on Friday that impost additional levies on 5207 US products, totalling around USD 60B in value. Additional 25% tariff will be imposed on 2493 products, additional 20% on 1078 products, additional 10% on 974 products and additional 5% on 662 products. The effect date is to be determined. The effective date will depend on US imposition of respective tariffs.
While there were rumors of re-engagements, we'd like to emphasized that the situation has already developed in to something more than a trade war. The biggest development last week should be the passage of USD 716B spending bill in the Congress. The bill will strengthen US defence in Indo-Pacific region and take a number of restrictive measures against China. It would also equip the so called Committee on Foreign Investment in the United States to handle national security threats posed by investments.
Most importantly, it's a bipartisan agreement with overwhelming 87-10 votes in the Senate. While there are continuous divisions between Democrats and Republicans, in particular against Trump, the Americans seem to be unified on their position against China. As Senator Sherrod Brown, a Democrat, said, "no country has been more aggressive than China in going after American technology in sectors like aviation, robotics, new energy vehicles, and others where the US has established itself as a global leader." Shortly after, Secretary of State Mike Pompeo announced USD 300m to enhance security in Indo-Pacific, seeking to offset China's influence in the region
In short, we're seeing no reason for Trump to back down from trade war with China. The domestic objections on it could fade as time goes by should the general anti-China sentiments increases. Moreover, resolving the trade dispute with the EU and NAFTA countries should also ease much of the concerns on trade war in a global scale. If it's just about China, it's much easier for Trump and his hawks to persist on it. It's just the beginning of the beginning.
PBoC stepped in to halt Yuan's decline, Dollar pared gains
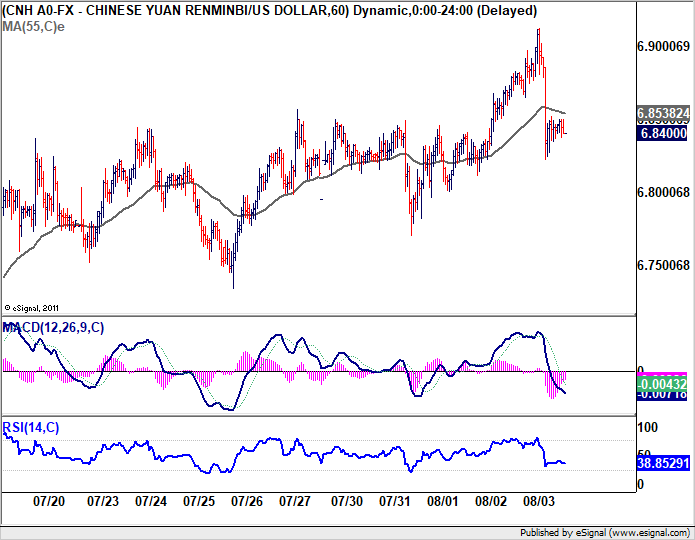
The Chinese Yuan suffered renewed selling over the week with USD/CNH (off shore Yuan) hitting as high as 6.9126. That prompted the People's Bank of China announcing to raise the FX risk reserve ratio of forward sales from 0.% to 20%. That's effective a measure to curb capital outflow and stabilize the falling Yuan exchange rate. USD/CNH then dipped back to close at 6.840. It's seen as a major factor that triggered the late pull back in Dollar and lifted Aussie and Kiwi from the week low. Meanwhile, we'll have to wait till Monday to see if the announce could halt the fall in China SSE, ahead of 2700 key level again.
US treasury yields probably topped and is reversing.
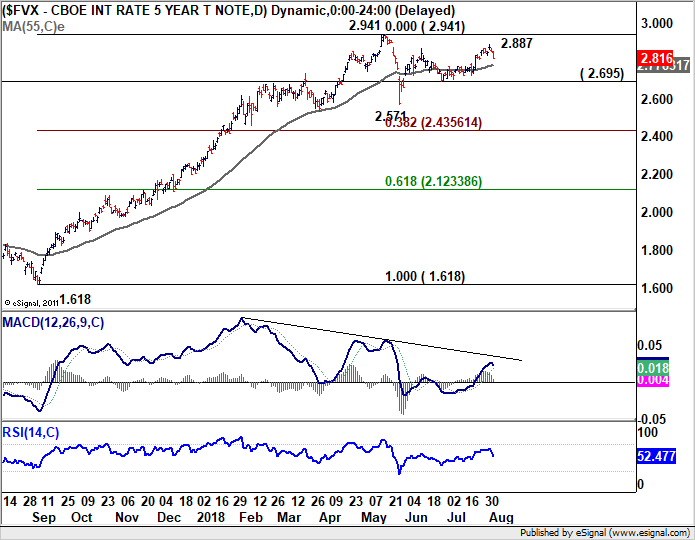
Retreat in US treasury yield is another factor that's limiting Dollar's rally, and in some way held lifted Japanese Yen (with strength in JGB yield in the back ground too). Friday's sharp fall in five year yield apparently suggests that it has topped out in near term at 2.887. Immediate focus is back on 55 day EMA (now at 2.778) this week. Firm break there will also suggests that rebound from 2.571 has completed at 2.887, and would target 2.695 support for confirmation. The correction pattern from 2.951 could eventually have a take on 38.2% retracement of 1.618 to 2.941 before completion.
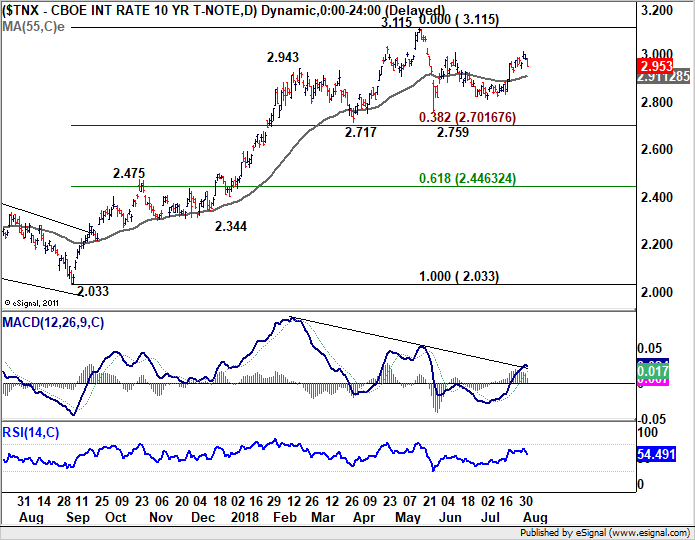
The picture in 10 year yield was less concrete. Still, immediate focus will also be back on 55 day EMA (now at 2.911). Firm break there will likely start the third leg of the corrective pattern from 3.115. And TNX could have a test on 38.2% retracement of 2.033 to 3.115 at 2.701 before completing the correction.
Dollar index could have an upside breakout, depending on Euro
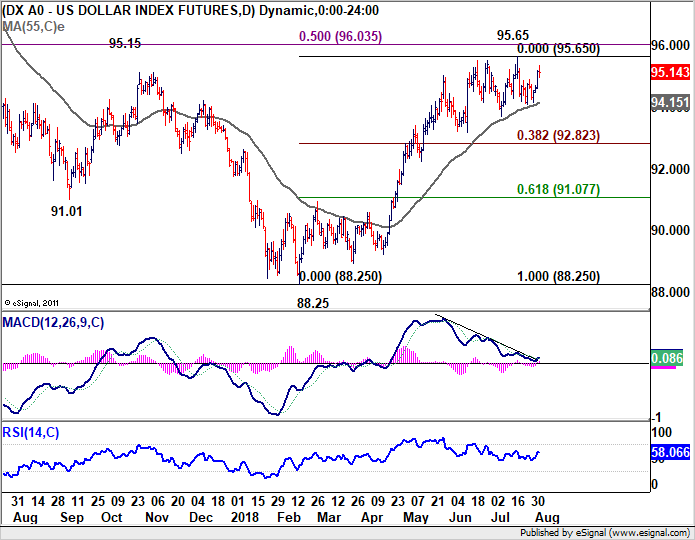
While Dollar index rebounded, there is no convincing momentum for upside breakout yet. All will depends on whether EUR/USD will dive through 1.1507 low. At this point, EUR/USD is in favor to do so. Thus, there is realistic chance of DXY breaking 95.65 high this week. In case of another fall as recent consolidation extends, we'd continue to expect strong support from 38.2% retracement of 88.25 to 95.56 to contain downside.
Position trading strategies - Hold short in GBP/CHF, sell EUR/JPY
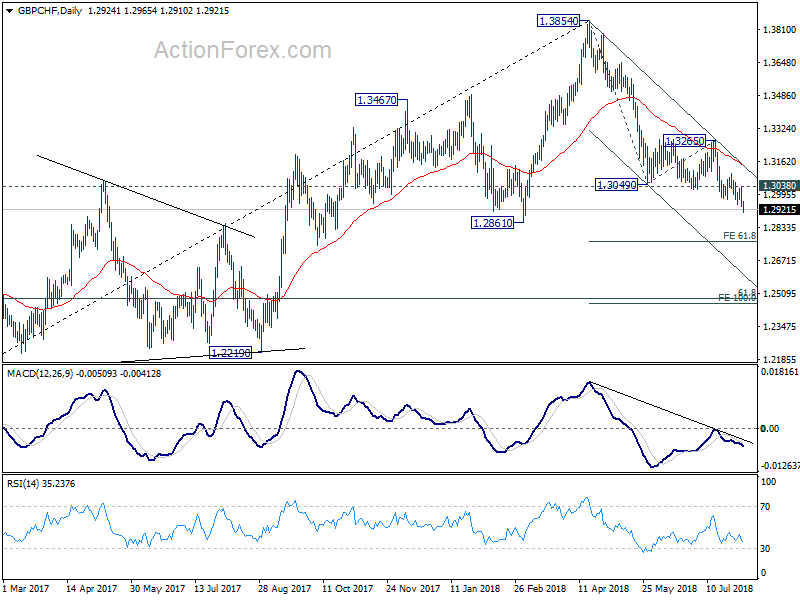
We've entered GBP/CHF short again 1.2971 last week and it's so far developing as expected, even though downside momentum is not satisfying. We'd expect Sterling to stay soft after last week's dovish BoE rate hike. Additionally, risk aversion in European markets could continue to help support the Swiss Franc. Hence, we'll stay short in GBP/CHF, with a stop at 1.3040. 61.8% projection of 1.3854 to 1.3049 from 1.3265 at 1.2768 as first target. And there is prospect of extending to 100% projection at 1.2460 in medium term.
Additionally we're expecting more weakness in Euro too. It's for ceratin that Eurozone economy is slowing down. And, it seems like businesses are starting to feel the impact of US-China conflicts. ECB's policy path is set until through next summer and there is no reason for it to pull ahead the moves. Technically, EUR/USD's breach of 1.1574 is the first sign of downside breakout. EUR/JPY's break of 129.10 confirms resumption of fall from 131.97 and revived the case of near term reversal. EUR/CHF took the lead in near term bearish reversal earlier. EUR/AUD's break of 1.5651 also indicates near term bearish reversal. EUR/CAD is likely extending the fall from March high at 1.6151.
So the question is, if we're going to sell Euro, which currency would we choose. As we have GBP/CHF already, we'll avoid Swiss Franc. Sterling is itself rather bearish and EUR/GBP is struggling in range. So the pound is out of question. Dollar could be a good candidate, if not for reversal in treasury yield. Thus, there could be more Chinese intervention in USD/CNH. So we'd avoid Dollar. Australian Dollar looked resilient and EUR/AUD is now near term bearish. But remember that Chinese stocks are in serious down trend. They could eventually drag down Aussie. Hence, it's a "no" to AUD. Finally, we'll choose Yen over Canadian Dollar. Firstly, JGB yield stood tall after BoJ triggered volatility. Secondly, further weakness in oil price could hold back Loonie's strength. Hence, we'll sell EUR/JPY at market this week with a tight stop at 129.60, slightly above 129.52 minor resistance. 127.13 is the first target but we'd expect at least a test on 124.61 low.
EUR/JPY Weekly Outlook
The rebound to 131.13 last week was brief. EUR/JPY drops sharply since then, through 129.10 support to close at 128.62. The development revives the case that corrective rebound from 124.61 has completed with three waves up to 131.97. Initial bias stays on the downside this week for 127.13 support first. Decisive break there will bring retest of 124.61 low. On the upside, above 129.52 minor resistance will turn intraday bias neutral first. But near term outlook will remain cautiously bearish as long as 131.13 resistance holds.
In the bigger picture, for now, EUR/JPY is still holding above 124.08 key support turned resistance. And the larger rise from 109.03 (2016 low) mildly in favor to resume. Break of 133.47 should send the cross through 137.49 high. However, decisive break of 124.08 will confirm medium term reversal and could then pave the way back to 109.03 low and below.
In the long term picture, at this point, EUR/JPY is staying in long term sideway pattern, established since 2000. Rise from 109.03 is seen as a leg inside the pattern. As long as 124.08 support holds, further rally is in favor in medium to long term through 149.76 high. However, break of 124.08 could extend the fall through 109.03 low instead.
Summary 8/6 – 8/10
Monday, Aug 6, 2018
[php_everywhere instance="1"]
Tuesday, Aug 7, 2018
[php_everywhere instance="2"]
Wednesday, Aug 8 2018
[php_everywhere instance="3"]
Thursday, Aug 9, 2018
[php_everywhere instance="4"]
Friday, Aug 10, 2018
[php_everywhere instance="5"]
Weekly Economic and Financial Commentary: Data Keep Fed on Track for September Rate Hike
U.S. Review
Data Keep Fed on Track for September Rate Hike
- The Employment Cost Index rose to its highest year-over-year pace of the expansion in Q2, signaling rising labor costs.
- The ISM manufacturing index cooled slightly in July but remained firmly in expansion territory despite recent swirling trade war concerns.
- Nonfarm payrolls were below expectations at 157,000 new jobs in July, but upward revisions to the previous two months softened the blow.
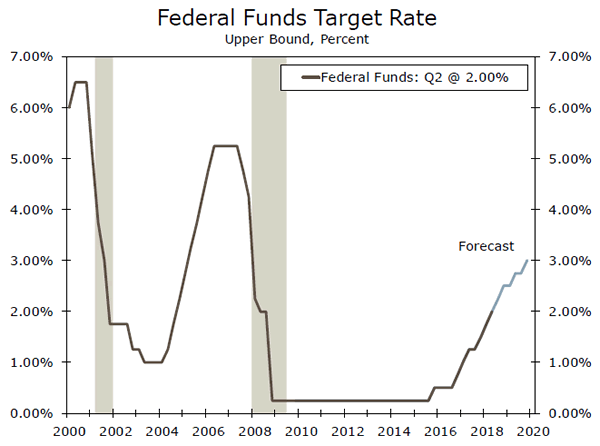
- Against this domestic backdrop, the Fed elected to remain on hold at its August meeting. We continue to expect the Fed to hike rates twice more this year in September and December.
Data Keep Fed on Track for September Rate Hike
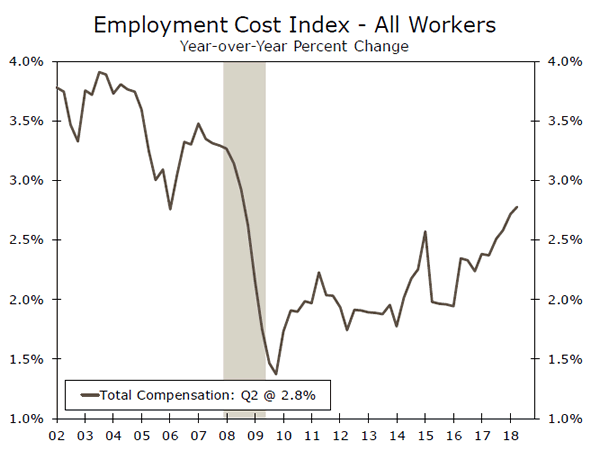
The U.S. economic data this week were broadly consistent with a domestic economy that is grinding toward an output gap that is positive rather than negative. The Employment Cost Index rose to its highest year-over-year pace of the expansion in Q2 (top chart). Employment costs at private businesses have risen 2.9 percent amid a more rapid rise in wages and benefits. Public sector costs have been more subdued, however, as wage growth has slipped back under 2 percent. For all the hand-wringing over slow wage growth in the current cycle, there is a clear upward trend in compensation costs over the past few years (top chart). While total compensation growth remains below the previous cycle's peak, this make senses from a fundamental standpoint given lower levels of productivity growth and inflation.
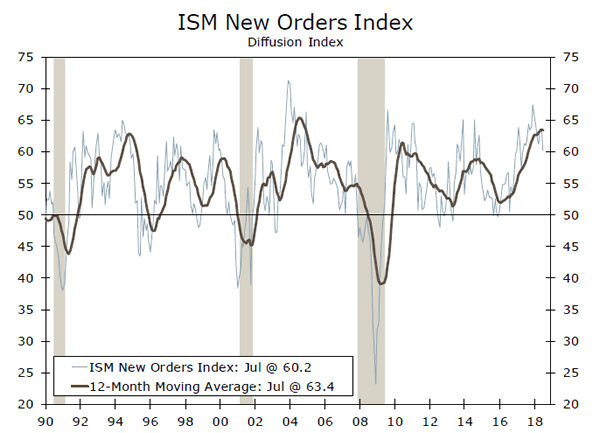
The ISM manufacturing index cooled a bit in July but remained firmly in expansion territory at 58.1. Most sub-indices moderated over the month and, along with comments from respondents, hint that the recent trade environment has begun to impact activity. The current production component edged down, and new orders fell to the lowest level in a little over a year at 60.2 (middle chart). That said, orders and activity are still at fairly high levels, and the modest slowdown of late does not look problematic for the overall growth picture. Similarly, the consumer confidence index was only slightly down in June and July relative to May despite rampant headlines over the past two months about a possible trade war. Like the Fed, we will be watching the data closely to see if trade concerns begin to bear down more noticeably on broad activity.
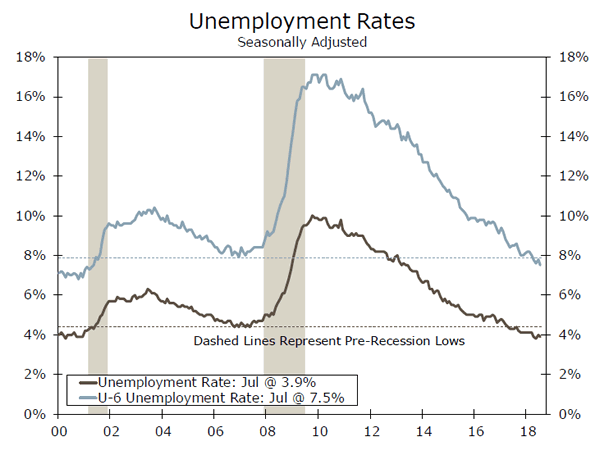
U.S. employment data for July were released this morning. Nonfarm payrolls growth disappointed with a 157,000 print, below the 193,000 Bloomberg consensus estimate. The net revisions over the previous two months were +59,000, however, softening the blow of the miss. Manufacturing payrolls were particularly strong, rising 37,000 in July, the fastest pace of 2018. The unemployment rate dipped to 3.9 percent, while average hourly earnings were unchanged at 2.7 percent year over year. One encouraging sign was the broader U-6 unemployment rate, which counts those working part-time for economic reasons and those who want a job but have stopped looking, reaching the lowest level since 2001 (see chart on front page).
Against this domestic backdrop, the Fed elected to remain on hold at its August meeting, which concluded this week. In our view, the FOMC upgraded its assessment of the economy compared to the statement that was released at the end of the last meeting in June. When describing growth, the FOMC upgraded its characterization of the pace of economic activity from "solid," which it used in the last policy statement, to "strong." Trade tensions continue to lurk in the background for the Fed, but with inflation more or less at target and economic growth proving robust, we believe the Fed will hike twice more this year in September and December (bottom chart). Still, with wage growth only slowly grinding higher and the core PCE deflator remaining just shy of target at 1.9 percent yearover- year through July, the impetus for the Fed to accelerate its tightening plans likely remains missing for the time being.
U.S. Outlook
Producer Prices • Thursday
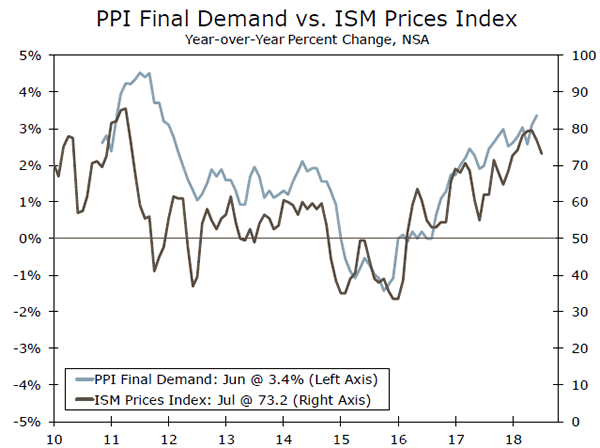
Producer price inflation has been strengthening over the past year, with the PPI up 3.4 percent year over year. A 50 percent rise in oil prices over the year has helped drive the gain, but PPI ex-food, energy, and trade services (measured by margins) has increased 2.7 percent from a year ago.
We expect PPI to rise 0.2 percent in July as domestic capacity constraints intensify and additional tariffs, which provide scope for U.S. producers to raise prices, take effect. Businesses report input prices rising broadly. The ISM manufacturing prices paid index came in above 70 for a seventh straight month, while the share of nonmanufacturers reporting higher prices also remains elevated. Rising material and labor costs for U.S. producers should push core PPI up further in the coming months.
Previous: 3.4% Wells Fargo: 3.4% Consensus: 3.4% (Year-over-Year)
Consumer Prices • Friday
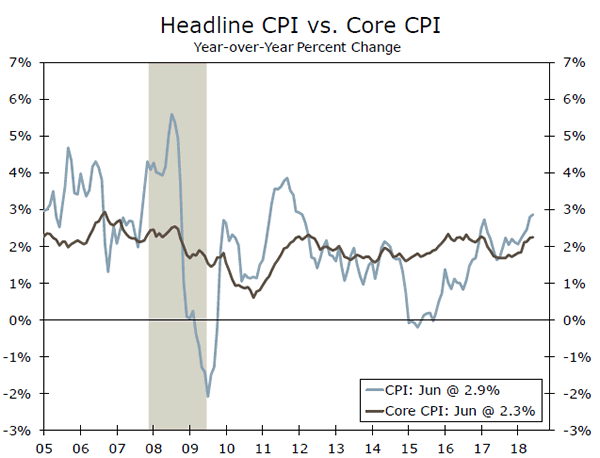
Consumer price inflation came in a touch softer than expected in June amid a pullback in energy prices and subdued increase in core services. We expect to see the CPI advance 0.2 percent in July, however, as gasoline prices fell less than usual for this time of year. That should keep headline CPI up 2.9 percent on a year-ago basis. We estimate the non-seasonally adjusted index rising to 252.238.
Core inflation is also expected rise, but will likely be closely in line with its recent trend and print a "low" o.2 percent. Last month the index was dragged down by a sharp drop in hotel costs, which is unlikely to be repeated to the same extent. Meanwhile, homeownership costs, which account for nearly a quarter of the CPI, show no signs of slowing. Prices for new and used autos are also firming up as inventories have come down over the past year.
Previous: 0.1% Wells Fargo: 0.2% Consensus: 0.2% (Month-over-Month)
Monthly Budget • Friday
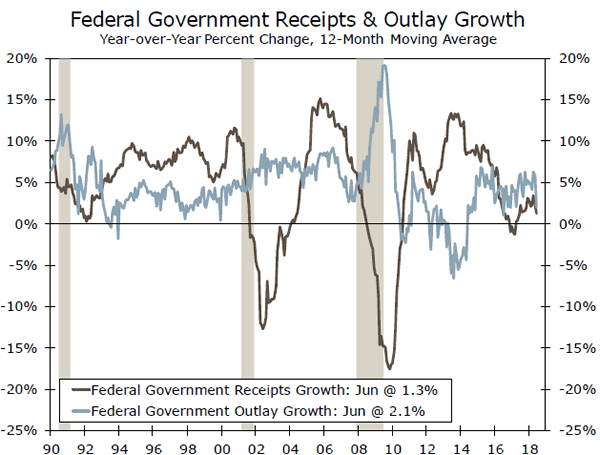
The federal budget posted a deficit of $75 billion in June. Despite the strongest four-quarter run in nominal GDP growth since 2006, federal receipts are up only 1.3 percent over the past year (on a 12-month moving average basis) as tax changes have led to a steep decline in corporate tax receipts. Individual tax receipts—up 16 percent fiscal year to date—however, have helped ease some pressure on the budget.
Thus far this fiscal year, the deficit is about $80 billion wider than last year, with one quarter still to go. Outlays from the budget deal reached in March are beginning to ramp up, and we expect the third quarter to be the near-term peak in the pace of government consumption and investment. With only three more months left in the fiscal year, that should propel the deficit toward $800 billion for the year as a whole.
Previous: -$74.9B
Global Review
Eurozone GDP Growth Slows Modestly in Q2
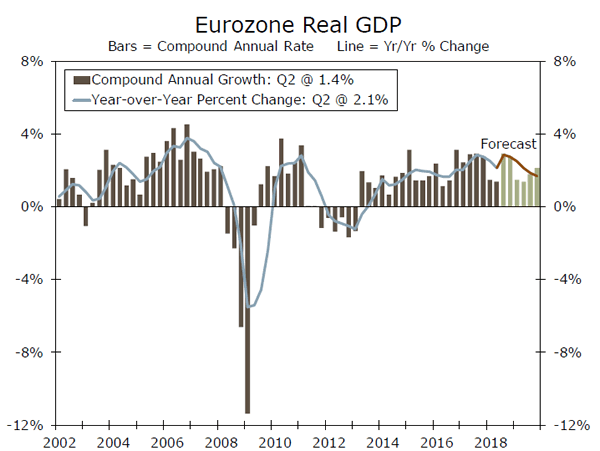
- Amid several international data releases this week, GDP growth in the Eurozone decelerated slightly to 2.1 percent (year over year). Although the Q2 print came in a bit below consensus estimates, we look for the expansion to remain intact, buoyed by gradually rising wages and a tight labor market.
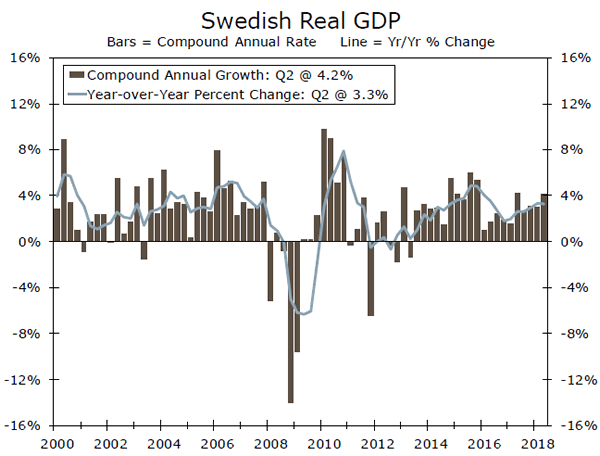
- Q2 GDP in Sweden remained strong, growing 3.3 percent year over year. Rising inflation looks to be supportive of gradual monetary policy normalization in coming quarters.
- Both the Bank of England and Reserve Bank of India raised rates this week, while the Bank of Japan remained firmly accommodative, making only minor policy adjustments.
Eurozone GDP Growth Slows Modestly in Q2
Several Q2 GDP releases and central bank announcements flooded the international arena this week. In the Eurozone, Q2 GDP growth fell a bit short from consensus expectations, and at 2.1 percent (year over year) represents a continued deceleration from the more rapid 2.8 percent rate registered in Q4-2017 (see chart on page 1). But the underlying economic expansion should remain intact. The manufacturing and consumer sectors were both likely solid performers in Q2, and along with gradually rising wages and a tight labor market should propel economic growth in coming quarters.
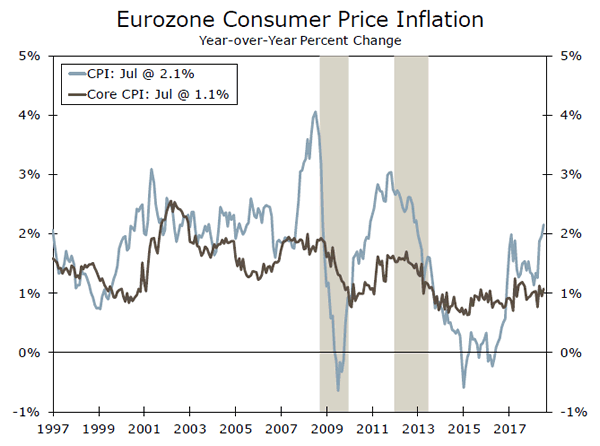
However, inflation remains lackluster and continues to restrain the removal of monetary policy accommodation on the part of the European Central Bank (ECB). While headline inflation has returned to the ECB's 2 percent target in recent months, core inflation remains stuck around 1 percent (top chart). We take the ECB at its word that it will end bond purchases by the end of this year. Assuming GDP growth and inflation continue to pick up, we look for the ECB to begin raising rates in early autumn 2019.
Elsewhere in Europe, real GDP in Sweden rose strongly in Q2, with the 3.3 percent year-over-year increase surpassing consensus estimates (middle chart). Inflation in Sweden has also picked up and looks to be supportive of the country's central bank gradually removing policy accommodation in the near future.
Monetary Policy Convergence Poised to Return in H2
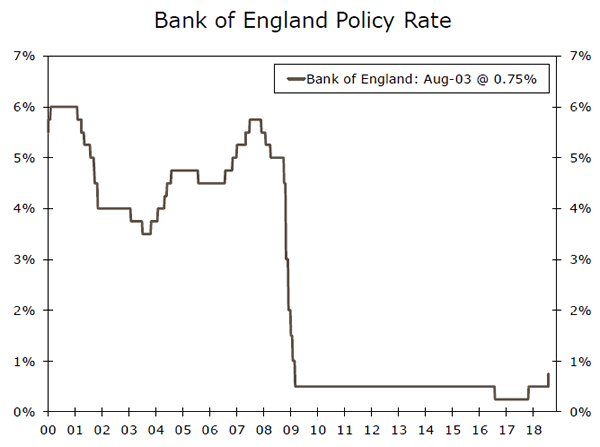
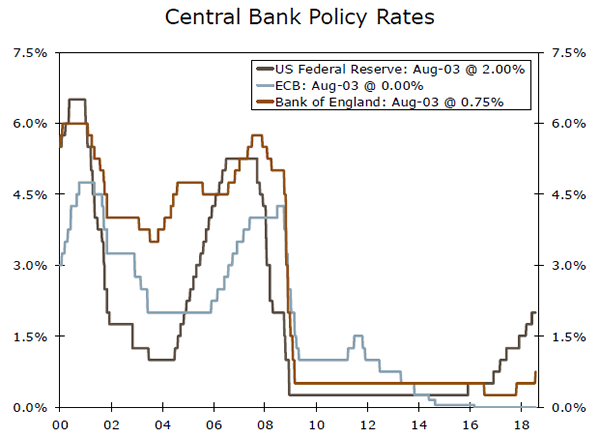
The trend toward global monetary policy convergence looks poised to pick back up in the second half of the year after pausing amid a slowdown in global growth in H1. The Bank of England (BoE) raised rates 25 bps after remaining on hold since November 2017 (bottom chart). While economic growth in the U.K. was slower than expected in Q1, the BoE characterized the deceleration as only temporary, and continued to state that "the economy has a very limited degree of slack." Inflation also remains above the BoE's 2 percent target in the wake of sterling depreciation following the Brexit Referendum in 2016. But the BoE looks for domestic cost pressures to pick up, while external factors pushing up prices should continue to subside. Although uncertainty surrounding Brexit negotiations has increased recently, the BoE remains of the view that sustained economic growth warrants further rate increases to support its inflation target. Assuming this occurs, we look for the BoE to continue to gradually tighten policy.
The Reserve Bank of India (RBI) also hiked two of its main policy rates 25 bps each at its meeting this week. Inflation reached 5 percent in June, and the RBI also noted a significant rise in core inflation, which, along with solid economic growth, positions the RBI to raise rates further in coming quarters.
While the BoE and RBI raised rates, the Bank of Japan (BoJ) remains a laggard. Although the BoJ made minor adjustments at its meeting this week to allow a greater degree of variation around its 10-year government bond yield target, its monetary policy remains highly accommodative. Given continued low inflation and downward revisions to its inflation forecasts this week, we look for the BoJ to maintain its policy stance for the foreseeable future.
Global Outlook
Japanese GDP Growth • Thursday
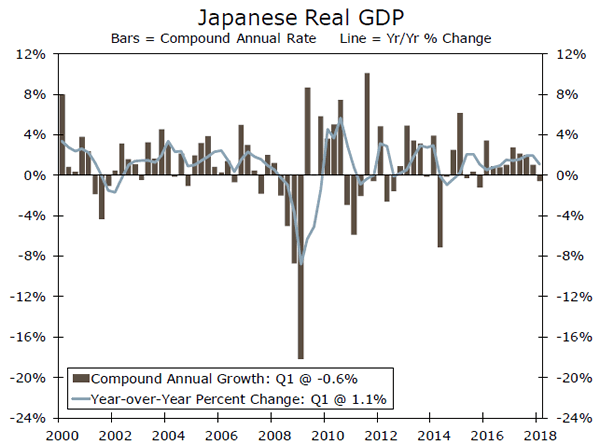
Real GDP in Japan edged down 0.6 percent (annualized rate) in Q1-2018, the first contraction on a sequential basis in more than two years. Most analysts, ourselves included, look for output to have bounced back in the second quarter. Industrial production jumped 2.0 percent (not annualized) in the first two months of Q2 relative to the first quarter, and the nominal value of retail spending climbed 0.4 percent in the second quarter on a sequential basis. In our view, the mild contraction in real GDP in the first quarter was an aberration rather than the start of a trend.
That said, we do not look for explosive Japanese economic growth anytime soon. Some market participants had speculated that the Bank of Japan would signal at its policy meeting this week that it was prepared to dial back policy accommodation. In the event, the BoJ decided to continue targeting the long end of the yield curve because inflationary pressure still remains dormant.
Previous: -0.6% Wells Fargo: 1.5% Consensus: 1.3% (SAAR)
U.K. GDP Growth • Friday
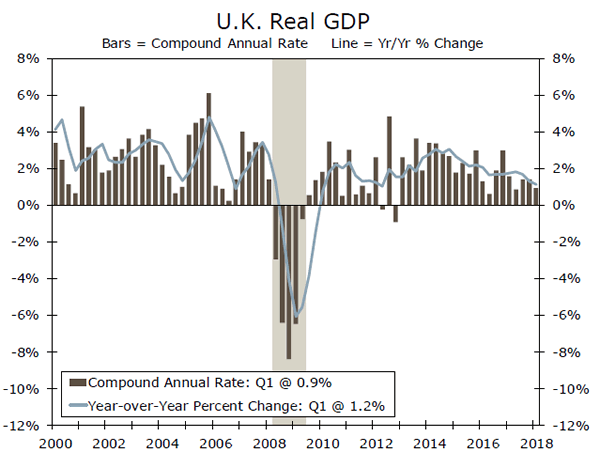
U.K. real GDP rose at an anemic rate of only 0.2 percent (0.9 percent annualized) in the first quarter. Data that are slated for release on Friday should show that GDP growth strengthened in the second quarter. Although the U.K. economy probably accelerated in the recently completed quarter, growth likely will remain generally sluggish until some of the Brexit-related uncertainty is cleared up. With no resolution of the eventual trading relationship between the United Kingdom and the rest of the European Union on the horizon, we forecast that British economic growth likely will remained muted.
Although the GDP release should be the highlight of the week, June data on industrial production, construction output and the trade balance should add some further insights into the current state of the British economy.
Previous: 0.2% Wells Fargo: 0.4% Consensus: 0.4% (Not Annualized)
Canadian Employment • Friday
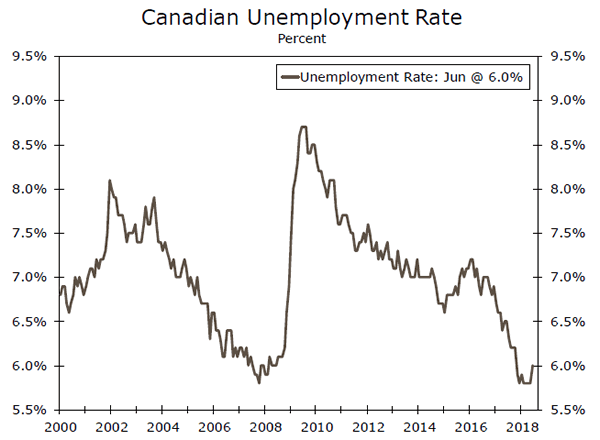
Canadian employment rose by 31.8K workers in June. Because the population of the United States is about ten times as large as Canada's, the rise in Canadian non-farm payrolls in June is equivalent to a very strong gain of roughly 300K workers in the United States. Canadian employment is inherently volatile on a monthly basis, so the unemployment rate, which is not quite as volatile, may be a better way to measure the underlying state of the Canadian labor market. In that regard, the current rate of 6.0 percent is near the lowest rate in more than 40 years. In short, the Canadian labor market is tight at present.
The Bank of Canada (BoC) raised its main policy rate 25 bps at its last policy meeting on July 11. In our view, there is a low probability that the BoC will hike rates again at its next policy meeting in September, but we forecast that it will pull the trigger again at one of its two meetings in the fourth quarter.
Previous: 31.8K
Point of View
Interest Rate Watch
Gradual Remains The Key Phrase
This past week's FOMC meeting contained few surprises, and the Fed remains on track to boost interest rates another quarter percentage point in September. The policy statement that followed the meeting contained only a couple of notable changes. Household spending and business investment are now noted to have grown "strongly" during the first half of the year rather than solidly. You would expect nothing less than that, given that the advance estimate of real GDP showed the economy growing at a 4.1 percent annual rate. Apparently, 2 to 3 percent growth is considered solid.
The other notable change has to do with inflation, with the policy statement noting that on a 12-month change basis, both overall and core inflation data remain "near" 2 percent. The message here is that the Fed is not likely to ramp up the pace of tightening from its current gradual pace even if the inflation numbers rise a little above 2 percent for a while. Chairman Powell and several other Fed officials have often noted than inflation has been below the 2 percent target for many years and that a short-term rise above that level should not be all that troubling.
Beyond September, we see the Fed nudging the federal funds rate up another quarter point in December. While another hike seems fairly certain, it could possibly be undone if the economy were to suddenly lose momentum. We view that as unlikely, however, and have real GDP rising at better than a 3 percent pace during H2-2018.
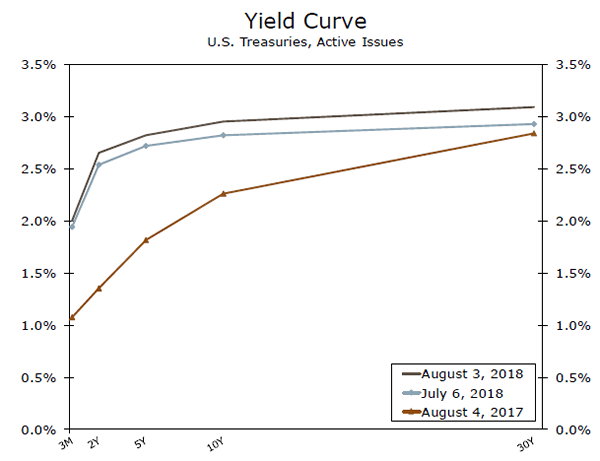
The yield curve flattened slightly following the smaller-than-expected rise in July nonfarm payrolls. The smaller gain suggests economic growth is moderating, but not so much that it will cause the Fed to put off raising the federal funds rate target in September and December.
The yield on the 10-Year Treasury briefly reached 3 percent this week, pushed higher by concerns that the Treasury will need to borrow significantly more money during the second half of the year to finance larger budget deficits. The Treasury remains reluctant to push more bond issuance into long-term maturities, however, which is keeping the yield curve relatively flat.
Credit Market Insights
Growing Concern Over Farm Loans
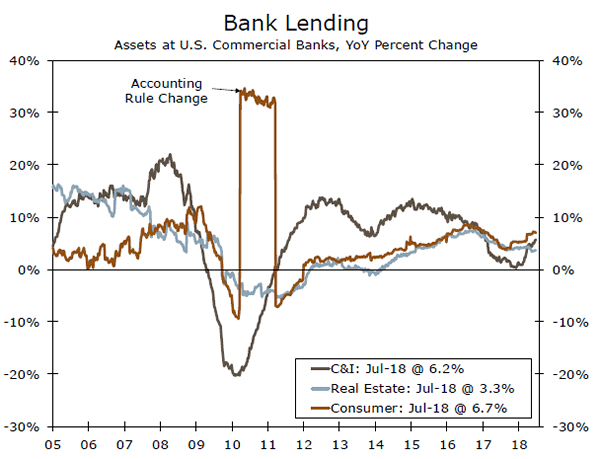
Agriculture prices have suffered in recent years, as global commodity prices collapsed. The USDA crop prices index increased in 2017 and so far in 2018, but remains 15 percent below its 2012 average after four consecutive years of lower prices. Declining commodity prices had been one factor holding back headline inflation, which only reached the Fed's 2 percent target this year. Another less-widely discussed impact has been on farm credit.
The USDA forecasts net farm income to reach a 12-year low in 2018, largely due to low commodity prices. As farms bring in less revenue, more are using loans to cover costs. As of Q2, farm loan volume increased 2.3 percent from a year ago and more than 8 percent from the previous quarter, largely driven by loans for operational expenses.
An area of potential concern, given lower farm incomes and higher farm loan volumes, is rising interest rates. Loan repayment rates have continued to decrease, largely due to higher interest rates, according to the Kansas City Fed Databook. The USDA forecasts crop prices to increase in 2018 and 2019, which should help farms on the revenue side. However, tariffs have recently pushed down prices for some crops, including soybeans. Relief may still be some ways off.
Farm loans make up less than 2 percent of all commercial bank loans. Thus, concern over farm credit does not weigh heavily on the overall health of the credit market, but may have larger regional impacts.
Topic of the Week
The Low-Skill Labor Crunch
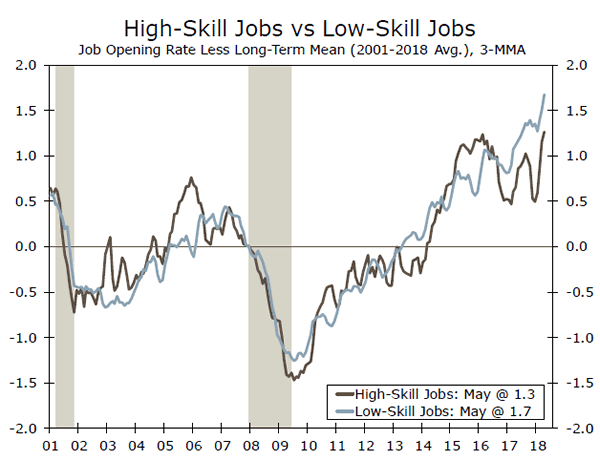
Though employment growth slowed in July, the trend remains solid and is fast enough to continue lowering the unemployment rate. As of May, there is less than one unemployed worker per job opening. The NFIB small business survey reported 37 percent of firms claiming hard to fill job openings as their most important problem.
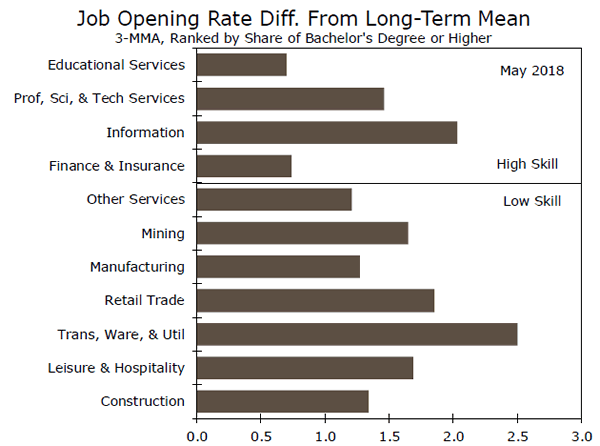
To understand where labor shortages are being felt most acutely, we calculate an adjusted job opening rate for each industry. We subtract the long-term mean from each opening rate to control for the fact that "natural" opening rates vary by industry. While we recognize that education does not necessarily equate to skill, for the purposes of this analysis, we classify sectors into "lower-skill" and "higher-skill" using the share of employees with a bachelor's degree as a proxy.
The adjusted job opening rates for lower-skill and higherskill industries are at all-time highs (top chart). However, the labor market for lower-skill jobs looks to be tightest. The lower-skill adjusted job opening rate has continuously trended upward in recent years, and the highest industry-specific rates are clustered in the lowerskill category (bottom chart). The transportation, warehousing & utilities sector stands out for having the highest adjusted rate, while openings in the retail sector are also elevated. Higher-skill jobs are not immune from worker shortages, however; openings in the information industry are particularly high.
Low wages may be discouraging workers from pursuing careers in fields with some of the highest opening rates. Average hourly earnings in transportation & warehousing and retail trade are below the national average, and wage growth has also lagged. In addition, lower labor force participation rates for workers with less education may be exacerbating labor shortages in lower-skill industries.
We expect the unemployment rate to continue its downward trend as hiring outpaces labor force growth. Employers are likely to continue to ease job requirements and increase wages and benefits to address difficulties.
The Weekly Bottom Line: Canada – Solid Growth Raises Odds of October Rate Hike
U.S. Highlights
- The U.S. economy generated solid job growth in July with payrolls expanding by 157k (170k private). The unemployment rate edged down to 3.9% (from 4.0%) and the core (25-54) labor force participation rate moved higher.
- Tariff concerns were once again in the spotlight. While the U.S. and EU called a truce, the battle with China continued to rage with little end in sight.
- The Fed's decision to keep rates unchanged this week was just as markets expected. With above-trend growth likely to continue, a September rate hike is all but a foregone conclusion.
Canadian Highlights
- The Canadian economy grew by a robust 0.5% in May. The gain was broad-based, with goods-producing industries up 0.6% and services up 0.5%. Overall, 19 of 20 major industries expanded in the month.
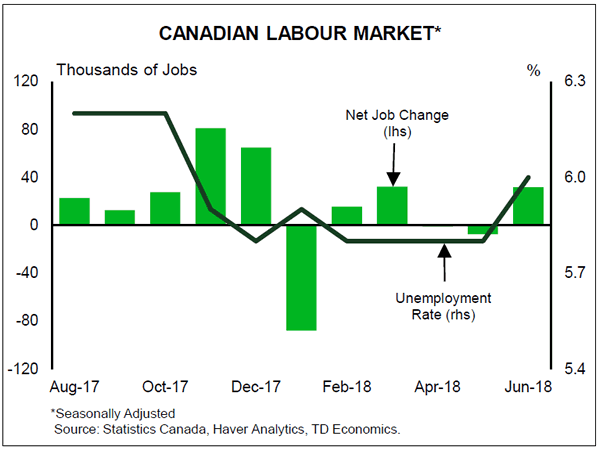
- Economic resilience was further evidenced in the trade data for June, which showed a strong rebound in export growth (2.1% in volume terms) and pullback in imports (-1.3%).
- Preliminary home sales data for the Toronto and Vancouver markets showed growth in the former and some signs of stabilization in the latter. Existing home sales were up 19% year-on-year in the GTA (up from 1.4% in June). Sales were down 30% (y/y) in the GVA – still an improvement from the 38% decline in June.
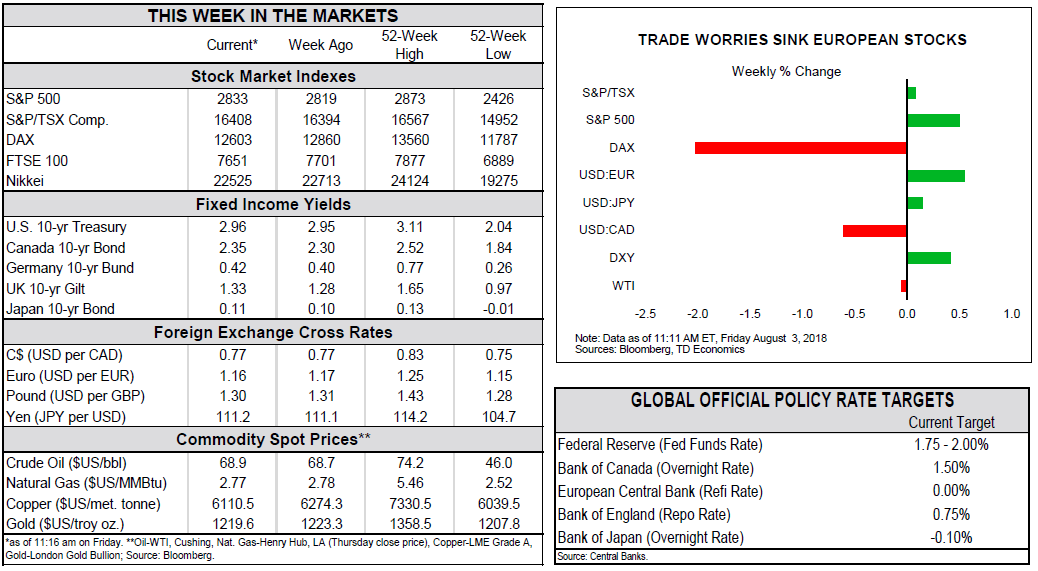
U.S. - Red Hot Job Market, Lukewarm Wage Gains
The US economic calendar was jam packed this week. Front and center was the labor market data, which showed a payroll gain of 157k in July, somewhat below the consensus forecast, but still healthy.
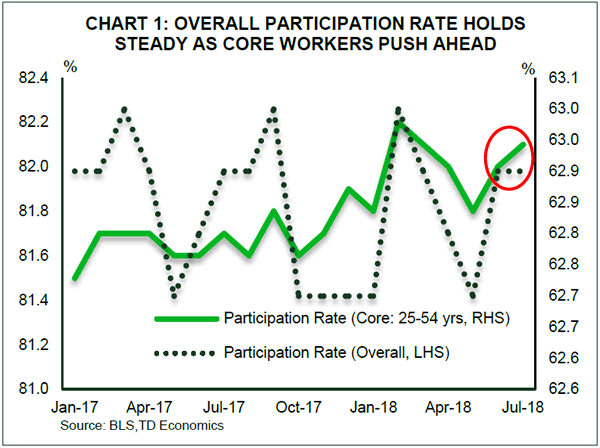
Of note, the unemployment rate came in a touch lower (3.9% from 4.0% last month). The overall labor force participation rate remained unchanged, but the rate for core aged workers (25-54yrs) edged up (Chart 1). There were also upward revisions to the employment numbers for both May and June – further evidence of a strong job market. Overall, these dynamics suggest that the booming labor market is drawing more Americans off the sideline and into the job mix.
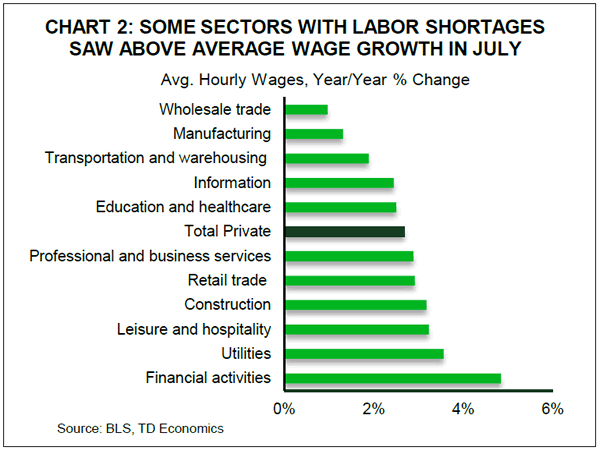
Despite the strength of the labor market, wages show little sign of accelerating. Average hourly earnings were up 2.7% (y/y) in July, unchanged from June. The lackluster performance of wage growth in the face of near-record-low unemployment and increased reporting of worker shortages is a bit of a puzzle, but it may be turning a corner. Several industries most affected by the short supply have posted above average wage gains (Chart 2).
Overall, the jobs report harkened back to the Fed's policy statement on Wednesday, which lauded the strength of both the labor market and overall economy. As expected, the FOMC kept the policy rate unchanged. Given the strength of the economic data thus far, a labor market at or near full employment, and core PCE inflation approaching the 2% target, we expect the Fed to continue to raise interest rates, with the next quarter point move in September.
On the trade front, the U.S. and EU have called a truce on further tariffs, but tensions with China continue to escalate. President Trump ratcheted up pressure this week, as his trade team received marching orders to assess the possibility of more than doubling the rate of proposed tariffs on China (from 10% to 25%). China has warned that such actions will not go unpunished and has vowed to retaliate in both scale and severity with measures of their own. In fact, the Chinese government has already announced $60bn worth of U.S. goods on which retaliatory tariffs would be applied.
The peace pact between the EU and U.S., along with strong employment numbers reduced demand for safe haven bonds this week. These developments, along with the announced increase in Treasury issuance caused 10-year Treasury yields to breach 3% mid-week. The looming trade tussle between the two economic heavyweights however (U.S. and China), ruffled the feathers of market participants, sending yields back below 3% by Friday.
The strength of the economic data has set the stage for a solid Q3 showing of around 3% (annualized), below Q2's 4.1% print, but still a very robust pace. The US economy is firing on all cylinders and, trade wars notwithstanding, appears well positioned to absorb further increases in interest rates.
Canada - Solid Growth Raises Odds of October Rate Hike
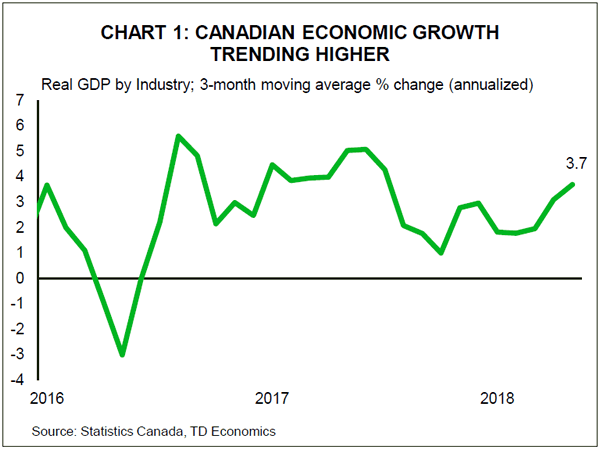
After a cold spell earlier in the year, Canada's economy is hot again. The economy grew by a robust 0.5% in May with support coming from 19 of 20 industries (utilities production fell on account of good weather).
The Canadian economy's resilience was further affirmed in the trade data for June, which showed a strong rebound in export growth (2.1% in volume terms) and pullback in import volumes (-1.3%). While falling imports can sometimes indicate flagging domestic demand, this was not the case in June. Rather, it was a giveback for the rise in petroleum imports in earlier months due to refinery shutdowns. The pullback reflected the resumption of normal activity.
Taken together, these data lend confidence to our forecast for second quarter real GDP growth to come in above 3.0%. This is even better than the 2.7% we had been forecasting in June, as well as the Bank of Canada's July forecast for 2.8%.
Market reaction has firmed expectations for the Bank of Canada to raise interest rates later this year. The odds of a rate hike in October sit at 75% as of writing, corresponding to Canadian government bond yields moving up by about 20 basis points across maturities this week.
In terms of the key questions facing the Canadian economy, the trade report for June – the first full month that tariffs were implemented – showed the impact of steel and aluminum tariffs. Canadian exports of steel to the United States fell 37% (m/m), while aluminum exports fell 7%. Encouragingly, these declines were swamped by growth elsewhere. So long as tariffs remain contained to steel and aluminum, the Canadian economy should escape relatively unscathed.
The other key question for Canada's economy is, of course, the fate of the Canadian housing market. Early data for the month of July reported this week was mixed, but overall suggest that the worst of the housing correction is in the rear-view mirror. In the GTA, home sales were up 6.6% in July, leaving the sales to listings ratio above 50, up from a trough of 44 in March, while average prices rose 3.1% (m/m). In the GVA, meanwhile, sales appear to have edged up slightly (m/m, seasonally adjusted), but growth in quality-adjusted home prices (the only reported metric) slowed to its softest pace since 2015.
All told, there are still some soft spots on the landscape, and temporary factors appear likely to return in the third quarter (shutdowns in the Alberta oil patch). Still, for the year as a whole, the Canadian economy looks to maintain above-trend growth. With inflation above 2% and unemployment close to a historical nadir, the case for continued increases in interest rates remains solid. The question is less a matter of if and more of when. The Bank of Canada will surely be watching the trend in Canadian employment and wage growth next week. Should labour market indicators continue to run hot, the chance of an earlier rate hike will cement itself.
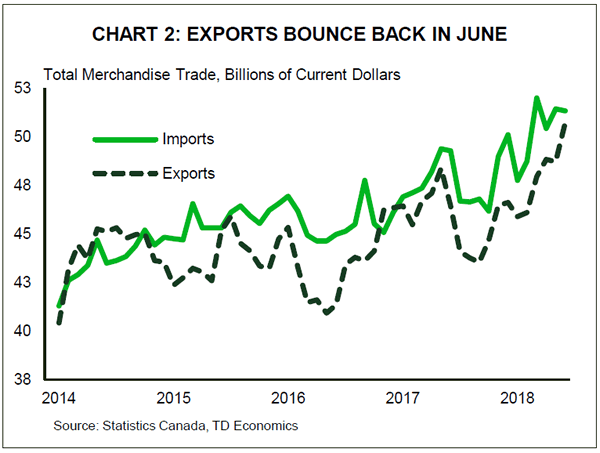
U.S.: Upcoming Key Economic Releases
U.S. Consumer Price Index - July
Release Date: August 10, 2018
Previous: 0.1% m/m, core 0.2% m/m
TD Forecast: 0.2% m/m, core 0.2% m/m
Consensus: 0.2% m/m, core 0.2% m/m
We expect CPI to hit 3.0% y/y, with core inflation rising to 2.3% on a firm 0.2% m/m increase. Weakness in gasoline and food prices should be offset by strength in the core, underpinned by a pickup in core goods prices and resilience in shelter costs.
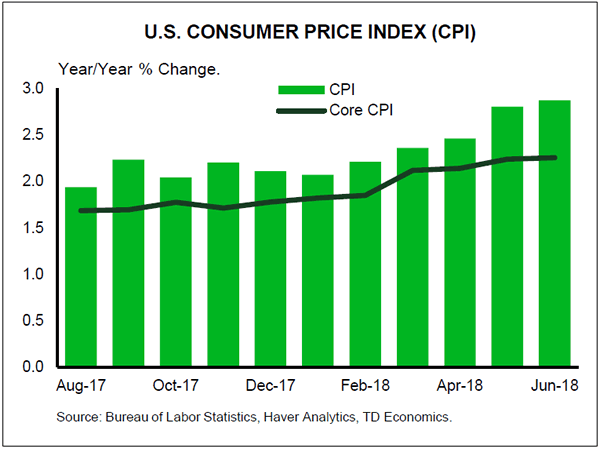
Canada: Upcoming Key Economic Releases
Canadian Housing Starts - July
Release Date: August 9, 2018
Previous: 248k
TD Forecast: 230k
Consensus: N/A
We look for housing starts to cool to a 230k pace in July on a pullback in multi-unit construction. Multi-unit housing starts surged by 46% in June, a move that is unlikely to be sustained despite a steady trend higher in permit issuance. On a regional basis, Toronto should see a sharp slowdown, but there is scope for a partial recovery in Vancouver where construction has slowed to its weakest pace since 2016. Single family starts should see little change, allowing the more volatile multi-unit component to drive the headline print.
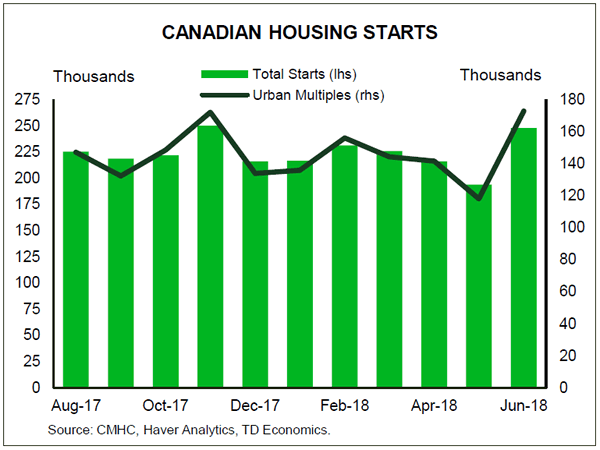
Canadian Employment - July
Release Date: August 10, 2018
Previous: 32k, unemployment rate: 6.0%
TD Forecast: 20k, unemployment rate: 5.9%
Consensus: N/A
We expect the economy to add 20k jobs in July on a rebound in private sector employment after two consecutive months in decline. Full time positions should lead job growth to lend an upbeat tone to the report after underperforming part time by roughly 60k since March. We also look for labour force growth to moderate from June, which should allow the unemployment rate to edge lower to 5.9%. Lastly, wage growth for permanent employees is likely to push higher to 3.6% y/y on a rebound in monthly earnings.
US Dollar Takes NFP Hit But Ends Up Higher on the Week
The US dollar fell on Friday after the U.S. non farm payrolls (NFP) came in below expectations with only a gain of 157,000 but otherwise the unemployment rate dropped to 3.9 percent and wage growth remained unchanged at 0.3 percent. The greenback is still higher against most majors on a weekly basis. The past five trading days featured central banks and influential economic indicators, but the guiding factor remains the trade tensions between China and the United States. On Friday China announced its preparing new tariffs on $60 billion US goods as retaliation on the ongoing trade spat. The week that kicks off on August 6 will be more subdued from the economic calendar with the central banks of Australia and New Zealand publishing their officials rates. The UK’s gross domestic product, Canadian jobs data and US inflation will wrap up the week on Friday, August 10.
- RBA and RBNZ expected to keep rates unchanged
- UK quarterly GDP forecasted to gain 0.4 percent
- US inflation advancing at 0.2 percent
Dollar Rises Guided by Geopolitics
The EUR/USD lost 0.61 percent in the last five days. The single currency is trading at 1.1582 after the EUR rose 0.10 percent on Friday but is far from recouping the gains of the USD during the week. The euro rose on a tight rangebound session despite overcoming weak retail sales and was helped by the lower than expected jobs report. The currency pair was mostly guided by geopolitics and the U.S. Federal Reserve meeting on Wednesday. Trade tensions have escalated on the US-China front with the US central bank staying put on rates, but giving an optimistic view on the economy.
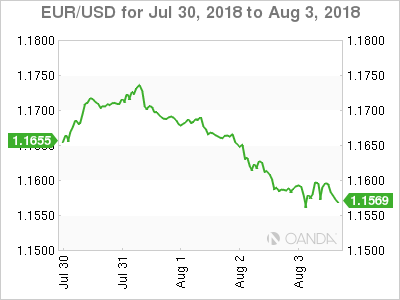
The US central bank is expected to continue with its plans to lift interest rates two more times in 2018. The jobs report brought less jobs than expected but still managed to add enough jobs to bring the unemployment rate down to 3.9 percent. There are concerns that the employment numbers will take a hit as trade war decisions trickle down but for now the outlook for American jobs is solid.
Inflation pressures remains low as despite a lower unemployment and high participation rate wages have not caught up to other costs. Labour shortages have not been widespread enough to trigger an above inflation rise in pay.
The positive employment data and the impressive growth of the economy in the second quarter validate the Fed’s decision to raise rates twice so far in 2018 and to continue on the path for two more rate hikes. The CME FedWatch tool shows a 93.6 percent of a chance of a hike in September 26.
The week of August 6 to August 10 will not bring the same economic calendar fireworks compared to the first week of the month. The highlights will be the Reserve Bank of New Zealand (RBNZ) and the Reserve Bank of Australia (RBA) with rate announcements that will likely end up with no change leaving investors to look for words from central bankers and monetary policy language for guidance.
The consumer price index on Friday will shed more light on inflation in America.
BoE Dovish Hike Sinks Pound
The GBP/USD fell 0.79 percent during the week. Cable is trading at 1.3004 wit the pound rising slightly on Friday. The Bank of England (BoE) hiked its benchmark rate on Super Thursday, but it was the cautionary words of BoE Governor Mark Carney that ultimately took the currency lower. The actions of the central bank were hawkish, by delivering the second rate hikes since the crisis, but Brexit looms over the monetary policy decision as hard Brexit scenarios have increased in probability.
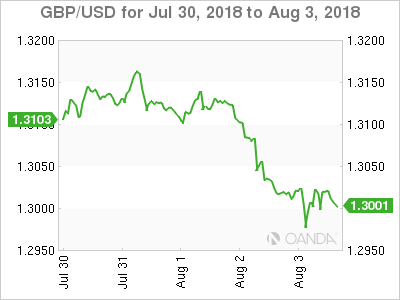
The decision of the Bank of England (BoE) was unanimous, but given the fragile state of Prime Minister May’s leadership as she heads into the final 8 months of Brexit negotiations, it could end up being the only pro-active decision by the central bank in 2018 as it heads into reactive territory.
Loonie Higher on Strong Data and NAFTA Hope
The USD/CAD lost 0.58 percent during the week. The currency pair is trading at 1.2983 after strong Canadian trade data added more arguments for a Bank of Canada (BoC) rate hike. Canada’s deficit shrunk to $626 million in June. The monthly GDP numbers released on Tuesday by beating estimates with a 0.5 percent gain.
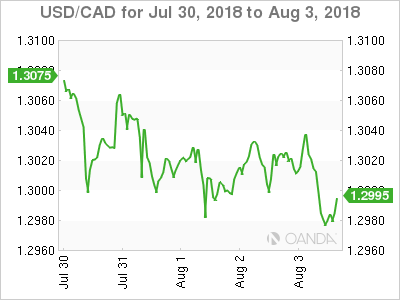
The Bank of Canada (BoC) lifted interest rates by 25 basis points on July 11 and a strong GDP report and a narrower trade deficit the probability of a follow up in 2018 has risen. Bank of Nova Scotia is forecasting 2 more rate hikes despite the uncertain outcome on NAFTA. The BoC will try to keep the gap between the Fed funds rate and the Canadian rate as much as the economy will allow. The U.S. Federal Reserve is expected to hike in September and again in December to deliver the promised four interest rate hikes in their path to normalization.
Mexican Peso Rose as US Jobs Missed Expectations
The USD/MXN depreciated on a weekly basis and is trading at 18.5574 on Friday afternoon. The currency pair had a volatile week trading in a tight range. The highest point came as trade fears triggered a flight to safety in which investors bought dollars. The talks on Thursday and Friday between US and Mexican negotiators are keeping NAFTA hope alive and with he soft employment numbers in the US the MXN appreciated.
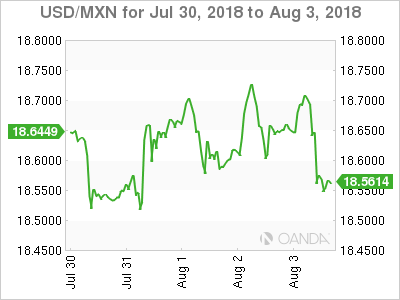
NAFTA negotiations have advanced in recent weeks as the newly elected Mexican president has been optimistic a quick deal can be reached. Mexican Trade teams are in Washington to talk with the US Trade representative, but the US did not extend an invitation to Canada to join the meetings.
The US team is sticking to the sunset cause and the auto content but there is more willingness to negotiate in bilateral terms, although Mexico has made it clear that it won’t negotiate without Canada being present.
Market events to watch this week:
Tuesday, August 7
- 12:30am AUD RBA Rate Statement
- 11:00pm NZD Inflation Expectations q/q
- 11:05pm AUD RBA Gov Lowe Speaks
Wednesday, August 8
- 10:30am USD Crude Oil Inventories
- 5:00pm NZD Official Cash Rate
- 6:00pm NZD RBNZ Press Conference
Thursday, August 9
- 8:30am USD PPI m/m
- 9:30pm AUD RBA Monetary Policy Statement
Friday, August 10
- 4:30am GBP GDP m/m
- 4:30am GBP Manufacturing Production m/m
- 4:30am BP Prelim GDP q/q
- 8:30am CAD Employment Change
- 8:30am CAD Unemployment Rate
- 8:30am USD CPI m/m
- 8:30am USD Core CPI m/m
*All times EDT
Kudlow: China is increasingly isolated with a weak economy
White House's National Economic Council head Larry Kudlow warned China that "they better not underestimate the president," and Trump is "going to stand tough" on trade war.
He added that "we are coming together with the European Union to make a deal with them, so we'll have a united front against China and, I think, most of our trade team would tell you, we're moving close on Mexico." So, "China is increasingly isolated with a weak economy."
Regarding the trade negotiations with the EU, he said "we will have a number of announcements coming up, I hope, in the next thirty or so days with respect to transactions and market opening and increased investments with the European Union."