

Sample Category Title
Export Surge Narrows Canada’s Goods Trade Deficit to $626 Million in June
Canada's goods trade deficit narrowed much more than expected in June to $626 million from a slightly revised $2.7bn in May (previously $2.8bn). Exports rose broadly by 4.1% to $50.7 billion, driven higher by energy products, aircraft and other transportation equipment and parts. In contrast, imports fell slightly by 0.2% to $51.3bn, owing to large declines in energy imports and in aircraft and other transportation equipment and parts.
In real or volume terms, exports rose 2.1% while imports contracted 1.3% in June. For the second quarter, export volumes rose 3.8% while import volumes rose 1.7%.
Energy exports increased 7.1% to $9.9bn in June, the highest level since October 2014. This was driven by crude oil exports largely on the strength of prices.
The decline in imports was largely due to temporary factors unwinding. Imports of energy products in June declined dramatically (-15.1%) as a resumption of operations for a number of Canadian refineries that had temporarily shutdown in April and May, and therefore reduced the need for imported fuels.
Canada's merchandise trade surplus with the U.S. widened to $4.1bn in June from $3.3bn in May, owing to a 2.5% increase in exports outpacing a 0.3% rise in imports.
Key Implications
This report wraps up a solid quarter for Canadian trade. After a flat start to the year, goods exports are set to contribute strongly to GDP growth in the second quarter, which is tracking modestly above 3.0%. That said, steel and aluminum tariffs may have already taken a bite out of Canadian exports to the U.S. in June, as evidenced by roughly a 37% decline in steel exports and a 7% decline in aluminum (unadjusted for seasonality), after recording significant growth from January through May.
June was the first full month for which Canadian exporters had to deal with U.S. tariffs on aluminum and steel targeting about $16.6 billion in annual goods exports. The majority (90-95%) of Canadian and aluminum and steel exports go to the U.S. Canada is the largest steel supplier to the U.S. market (14% share in 2017), and Canadian aluminum producers supplied more than 40% of foreign aluminum demanded by the U.S. market. Thus far, the tariffs appear to be reducing Canadian exports to the U.S., and will likely serve to raise the cost of imported steel and aluminum for U.S. manufacturers with little relief in sight.
Recent news of a progress between Mexico and the U.S. on auto content rules is encouraging, but the reality is that NAFTA negotiations are unlikely to be concluded in the near-term. As such, trade policy uncertainty is likely to continue to dampen the domestic and global outlook for business investment, particularly as the U.S. continues to threaten to escalate tariffs on Chinese goods, many of which are critical to the global supply chain.
USD/JPY Mid-Day Outlook
Daily Pivots: (S1) 111.40; (P) 111.57; (R1) 111.83; More...
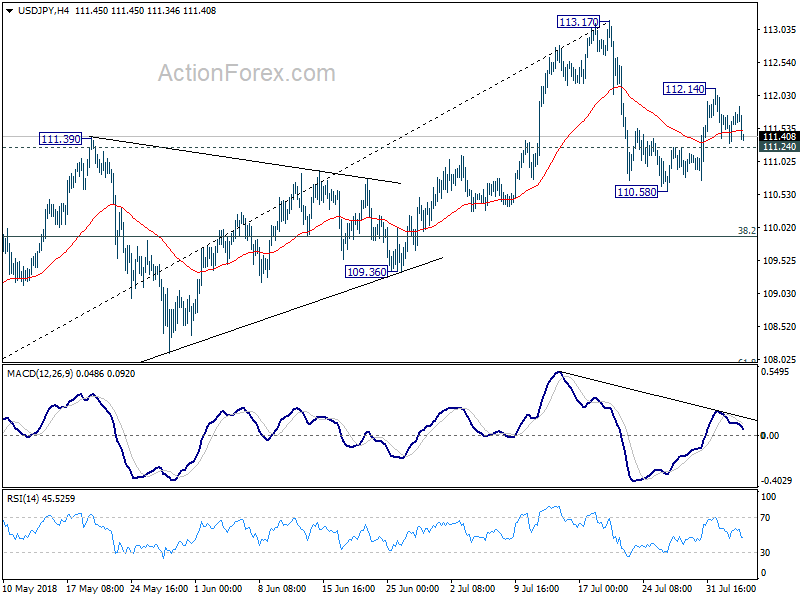
USD/JPY is staying in tight range of 111.24/112.14 and intraday bias remains neutral for the moment. With 111.24 minor support intact, further rise is still mildly in favor. Above 112.14 will target 113.17 resistance next. Firm break there will resume larger rally from 104.62 for 114.73 key resistance next. On the downside, below 111.24 minor support might extend the corrective fall from 113.17 with another decline. But downside should be contained by 38.2% retracement of 104.62 to 113.17 at 109.90 to bring rebound.
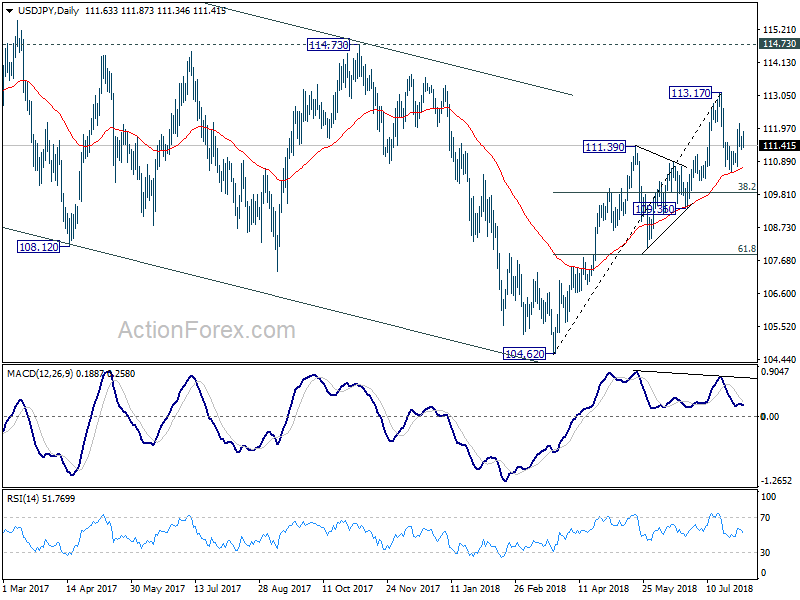
In the bigger picture, corrective fall from 118.65 (2016 high) should have completed with three waves down to 104.62. Decisive break of 114.73 resistance will likely resume whole rally from 98.97 (2016 low) to 100% projection of 98.97 to 118.65 from 104.62 at 124.30, which is reasonably close to 125.85 (2015 high). This will stay as the preferred case as long as 109.36 support holds.
USD/CHF Mid-Day Outlook
Daily Pivots: (S1) 0.9927; (P) 0.9942; (R1) 0.9970; More...
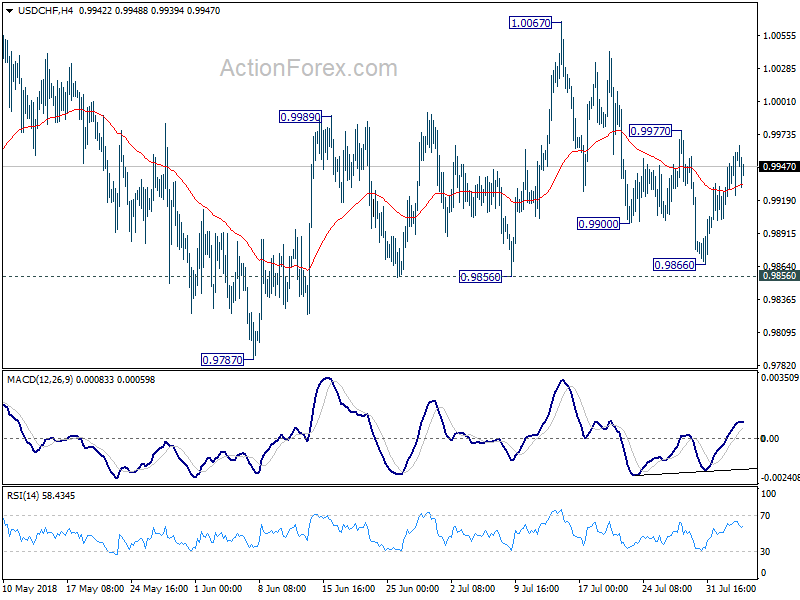
At this point, USD/CHF is still limited below 0.9977 minor resistance. Intraday bias stays neutral first. On the upside, break of 0.9977 will suggest that the pull back from 1.0067 has completed. And that will bring retest of 1.0067 first. Decisive break there will resume larger rally from 0.9186. On the downside, below 0.9866 will extend the fall from 1.0067 through 0.9856 to 0.9787 support. As price actions from 1.0056 are seen as a corrective pattern, downside should be contained by 38.2% retracement of 0.9186 to 1.0056 at 0.9724 to bring rebound.
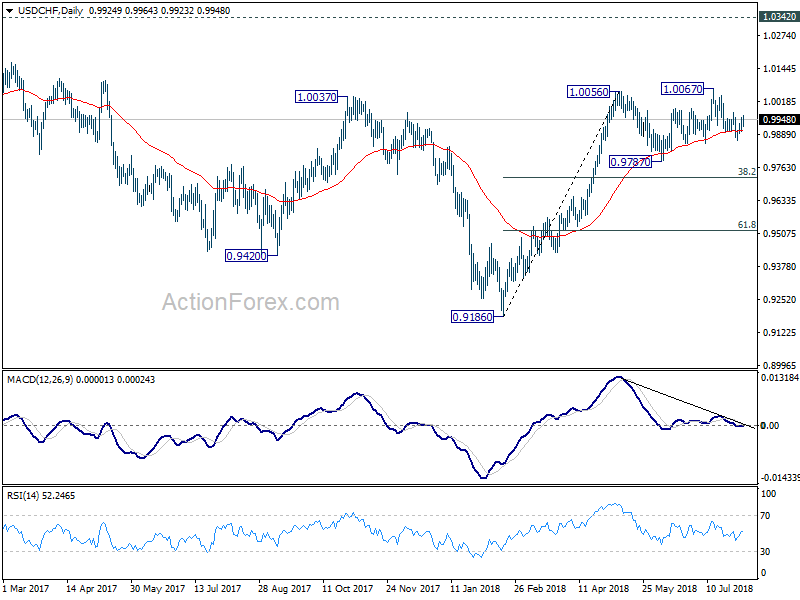
In the bigger picture, current development suggests that the consolidation pattern from 1.0056 is extending with another leg. As long as 38.2% retracement of 0.9186 to 1.0056 at 0.9724 holds, we'd expect rise from 0.9186 to resume at a later stage to retest 1.0342 key resistance (2016 high). However, sustained break of 0.9724 will bring deeper fall, as another declining leg in the long term range pattern.
GBP/USD Mid-Day Outlook
Daily Pivots: (S1) 1.2976; (P) 1.3054; (R1) 1.3093; More...
GBP/USD's fall from 1.3212 is still in progress and intraday bias remains on the downside for 1.2956 low. Decisive break there will resume larger decline from 1.4376 for 1.2874 fibonacci level next. On the upside, above 1.3064 minor resistance will possibly extend the correction from 1.2956 with another rebound through 1.3212. But even in that case, upside should be limited by 1.3362 resistance to bring larger decline resumption eventually.

In the bigger picture, whole medium term rebound from 1.1946 (2016 low) should have completed at 1.4376 already, after rejection from 55 month EMA (now at 1.4179). Fall from 1.4376 should extend to 61.8% retracement of 1.1946 (2016 low) to 1.4376 at 1.2874 next. Decisive break of 1.2874 will raise the chance of long term down trend resumption through 1.1946 low. On the upside, break of 1.3362 resistance is needed to be the first indication of medium term bottoming. Otherwise, outlook will remain bearish even in case of strong rebound.

US: Hiring Slowed in July, But Few Signs of Labor Market Weakness
U.S. non-farm payrolls rose 157k in July, below market expectations. However, the disappointment is mitigated by the fact that upward revisions added 59k new jobs to the previous two months results.
The unemployment rate edged back down to 3.9%. The labor force participation rate held on to its June gain, remaining at 62.9% in July.
Perhaps the most encouraging sign of labor market strength is that core working-age individuals continue to be drawn back into the labor force. The participation rate for core age workers (25-54 yrs) rose a tick to 82.1% in July, continuing the improving trend seen over the past three years.
July's hiring slowdown was concentrated in the services sector, which added 118k new jobs, down from 182k in June. Strength was seen in business services (+51k), and health care and social assistance (+34k), food services and drinking places (+26k), and even the retail sector managed a 7k job gain.
In comparison, goods sector hiring held up well in July, rising 52k positions. Manufacturing added 37k new jobs, continuing a steady string of gains. Construction added 19k positions, up from June, while mining lost 4k jobs.
Average hourly earnings rose 0.3% in July, as expected. On a year-on-year basis, growth in wages remained steady at 2.7%.
Key Implications
After a couple of very strong months for hiring, and the unemployment rate returning to its cycle low, there is really nothing to panic about in a slowdown in hiring. July marks the 94th month of consecutive job gains, the longest continuous stretch since records began. With such a hot job market over a long period, it is becoming increasingly difficult to find workers to fill positions, which would be expected to result in a natural slowing in monthly job gains.
A 3.9% unemployment rate, and a rise in labor force participation for core-aged individuals drives home the continued strength in the labor market. Monthly wage growth was on expectations, with the year-on-year growth rate staying steady at 2.7%. With continued improvement in the participation rate and wage gains not yet showing signs of acceleration, the Fed can continue to be patient in raising rates. We expect the Fed to continue its steady interest rate increases in September.
EURCAD Posts 2-Month Low, Looks Bearish in the Medium-Term
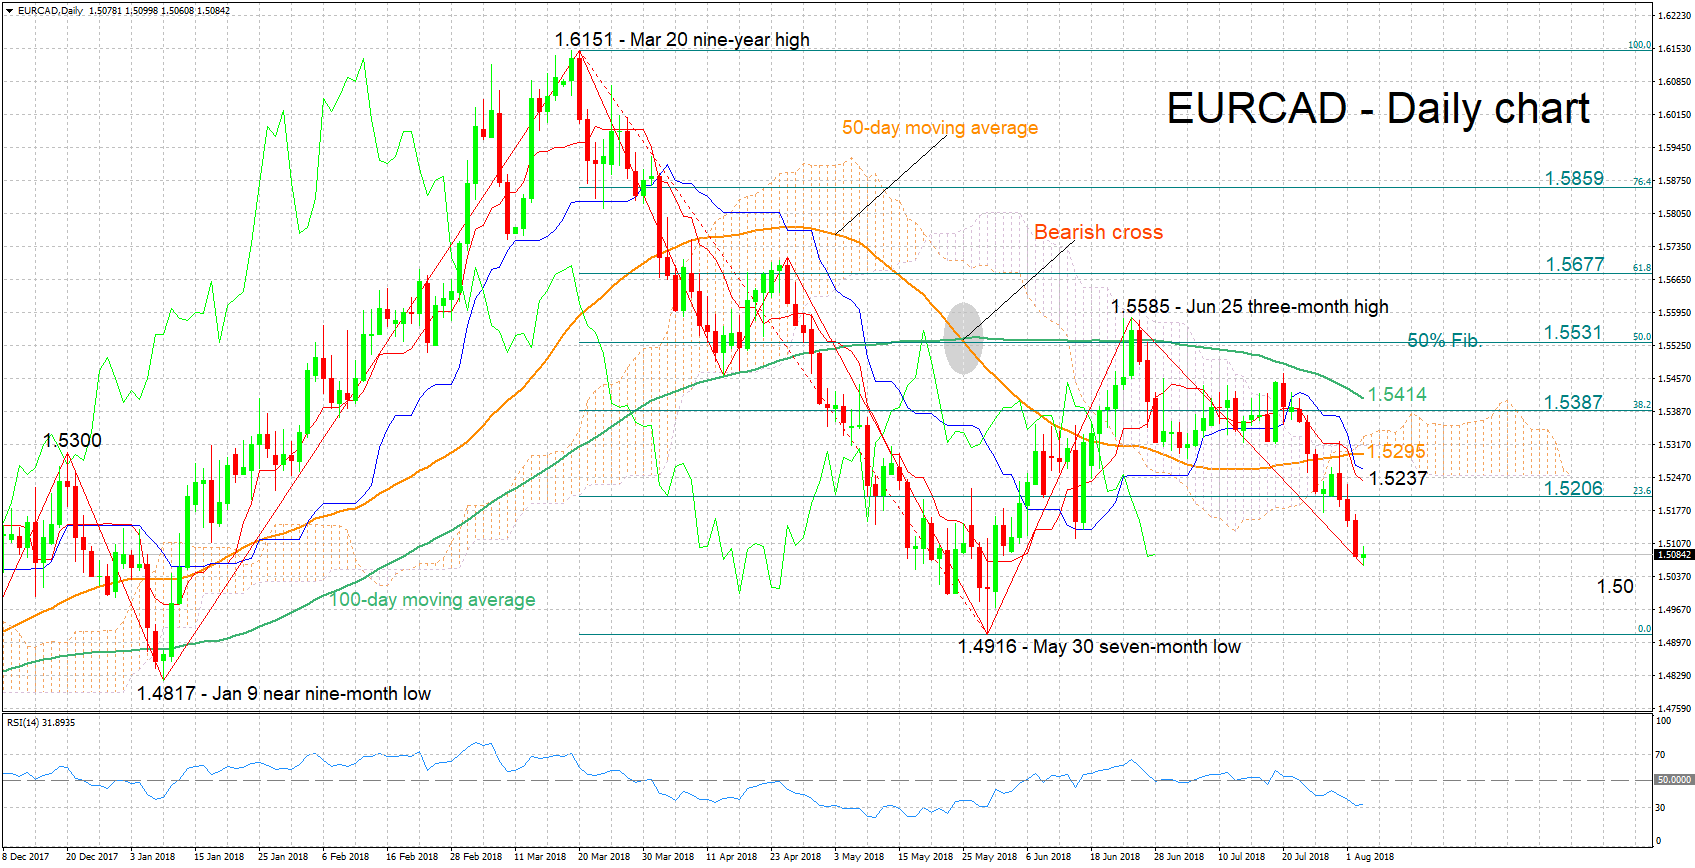
EURCAD has lost considerable ground after touching a three-month high of 1.5585 in late June. Earlier on Friday, it hit a two-month low of 1.5061.
The Tenkan- and Kijun-sen lines are negatively aligned in support of a bearish bias in the short-term. The RSI, which has been declining in recent weeks, also points to negative momentum, though notice as well that the indicator is relatively close to the 30-ovesold level; a move below 30 may indicate an overextended selloff.
If the pair continues declining, support may be met around the 1.50 round figure, which could be of psychological importance. Steeper losses would bring into scope the region around the seven-month low of 1.4916 from late May, and then the area around January 9’s near nine-month low of 1.4817.
On the upside, resistance could come around the 23.6% Fibonacci retracement level of the March 20 to May 30 downleg at 1.5206. Not far above, the range from 1.5237 to 1.5306 encapsulates the Tenkan- and Kijun-sen lines, the current level of the 50-day moving average line, and the Ichimoku cloud bottom and top, and may thus be of significance, acting as an additional barrier to price gains.
In terms of the medium-term picture, it is looking mostly negative, with price action taking place below the 50- and 100-day MA lines, as well as below the Ichimoku cloud. Additionally, a bearish cross was recorded in late May when the 50-day MA moved below the 100-day one.
Overall, both the short- and medium-term outlooks are looking bearish at the moment. For perspective, the pair has shed 6.6% after posting a nine-year high of 1.6151 in late March.
GBPJPY Gains Some Ground; Remains Below Moving Averages in Near Term
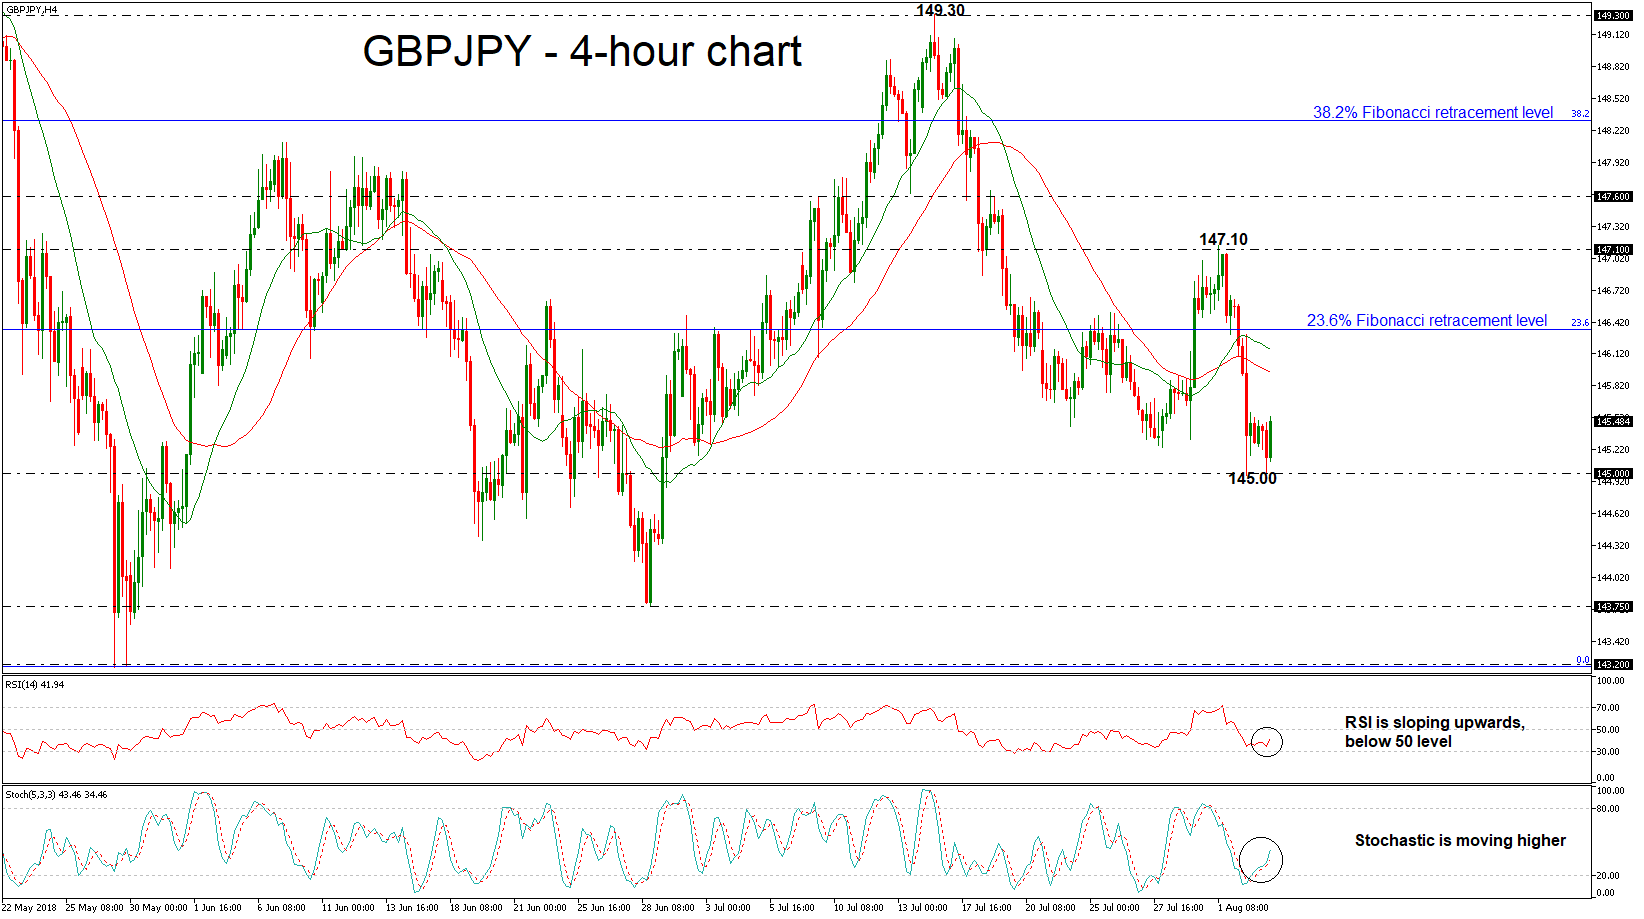
GBPJPY is trading slightly higher over the past few hours after the rebound on the 145.00 psychological level. The price is trying to gain some ground; however, it is still developing below the 20- and 40-simple moving averages in the 4-hour chart.
The Relative Strength Index (RSI) is currently increasing positive momentum towards its neutral threshold of 50, while the stochastic oscillator is moving higher, both hinting that the next move in prices could be on the upside rather than on the downside.
If the pair bounces further up, immediate resistance could be met at the 40- and then at the 20-simple moving averages (SMAs) at 145.95 and 146.14 respectively. Jumping above these levels, the pair could challenge the 23.6% Fibonacci retracement level of the downleg from 146.60 to 143.20, around 146.35. Even higher, the price could hit the 147.10 resistance, taken from the high on August 1.
However, should the market extend losses, immediate support could come from the 145.00 key level. A leg below this area could increase downside pressure and push the price until the 143.75 hurdle.
In the bigger picture, the pair is bearish as it posted a sharp sell-off following the touch on the 149.30 resistance obstacle and bears are still have the upper hand.
Big Revisions Offset July Miss on Payrolls
By the numbers: July NFP and U.S Trade
Average hourly earnings m/m: +0.3%e vs. +0.3%a
Average hourly earnings y/y: +2.7%e vs. +2.7%a
U.S employment change: +193Ke vs. +157Ka
U.S unemployment rate: +3.9%e vs.+3.9%a
Prior change in NFP: revised higher from +213K to +248K
Prior change in private payrolls: revised higher from +202K to +234K
Prior manufacturing payrolls: revised lower from +36K to +33K
U.S Trade Balance: -$46.5Be vs. -$46.3B
Non-farm payroll (NFP)
U.S hiring eased a tad in July, but remains solid, and the unemployment rate fell, which suggests that the U.S labor market remains in expansion territory.
Payrolls rose a seasonally adjusted +157K, while the unemployment rate ticked down to +3.9%.
Revised figures show employers added +248K jobs in June and +268K in May, a net upward revision of +59K.
Wages rose +2.7% from a year earlier in July, a modest pace. The Labor force participation was +62.9% in July, unchanged after June’s increase.
Impact: The U.S dollar has lost some of its earlier shine against G7 currency pairs, while short-term rates are little changed.
U.S Trade
The U.S trade deficit expanded in June at the fastest rate in two-year, reflecting rising imports and falling exports.
The trade deficit in goods and services increased +7.3% m/m, to a seasonally adjusted -$46.35B in June.
Exports fell -0.7% from May, while imports into the U.S. increased +0.6% on the month.
Market expectations were for the gap to widen to -$46.6B in June.
EUR/USD Mid-Day Outlook
Daily Pivots: (S1) 1.1555; (P) 1.1612 (R1) 1.1641; More.....
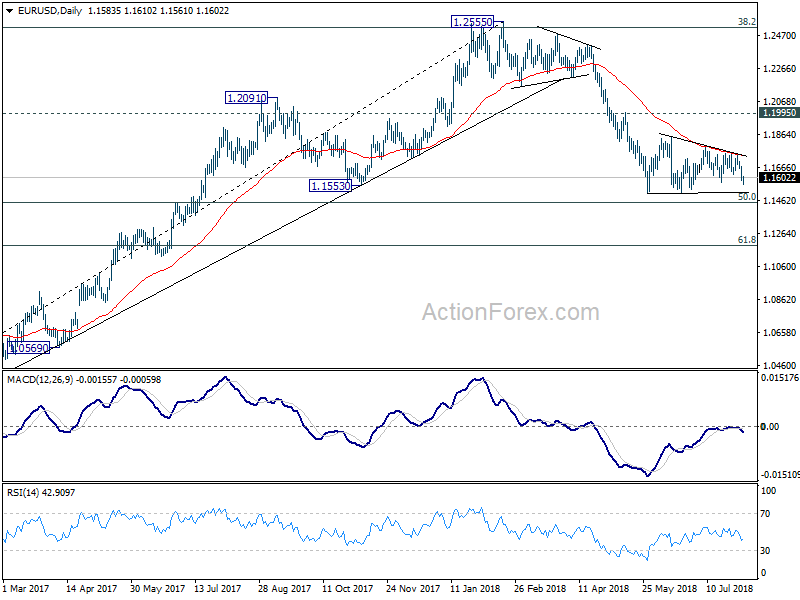
EUR/USD dips to 1.5161 and breached 1.5174 minor support, but quickly recovered. Without committed selling, intraday bias stays neutral first. The consolidation from 1.1509 could extend further. But in case of another rise, upside should be limited by 1.1851 resistance to bring fall resumption eventually. On the downside, decisive break of 1.1507 will resume larger down trend from 1.2555 through 50% retracement of 1.0339 to 1.2555 at 1.1447.
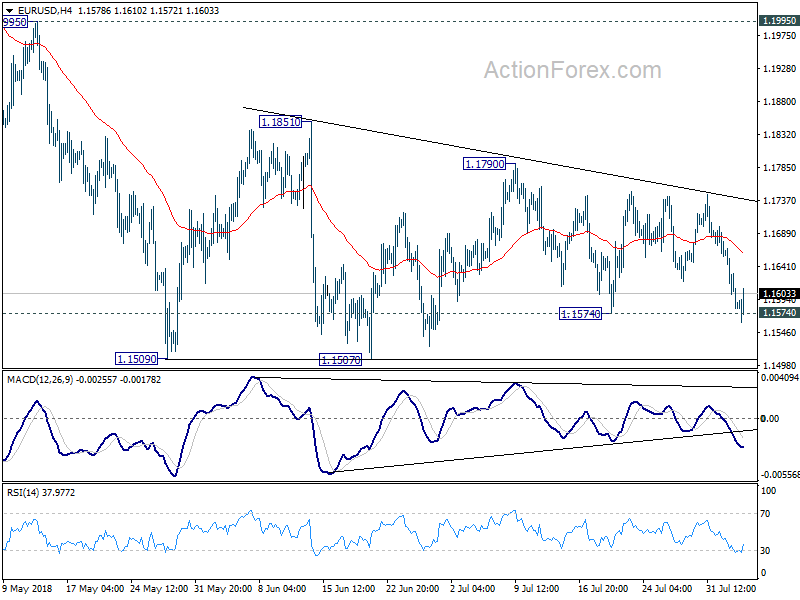
In the bigger picture, EUR/USD was rejected by 38.2% retracement of 1.6039 (2008 high) to 1.0339 (2017 low) at 1.2516. And, a medium term top was formed at 1.2555 already. Decline from there should extend further to 61.8% retracement of 1.0339 to 1.2555 at 1.1186 and below. For now, even in case of rebound, we won't consider the fall from 1.2555 as finished as long as 1.1995 resistance holds.
Dollar Rally Hits the Wall of Chinese Intervention, Dragged Down by Mixed NFP
In early US session, Dollar is still trading as one of the strongest major currencies for the week, together with Canadian Dollar and Swiss Franc. However, it's clearly losing some steam today and it's in red against all others at the time of writing. One factor that triggered an immediately setback in greenback's rally is China's measure to halt Yuan's decline. Another factor is that the highly anticipated non-farm payroll report is just mixed.
For today, Dollar is now the weakest one, followed by Sterling. Aussie, Kiwi and Loonie are all strong. For the week, Canadian Dollar is the strongest one, followed by Dollar and Swiss Franc. Sterling is still the weakest one, followed by New Zealand Dollar and then Euro.
Technically, EUR/USD breached 1.5174 minor support but there is no follow through selling yet. Without downside acceleration, consolidation pattern from 1.1509 will likely extend further. USD/CAD's recovery completed at 1.3024 and it's probably resuming recent fall from 1.3385, But we'd be aware of loss of downside momentum ahead for USD/CAD. EUR/AUD is a pair to watch. It's now trading at 1.5681, very close to 1.5651 near term support. As long as 1.5651 holds, we'd stay bullish in EUR/AUD for another rise through 1.5888 resistance. However, break of 1.5651 will indicate near term bearish reversal.
US NFP grew 157k, missed expectation. But average hourly earnings grew solidly by 0.3% mom
US non-farm payroll grew 157k in July, below expectation of 193k. But prior month's figure was revised up from 213k to 248k. Unemployment rate dropped back to 3.9% as expected. Most importantly, average hourly earnings grew 0.3% mom, matched expectation. Also from US, trade deficit widened to USD -46.3B in June, slightly higher than expectation of USD 3.1B.
From Canada, trade deficit narrowed to CAD -0.6B in June, much smaller than expectation of CAD -2.3B.
China raises FX RRR to 20% to stabilize Yuan from free fall
Offshore Chinese Yuan staged a strong rebound, while Dollar tumbles across the board, after China's Central bank announced measure to curb capital outflow and stabilize the falling Yuan exchange rate.
The People's Bank of China said after market close that it raises the "foreign exchange risk reserve ratio of forward sales from 0% to 20%, effective August 6, 2018. According to the statement, it's an act to "prevent macro financial risks, promote the stable operation of financial institutions, and strengthen macro-prudential management."
In the next step, PBoC will "continue to strengthen the monitoring of the foreign exchange market," and, "take effective measures to carry out countercyclical adjustments, maintain the smooth operation of the foreign exchange market, and maintain the basic stability of the RMB exchange rate at a reasonable and balanced level."
USD/CNH (offshore Yuan) tumbles sharply after hitting 6.912 earlier today. The pair could be heading back to 6.8 handle.
China announces additional tariffs on 5207 US imports, valued at USD 60B, rates from 5% to 25%
Also from China, the Finance Ministry announced the counter measures to US threat of imposing 25% products on USD 200B in Chinese goods. The State Council's Customs Tariff Commission decided to impost additional levies on 5207 US products, totalling around USD 60B in value.
Additional 25% tariff will be imposed on 2493 products, additional 20% on 1078 products, additional 10% on 974 products and additional 5% on 662 products. The effect date is to be determined.
UK PMI services dropped to 53.5, back into slow lane
UK PMI services dropped to 53.5 in July, down from 55.1 and missed expectation of 54.7. Tim Moore, Associate Director at IHS Markit, said in the released that "the service sector moved back into the slow lane in July as business activity growth lost momentum for the first time since the start of spring." And, "Brexit uncertainty had held back new project wins, reflecting risk aversion and a wait-and-see approach to investment spending among international clients." He also noted that "the combination of slower output growth and softer price pressures during July will reinforce expectations that any further Bank of England rate rises will be both gradual and limited."
BoE Carney: No-deal Brexit risks uncomfortably high, but we're prepared
BoE Governor Mark Carney said in a BBC radio interview that the risk of no-deal Brexit is "a relatively unlikely possibility but it is still a possibility". And it would be "highly undesirable". He added that "the possibility of a no deal is uncomfortably high at this point."
In case of a no-deal Brexit, there would be disruption in trade, economic activity and higher prices for a period of time. He emphasized that "our job in the Bank of England is to make sure that those things don't happen. It's relatively unlikely but it is a possibility. We don't want to have people worrying that they can't get their money out."
Nonetheless, he also noted that the financial system is robust and "banks have the capital, the liquidity that they need and we have the contingency plans in place".
But he also said "the UK has taken all the steps, all the secondary legislation it needs to. The European authorities still have some steps they need to take. We're having conversations and we expect those to be addressed."
Near 50% of UK businesses not anticipating any Brexit contingency plan
According to a survey by the Institute of Directors, only 31% of respondents are have carried out Brexit contingency plan. 8% have the plan implement already, 11% are drawing up the plans, and 12% have drawn up bot not implemented the plans yet. 19% of them haven't even drawn up any plans even though the anticipate doing so. And 49% have no intention to do any Brexit contingency plans.
From the figures, it looks like business are not to worried about the impact of Brexit and transitions on businesses. But Director-General of the IoD Stephen Martin has another interpretation. He said that firms have been "left in the dark" when it comes to the planning. And "the reality is that many companies feel they can only make changes once there is tangible information about what they are adjusting to." And he urged that "as long as no deal remains a possibility, it is essential that the government steps up to the plate and provides advice on preparing for such an outcome."
Eurozone PMI services finalized at 54.3, points to 0.3% GDP growth in Q3
Eurozone PMI services was finalized at 54.2 in July, revised down from 54.4. That compares to June's final reading of 55.2. PMI composite was finalized at 54.3, down 0.6 from June's 54.9. Among the countries, Germany PMI composite was a 4-month high of 55.0. France PMI composite was at a 2-month low of 54.4. Spain PMI composite hit 56-month low at 52.7.
Rob Dobson, Director at IHS Markit said "if the headline index continues to track at its current level, quarterly GDP growth over the third quarter as a whole would be little-changed from the softer-than expected expansion of 0.3% signalled by official Eurostat data for quarter two."
Also released in European session, Eurozone retail sales rose 0.3% mom in June, below expectation of 0.4% mom. Swiss CPI accelerated to 1.2% yoy in July, matched expectations.
BoJ minutes: No pronounced signs on improvement in trade tensions
BoJ released minutes of the June 14/15 meeting today (not the one earlier this week). The discussions during this meeting were of much less important to the one on July 30/31, after which BoJ announced strengthening of the easing framework. Nonetheless, there were still some interesting points to note.
One member questioned that BoJ's credibility and commitment of achieving the 2% inflation target was undermined "because the description on the timing of reaching around 2 percent inflation had been deleted from the April 2018 Outlook Report." And there communication strategy was a deeply discussed topic. There was consensus on emphasizing the bank's commitment to achieving price stability.
The minutes also noted the "sluggish growth in the CPI since the start of fiscal 2018". Some members pointed to "short term factors" including Yen's appreciation. Theses members also pointed to "increasingly competitive environment surrounding the retail sector". Some members took a long-term perspective and attribute to " the fact that the mindset and behavior based on the assumption that wages and prices would not increase easily had been deeply entrenched among firms and households." One member said inflation was constrained by "social mode" which was brought about by "prolonged period of low growth and deflation".
On risks the minutes noted US economic policies, Brexit and geopolitical risks as the main ones. In particular, "a few members said that, although the U.S. protectionist trade policy had been criticized at international conferences such as the Group of Seven (G-7) meetings, there were no pronounced signs at the moment that the situation surrounding the policy would improve."
Also released in Asian session, Australia AiG performance of services dropped notably by -9.4 pts to 53.6 in July. Retail sales rose 0.4% mom in June, beat expectation of 0.3% mom. China Caixin PMI services dropped 1.1 to 52.8 in July.
EUR/USD Mid-Day Outlook
Daily Pivots: (S1) 1.1555; (P) 1.1612 (R1) 1.1641; More.....
EUR/USD dips to 1.5161 and breached 1.5174 minor support, but quickly recovered. Without committed selling, intraday bias stays neutral first. The consolidation from 1.1509 could extend further. But in case of another rise, upside should be limited by 1.1851 resistance to bring fall resumption eventually. On the downside, decisive break of 1.1507 will resume larger down trend from 1.2555 through 50% retracement of 1.0339 to 1.2555 at 1.1447.
In the bigger picture, EUR/USD was rejected by 38.2% retracement of 1.6039 (2008 high) to 1.0339 (2017 low) at 1.2516. And, a medium term top was formed at 1.2555 already. Decline from there should extend further to 61.8% retracement of 1.0339 to 1.2555 at 1.1186 and below. For now, even in case of rebound, we won't consider the fall from 1.2555 as finished as long as 1.1995 resistance holds.
Economic Indicators Update
| GMT | Ccy | Events | Actual | Forecast | Previous | Revised |
|---|---|---|---|---|---|---|
| 22:30 | AUD | AiG Performance of Service Index Jul | 53.6 | 63 | ||
| 23:50 | JPY | BOJ Minutes of Policy Meeting Jun | ||||
| 01:30 | AUD | Retail Sales M/M Jun | 0.40% | 0.30% | 0.40% | |
| 01:45 | CNY | Caixin China PMI Services Jul | 52.8 | 53.7 | 53.9 | |
| 07:15 | CHF | CPI M/M Jul | -0.20% | -0.30% | 0.00% | |
| 07:15 | CHF | CPI Y/Y Jul | 1.20% | 1.20% | 1.10% | |
| 07:45 | EUR | Italy Services PMI Jul | 54 | 53.7 | 54.3 | |
| 07:50 | EUR | France Services PMI Jul F | 54.9 | 55.3 | 55.3 | |
| 07:55 | EUR | Germany Services PMI Jul F | 54.1 | 54.4 | 54.4 | |
| 08:00 | EUR | Eurozone Services PMI Jul F | 54.2 | 54.4 | 54.4 | |
| 08:30 | GBP | Services PMI Jul | 53.5 | 54.7 | 55.1 | |
| 09:00 | EUR | Eurozone Retail Sales M/M Jun | 0.30% | 0.40% | 0.00% | 0.30% |
| 12:30 | CAD | Trade Balance (CAD) Jun | -0.6B | -2.3B | -2.8B | -2.7B |
| 12:30 | USD | Trade Balance Jun | -46.3B | -46.1B | -43.1B | -43.2B |
| 12:30 | USD | Change in Non-farm Payrolls Jul | 157K | 193K | 213K | 248K |
| 12:30 | USD | Unemployment Rate Jul | 3.90% | 3.90% | 4.00% | |
| 12:30 | USD | Average Hourly Earnings M/M Jul | 0.30% | 0.30% | 0.20% | 0.10% |
| 13:45 | USD | US Services PMI Jul F | 56.2 | 56.2 | ||
| 14:00 | USD | ISM Non-Manufacturing/Services Composite Jul | 58.6 | 59.1 |