

Sample Category Title
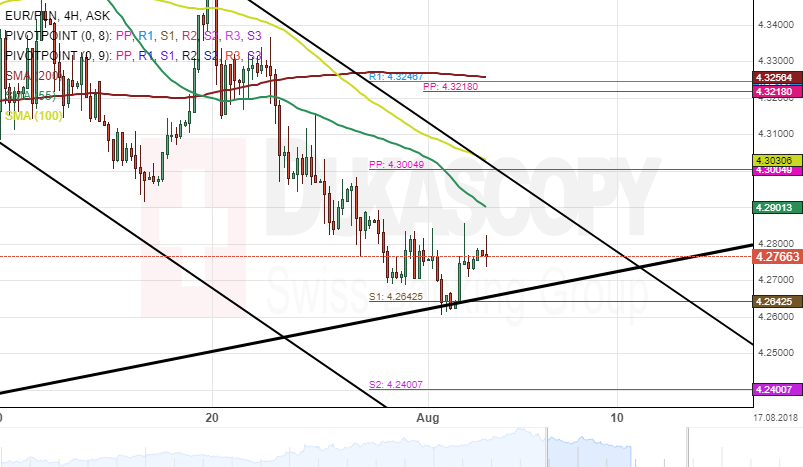
EUR/PLN 4H Chart: Decline Continues
The single European currency has depreciated massively against the Polish Zloty since the beginning of July. The currency pair started the decline after it reached a one –year high level at the 4.42 mark. The exchange rate has since lost 3.59% of its value since July 4.
During the one month long of the Euro weaken, the pair breached a significant support level within this period. Namely, the 55-, 100-, and 200-hour SMAs. The pair has moved closer to the bottom border of a dominant ascending channel pattern and could be set for a breakout.
In the meantime, it is expected that the EUR/PLN pair to make a brief retracement toward the 55-hour simple moving average during the following trading session.
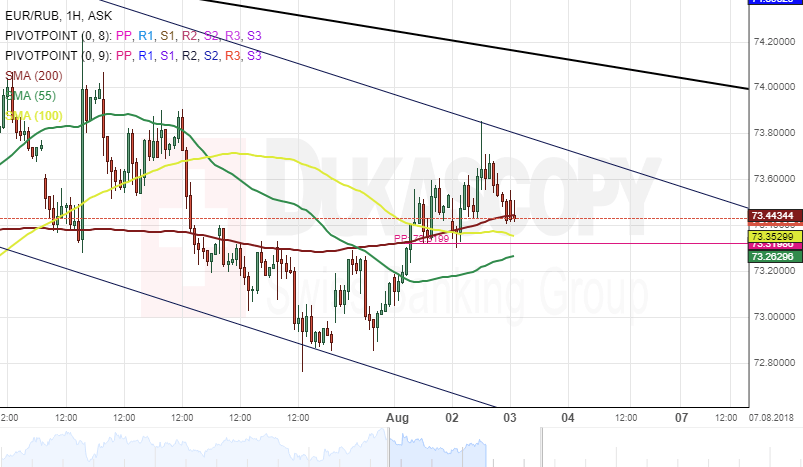
EUR/RUB 4H Chart: Upside Momentum Likely
The common European currency has declined significantly against the Russian Ruble after reaching its high mark at 80.00 in April. The currency pair reversed from the upper boundary of a dominant ascending channel on April 12 and has since reached the bottom border of its channel.
During the last month, the exchange rate has been bouncing between the borders of a medium-term triangle. Currently, the combination of the three SMAs is providing support for the rate near the 73.28 mark.
Given that the 55-, 100-, and 200-days simple moving averages are located below the price, a breakout through the upside of the aforementioned triangle is likely to occur during within the next trading sessions.
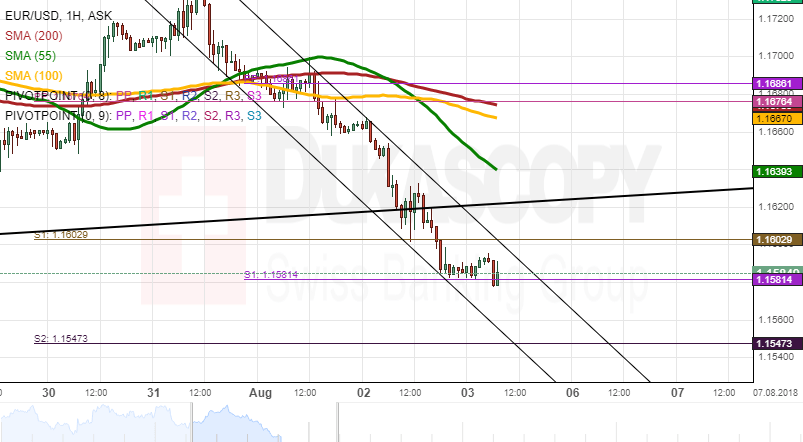
EURUSD Analysis: Breaks Out Of Triangle
In the second half of Thursday's trading session the Euro declined below the lower trend line of a dominant pattern against the US Dollar. Namely, the rate dropped below the support of the large scale triangle pattern.
The move occurred in consistency with the junior descending channel pattern, which was revealed on Thursday.
In regards to the future, if the rate passes the support at 1.1580, it is set to fall down to the weekly S2 at the 1.1550 mark. However, the descending channel is too narrow to remain in force and a braking of its upper trend line might happen.
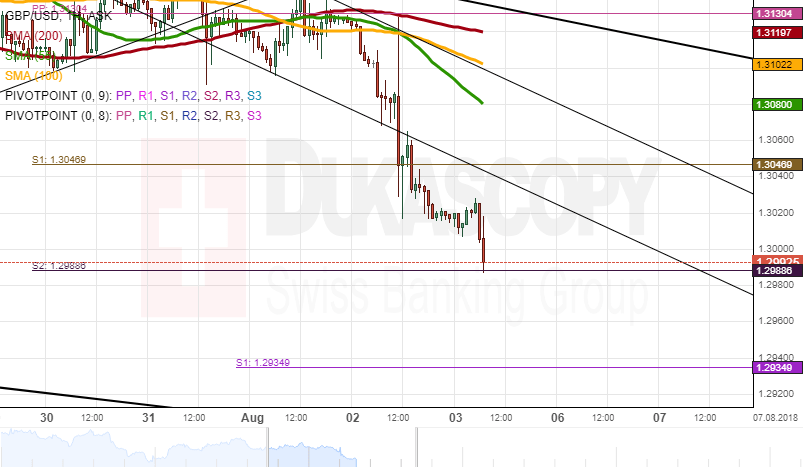
GBPUSD Analysis: Declines After UK Rate Hike
Although the Bank of England hiked their interest rate, which caused a jump of almost 50 base points in the GBP/USD, the rate retreated after encountering resistance. Namely, the 200-hour SMA and the weekly PP managed to hold their ground and force the rate into a retreat.
The retreat broke the junior descending channel pattern, and by the middle of Friday's trading session the weekly S2 at 1.2990 was already reached. If the support level gets passed, the currency rate would reach down to the monthly S1, which on Friday was located at the 1.2935 level.
USDJPY Analysis: Reveals Medium Pattern
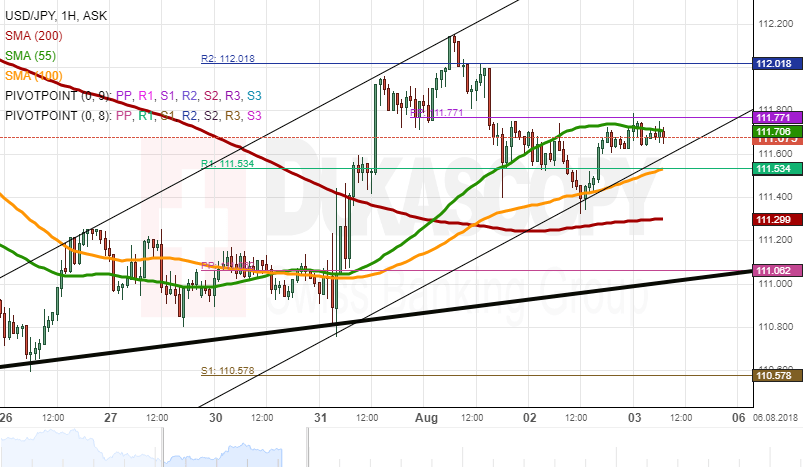
The USD/JPY on Friday morning remained near the previous levels as on Thursday. However, there was a new very important detail revealed about the currency exchange rate.
The pair retraced downwards and made a rebound just below the 100-hour SMA. The point of reference can be used to draw a new pattern. Namely, a medium scale ascending channel pattern was charted. The pattern is set to guide the rate higher in the upcoming week.
Meanwhile, in the short term watch the monthly PP at 111.80. If it gets passed, the 112.00 mark will be targeted next.
XAUUSD Analysis: Approaches Dominant Support
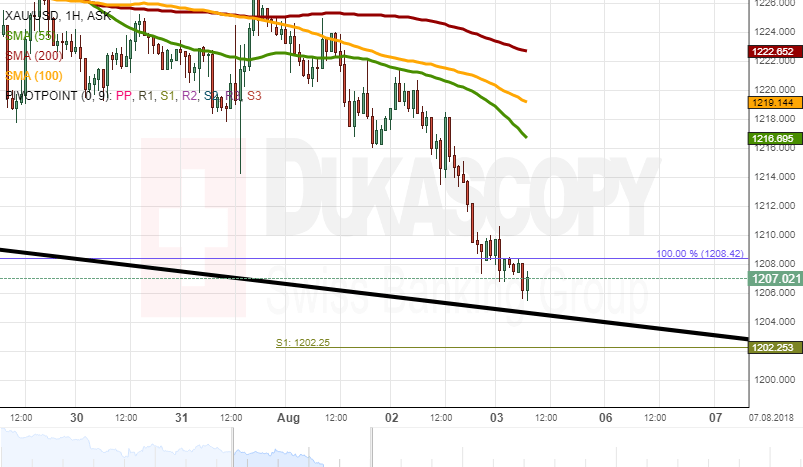
The resistance of the simple moving averages managed to force gold prices lower. The descent had almost reached the 1,200.00 level by the middle of Friday's trading session.
However, the commodity price was still set to face various support levels below it properly touches the psychologically significant 1,200.00 level.
The lower trend line of a dominant pattern on Friday was located just above the 1,204.00 mark. In addition, the first monthly support pivot point level is located at the 1,202.25 mark.
USDJPY Outlook: Extended Directionless Mode Eyes US Data For Fresh Signals
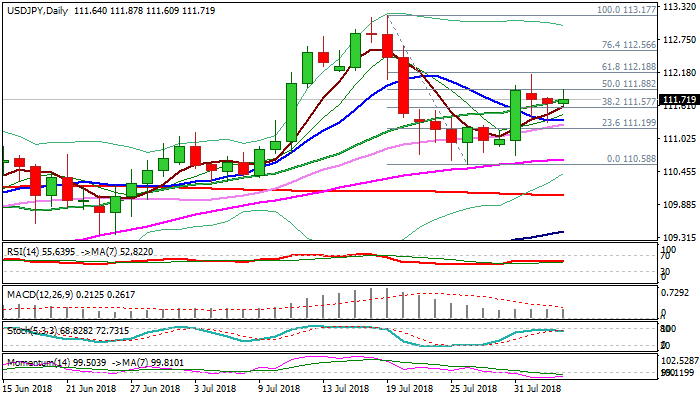
The pair holds in directionless mode in early Friday's trading, following Wednesday's Doji and Thursday's Hammer candle, awaiting stronger direction signals from US jobs data. Strong rejections on both sides in past two sessions support neutral scenario, along with mixed daily techs. Daily 10SMA turned sideways after containing dips in past two days, marking initial support at 111.36, break of which would trigger fresh weakness and expose supports at 110.66 (55SMA) and 110.58 (26 July low). At the upside, Fibo barrier at 112.18 (61.8% of 113.17/110.58) is upper pivot, close above which would generate bullish signal and unmask key near-term barrier at 113.17 (19 July).
Res: 111.87, 112.18, 112.56, 113.17
Sup: 111.60, 111.36, 111.19, 110.73
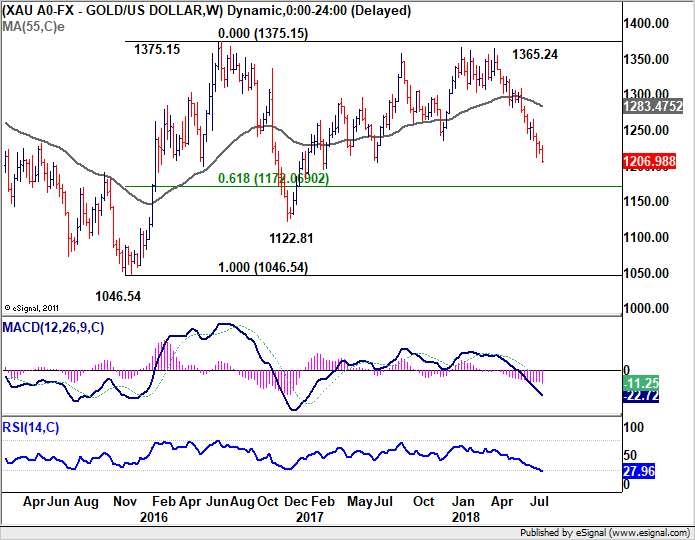
Gold breached 2017 low, 1200 vulnerable as downtrend resumes
Gold's downside resumed yesterday and hits as low as 1204.58 so far. 2017 low at 1205.02 is breached. There is no sign of bottoming yet even though it's facing 1200 psychological support. And, near term outlook will stay bearish as long as 1235.24 resistance holds.
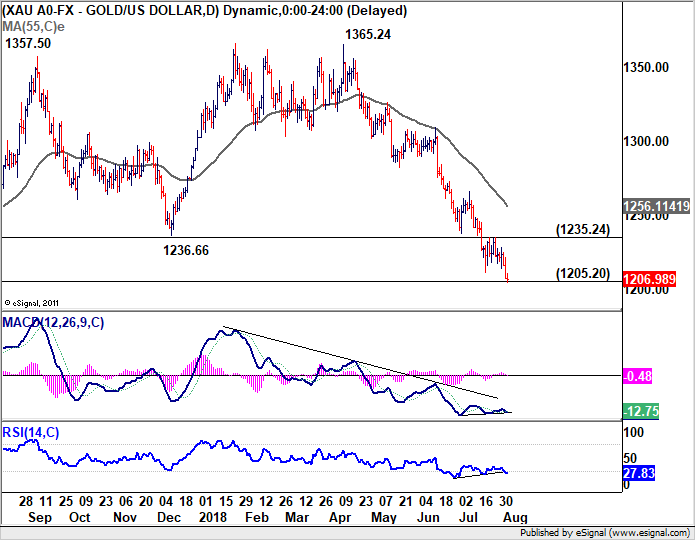
We'd expect current down trend to continue to 61.8% retracement of 1046.54 to 1375.15 at 1172.07. Based on oversold condition in weekly MACD and RSI, gold could be contained there in first attempt. However, sustained break of this fibonacci level will pave the way to 1046.54/1122.81 support zone.
U.S. Dollar Could Enter A New Phase Of Growth
'Buy American' was about the slogan that drove the markets yesterday. Apple shares rose by almost 3%, and the capitalization of the company exceeded one trillion dollars. Investors welcomed the growth of revenue and ignored the slowdown in sales growth, which was severely punished in case of Facebook earlier. Apple’s successes have pushed up the American market and keep maintaining the growth in the Asian stocks since morning.
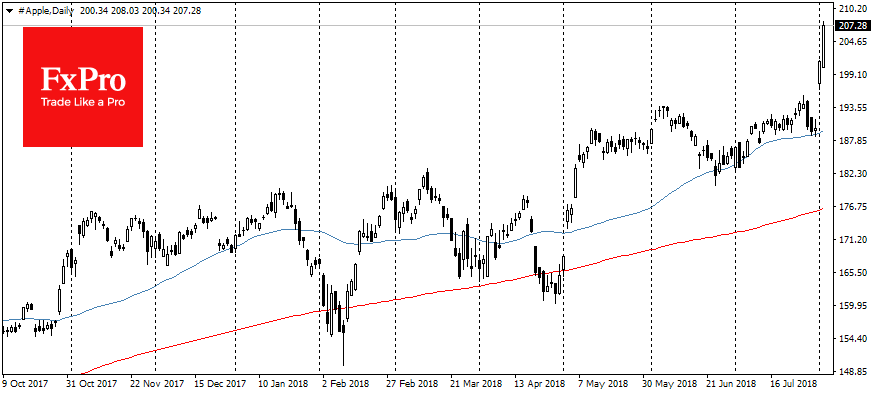
At the same time, the U.S. currency added due to the demand for safe assets because of fears around trade wars.
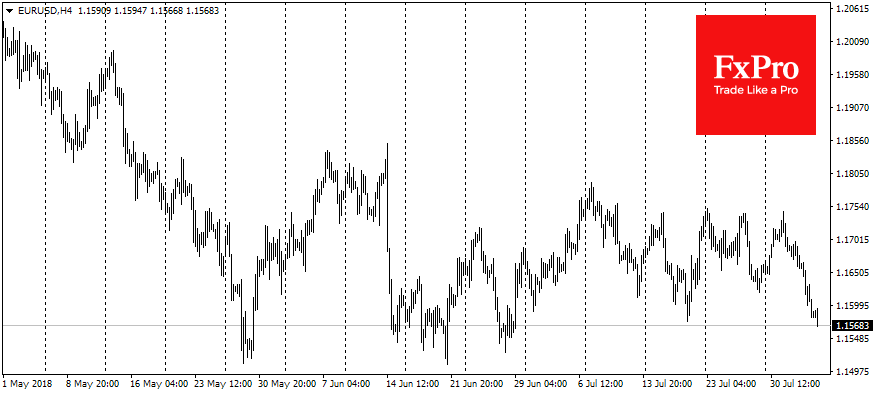
The EURUSD pair has traded around 1.1590 at the start of trading on Friday, losing 0.6% per 24 hours. The Bank of England’s increase in rates did not save the Sterling from the sale off. GBPUSD fell close to 1.30 losing almost 1% over the last day.
On the eve of the employment report, the American currency entered the area of three-months highs on the dollar index. In case of a strong market reaction, DXY has the potential to either overcome this important resistance, or once again turn to decline if the published data do not meet expectations. 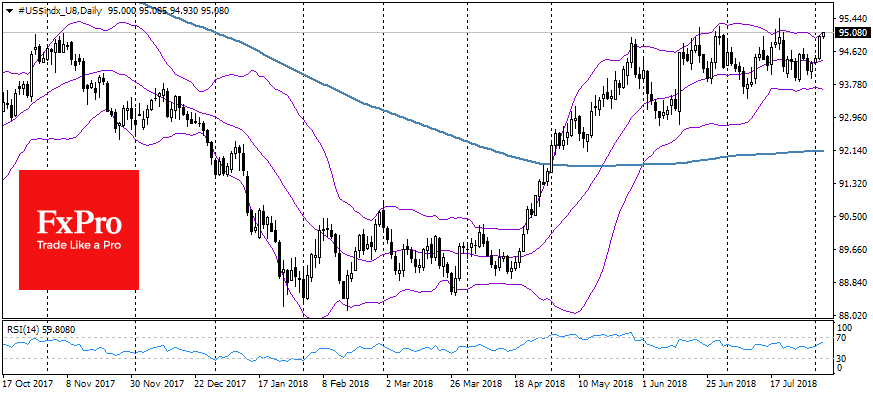
However, the indicators of the labour market suggest another healthy increase in the number of the employed:
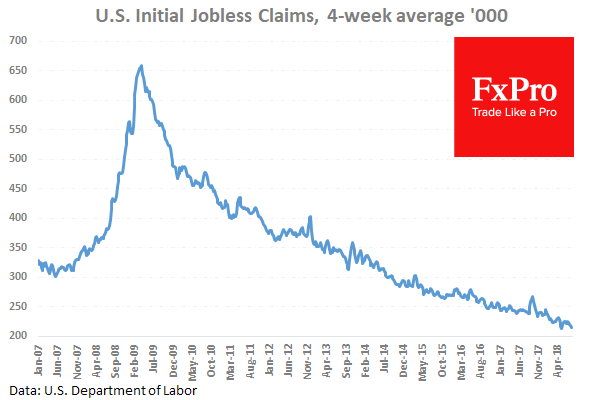
- 4-week average initial jobless claims fell near more than 40-year lows;
- In July, U.S. companies announced the lowest number of layoffs in almost two years, according to the Challenger;
- Employment component in the Manufacturing ISM was one of the few growing components last month;
- ADP report showed the growth of the employed in the private sector by 219 K, which has been the maximum since February.
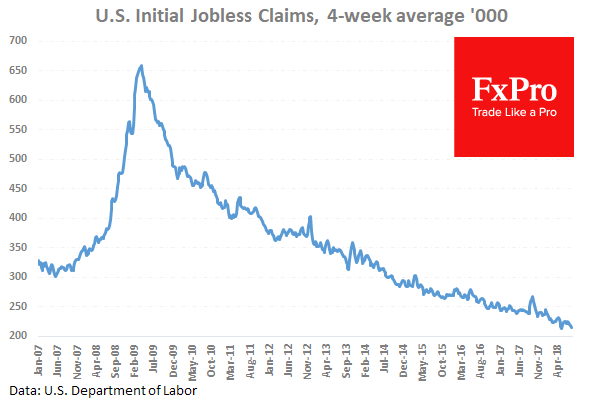
These are many signs that the American labour market maintains a strong impetus for employment growth. At the same time, there is less certainty with regard to the rate of earnings growth. If this indicator surprises the markets with strong growth, the dollar will be able to enter a new phase of growth, even if the number of jobs equals or is slightly less than the average market forecast of 195K on speculations about more hawkish Fed stance.
The Bank Of England Raised The Interest Rate. A Report On The US Labor Market Is In The Focus...
Yesterday, the attention of the financial market participants was focused on the Bank of England meeting. The regulator raised the key interest rate by 25 basis points to 0.75%. The head of the Central Bank expressed concern about the upcoming Brexit. In June, the volume of retail sales in Australia increased by 0.4%, which is higher than market expectations at 0.3%. These statistics supported the Australian dollar during the Asian trading session.
Today, the publication of a report on the labor market in the US, which will determine the further alignment of forces on majors, will be the key event. Preliminary data from ADP turned out to be quite optimistic. We recommend paying attention to the difference between the actual and forecasted values of the indicators.
Oil quotes are consolidating. At the moment, futures for the WTI crude oil are testing a mark of $68.9 per barrel.
Market Indicators
Yesterday, the major US stock indices closed in the positive zone: #SPY (+0.54%), #DIA (0.00%), #QQQ (+1.36%).
At the moment, the 10-year US government bonds yield is at the level of 2.97-2.98%.
The news feed on 2018.08.03:
The index of economic activity in the UK services sector at 11:30 (GMT+3:00);
Statistics on the labor market in the US at 15:30 (GMT+3:00).