Sample Category Title
U.S. Non-Manufacturing Activity Softens in July
In tandem with its manufacturing counterpart, the Institute for Supply Management's (ISM) non-manufacturing index fell by 3.4 points to 55.7 in July. The headline print was below the consensus forecast, which called for a more moderate decline to 58.6.
Despite the decline and below-consensus print, the index remains well in expansionary territory (with readings above 50 indicating expansion), consistent with economy running above potential.
The underlying details of the report were mixed, with five out of the index's ten subcomponents declining on the month. The biggest drops were seen in business activity, which fell by a massive 7.4 points to 56.5, new orders (-6.2 to 57.0) and backlog of orders (-5.0 to 51.5). After the latest decline, all three subcomponents now sit below their 6-month averages.
On the other hand, prices paid (+2.5 to 63.4) rose in July as price pressures continued to build, as evidenced by the rise in this sub-index in six out of seven months this year. In addition, although the employment subcomponent has been volatile this year it managed to improve in July (+2.5 to 56.1).
Trade-related subcomponents were mixed. The imports subcomponent continued to perk up (+1.0 to 52.5) after 3 monthly declines, while export orders declined by 2.5 points to 58.0.
Comments from survey respondents remained upbeat with respect to domestic demand and the overall economy, with some concerns about price pressures, labor shortages and international trade uncertainty.
Key Implications
Similar to its manufacturing counterpart, the ISM non-manufacturing index declined in July. While survey respondents remained quite optimistic about robust domestic demand, key business activity and new orders posted large declines in the month, which could be signaling that concerns about trade uncertainty are beginning to dent confidence among business owners. The impact of tariffs was also apparent as businesses reported higher prices for raw materials. Moreover, the prices paid subcomponent is up significantly relative its year-ago level.
The employment index has declined in three out of seven months this year, so it was encouraging to see it rise in July. That being said, given the near-record low unemployment level, hiring in the services sector is starting to bump up against capacity constraints. Given the scarcity of labor it is becoming increasingly hard for companies to add to their headcount, suggesting that we will likely continue to see gradual slowing in sectoral job creation in the months ahead.
All in all, while the domestic economy remains hot, coming off a strong 4.1% (annualized) expansion in the second quarter, capacity constraints, rising input prices, and trade worries are likely to weigh on activity in coming months. As a result, we expect U.S. economic growth to decelerate to around a 3% average quarterly pace through the remainder of the year.
Australia & New Zealand Weekly: Political Uncertainty Casts Doubt on the RBA’s Optimistic Employment Forecasts
Week beginning 6 August 2018
- Political uncertainty casts doubt on the RBA's optimistic employment forecasts.
- Australia: RBA policy decision, Governor Lowe speech, Statement on Monetary Policy, housing finance.
- NZ: RBNZ policy decision, inflation expectations, retail card spending.
- China: CPI, new loans, trade balance.
- US: CPI.
- Central banks: BOJ Summary of Opinions, BSP and BOT policy decisions.
- Key economic & financial forecasts.
Information contained in this report current as at 3 August 2018.
Political uncertainty casts doubt on the RBA's optimistic employment forecasts
The Reserve Bank Board meets next week on August 7.
It is certain to keep the overnight cash rate unchanged at 1.5%.
While the decision will be accompanied by the usual statement from the Governor the more interesting development for the RBA will be the release of the detailed (around 70 pages) Statement on Monetary Policy on August 10.
The Statement is always interesting because it includes the Bank's updated forecasts for GDP; headline and underlying inflation; and the unemployment rate.
In addition there will be an extension of the forecast period to cover the year to December 2020 from the May Statement which only covered forecasts to the end June 2020.
On GDP we expect the Bank will retain its upbeat forecast for growth to December 2018 of 3.25% (recall that the March quarter saw growth of 1.0%) – a view that is particularly underpinned by a positive outlook for employment. We discuss some risks below.
It is also likely to retain the 2.75% forecast for the year to June 2018 implying the Bank expects growth of around 0.6% in the June quarter. On the basis of the 1.6% for the first half of 2018 the second half will need to average around 0.8 percentage points per quarter to achieve the 3.25% forecast.
Westpac is more circumspect expecting 0.5 percentage points for the June quarter and an average of around 0.6 percentage points for the September and December quarters to achieve an annual growth rate of 2.7% for 2018.
Recall that the March quarter was boosted by a contribution from net exports of 0.35 percentage points whereas the partials are pointing to a notably smaller contribution from net exports in the June quarter.
From our perspective the more important structural signal from the March accounts was the choppy performance of household consumption (an insipid 0.34% growth in household consumption following a strong 1% in the December quarter).
By retaining the 3.25% growth forecast for 2018 there is no reason to believe that the Bank will be dissuaded from its 3.25% forecast for 2019.
The current forecast for the year to June 2020 is a modest slowdown to 3% presumably reflecting a peak in the boost from LNG exports and a likely modest drag from housing construction. We would expect the Bank to extend that 3% forecast for the full year to 2020.
So the important point is that the Bank is expecting GDP growth to be above potential for three consecutive years, with potential judged to be around 2.75%. A reasonable outcome from such persistently above trend growth would be to see the output gap close sufficiently to generate some lift in inflation and a marked fall in the unemployment rate.
In that regard the Bank's forecasts are cautious. In May it forecast underlying inflation to remain "stuck" at 2% for 2018; 2019; and only reach 2.25% in the year out to June 2020.
With the June quarter Inflation Report confirming that annual underlying inflation remained "stuck" around 2% there will be no reason to change the inflation forecasts in the May SOMP with the forecast being extended to December 2020 and underlying inflation to end 2020 being forecast at 2.25% – that is finally inside the 2–3% band but still below the 2.5% "target". In the May SOMP the Bank stated that "employment growth is expected to be a little above growth in the working age population over the next couple of years and spare capacity is expected to decline." That "decline" in spare capacity is the dynamic supporting official forecasts that wages growth is expected to reach 3.25% by 2019/20, (Commonwealth Budget May 2018).
The Bank's forecasts for working aged population growth are 1.7% for 2016 and 1.6% for 2019.
The forecasts for the unemployment rate in the May SOMP of 5.5% by December 2018; 5.25% by December 2019; and 5.25% by June 2020 are expected to be extended to December 2020 at 5.25%.
There is one serious dynamic that could well derail these comfortable jobs forecasts.
Figure 1, shows the profile of employment growth around the "window" of the last two Federal election campaigns. Note how over the nine month "windows" around election campaigns six month annualised employment growth collapsed–a far cry from the RBA's assumption of "a little above working age population growth (1.6%)".
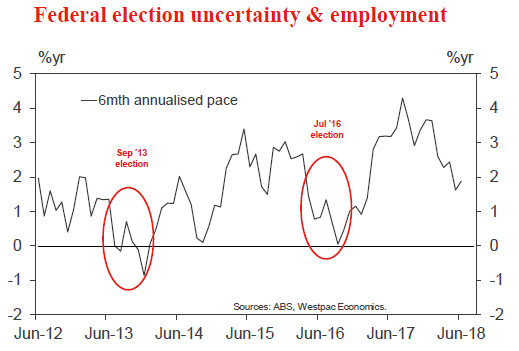
It is true that such a pattern has not been apparent during some previous election campaigns but the evidence from 2013 and 2016 must be disturbing.
With the recent by-election results it now seems certain that there will be no early election. The latest possible date for the next election is May 18 2019 (assuming a simultaneous election for the House of Representatives and a half Senate election).
In the previous two elections (2013 and 2016) the election result was arguably more certain than in 2019. For the 2019 election the polls; the by-election results; and the government's slim one seat majority all point to considerable political uncertainty.
If businesses acted cautiously during the lead up and the aftermath of the last two Federal elections then we cannot rule out a repeat in 2019. Certainly the Bank's assumption of a healthy 1.6% – 1.8% jobs market over that period would be challenged.
We do not expect the RBA to incorporate any such effect in their forecasts but recent history around election periods raises significant uncertainty about the sustainability of the Bank's employment forecasts and hence their expectation of above trend economic growth.
The week that was
Policy makers have again been the centre of attention this week, with central bank decisions and associated guidance in the US; UK; Japan and India emphasising the disparate conditions faced in different jurisdictions.
It may be the biggest name in monetary policy, but the July/ August meeting of the FOMC was as close to a non-event as can be. The only real conclusion worth drawing is that the confidence the Committee has in the US economy remains resolute despite the growing impact of trade tensions. All aspects of activity in the US economy were described as strong, and clearly there remains a strong belief amongst participants that their 2.0%yr medium-term inflation target will be achieved in a sustainable manner. The end point for this cycle will be determined by where neutral resides. We hold it to be around 2.50%, and so see a peak in the fed funds rate at 2.875% after four more hikes by June 2019. The restrictive effect of this policy stance will be amplified by the impact rate hikes and the growing deficit have on term interest rates, foreshadowed by our forecast for the US 10-year yield to rise from below 3.00% currently to 3.50% by March 2019.
Before turning to Asia, we should also flag that the Bank of England held true to their rhetoric and raised rates at their August meeting in a unanimous 9-0 vote. Yet the overall tone was mildly dovish with the Bank emphasising the "gradual and limited" nature of the tightening cycle and lowering their estimate of the UK's neutral rate. In that regard, we were against them hiking at this meeting, and hold that this will eventually prove a policy mistake. Inflation is returning to target quicker than anticipated, and momentum in the economy is poor. On top of all that loom the open-ended risks of Brexit, which will come to the fore early next year.
Turning to Asia and the Bank of Japan (BoJ), expectations were high for a change in the stance of policy at the July meeting. A number of changes were made, but arguably these alterations were not entirely consistent with the market's expectations. At the moment, the global policy skew is towards tighter policy. While the Bank of Japan did increase flexibility around their 0% 10-year JGB yield target by adding yields "may move upward and downward to some extent mainly depending on developments in economic activity and prices" (+- 20bps), this change and the others that accompanied it occurred to give the BoJ greater capacity to sustain their ultra-loose policy. While markets have since tested the upward 'extent' of BoJ flexibility, if anything recent developments in the economy and prices have been slightly weaker than previous quarters, arguing for lower yields. Most notably, when fresh food and energy are excluded, annual inflation is a mere 0.2%yr.
Recent central bank actions elsewhere in Asia have been aimed at mitigating global pressures on price (India) and exchange rate (Indonesia) stability. Both India and Indonesia have taken a pro-active approach to policy in the hope that it will minimise the degree of tightening necessary to fend off instability, and thus limit their effect on economic growth. So far, so good, with activity indicators such as the PMI's pointing to developing Asia sustaining momentum as advanced economies in the region slow. In the middle is China, showing resilience in manufacturing and service activity. External demand has softened, but it seems unlikely to experience a further jolt lower absent a material escalation of trade tensions with the US. Importantly, having lagged activity for some time, employment in both sectors is now holding up as production momentum eases back. Job and income opportunities are critical for China's future, both with respect to headline growth as well as their long-term financial and economic stability.
Looking ahead, the RBA is set to meet for their August meeting next week on Tuesday and then release the August Statement on Monetary Policy (SoMP) on Friday. Ahead of these events, Chief Economist Bill Evans has assessed the risks to the RBA's economic forecasts, the latest iteration of which will be included in the August SoMP. Westpac expects the RBA's 2018 and 2019 forecasts for growth and inflation to be unchanged, and for the extended horizon to December 2020 to show an expectation of progress towards a lift in inflation off the bottom of their 2–3%yr target range. More significant than these forecasts however are the risks we see to employment growth as the next Federal election nears. The 2013 and 2016 election experience highlights the potential impact political uncertainty can have on job creation and hence activity growth. While the RBA will not incorporate these risks in their forecasts, to us they represent a real challenge to the RBA's belief in above-trend growth in 2019, and instead argue in favour of our own view of sub-trend growth, circa 2.5%yr. In the interim, the housing market is likely to remain the key area of uncertainty. CoreLogic price data to July show prices declining at a 5% annualised pace in Sydney and Melbourne. Furthermore, we estimate that just over 80% of all dwellings recorded a price decline in the month, well up on the 50% that have seen price declines over the year. Arguably this is evidence of changes to lending standards now affecting a greater proportion of borrowers.
Chart of the week: Q2 real and nominal retail sales
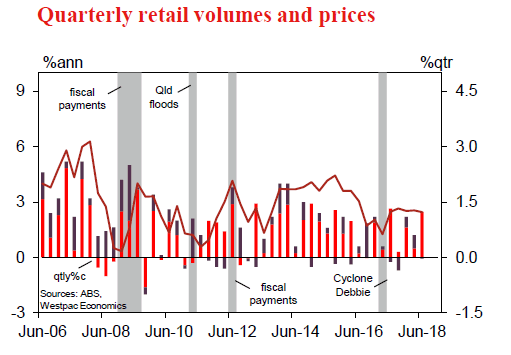
The June retail report posted a third consecutive 0.4% gain, above expectations of a slightly softer 0.3% for June. However, the big surprise was around real retail sales for the quarter, which posted a 1.2% increase vs consensus expectations of a 0.8% gain. Recall that retailers had a difficult March quarter with sales rising just 0.2% and the wider consumer spending measures in the national accounts showing a similarly disappointing outcome. The Q2 rebound in retail volumes suggests much of this is quarterly 'choppiness' rather than a move to a weaker underlying trend.
For Q2 as a whole the main surprise for us was around prices. The CPI detail had pointed to a modest 0.2% gain in retail prices. Instead they recorded a 0.1% dip, all store-type categories except cafes & restaurants recording declines. Food price inflation in the survey continues to track 1.5ppts below the CPI measure suggesting consumers are shifting spending patterns towards items/retailers with the most aggressive price discounting. Non food price inflation is more in line with upstream cost measures.
New Zealand: week ahead & data wrap
Working through the details
Business confidence surveys are painting an increasingly dismal picture of the state of the economy. But that hasn't been reflected in firms' actions – employment continues to grow at a solid pace, and if anything has regained some momentum in the last quarter. We think this should leave the Reserve Bank broadly satisfied that both employment and inflation remain on track with its mandate.
The ANZ business confidence survey continued its slide in July, reaching levels that were last seen around the time of the 2008- 09 financial crisis. The weakness in confidence is more or less equally spread across the major sectors, suggesting a more general malaise rather than particular challenges facing certain industries.
We've noted before that this survey has a political slant: the level of confidence tends to be lower under Labour-led governments, relative to economic conditions at the time. However, the direction of the survey is cause for concern. Confidence has entered a renewed decline after a brief rebound in the early part of this year.
The question is whether businesses' expressed pessimism will translate into action. There has been only modest evidence for this to date. Growth in job advertisements has slowed, and imports of plant and machinery have eased off in the last few months, but both measures remain at high levels.
Our view is that the pace of growth in the economy has passed its peak, but the weakness in business confidence overstates the case.
Even with an impending fillip from increased government spending, growth in the coming years is likely to remain below the peaks seen in the middle of this decade, as the economy's spare capacity disappears and net migration slows. However, this represents a slowdown in growth from unsustainably high levels, rather than anything resembling a recession.
We expected to see some sign of the growth slowdown coming through, with a lag, in this week's labour market figures. But despite a slightly softer headline result, the details of the surveys were surprisingly robust.
The unemployment rate rose slightly in the June quarter to 4.5%, against expectations of a steady rate of 4.4%. That's not a significant change given the historic volatility of the unemployment rate, and the reasons behind it weren't alarming: employment grew by 0.5%, but was outstripped by a rise in labour force participation.
We've noted previously that recent changes to the Household Labour Force Survey (HLFS) have introduced a seasonal bias, where June quarters tend to be understated. So it's likely that employment growth was even stronger than the headline figures suggest. That's apparent from the fact that annual employment growth accelerated to 3.7% in June, compared to 3.1% in March. The employer-focused Quarterly Employment Survey (QES) showed a similar acceleration in jobs growth. (Incidentally, the QES is a direct input to some of the services components of GDP, so these results put some upside risk on our forecast of a 0.7% rise in June quarter GDP.)
The Labour Cost Index (LCI) was also in the spotlight ahead of this week's releases. Anecdotes suggest that some of businesses' recent angst stems from the difficulty of finding workers and the resulting pressure to lift pay rates.
The private sector LCI measure was up 2.1% in the last year, compared to 1.9% last quarter. Some of the pickup was due to a larger minimum wage increase this year compared to previous years. But there does seem to have been a lift in private sector wage growth beyond this – not a big change, but this is a very slow-moving series, so we wouldn't have expected more than what we got at this point.
The labour market surveys are particularly important to the Reserve Bank, now that employment outcomes are part of its mandate along with price stability. We think the RBNZ should be comfortable on both fronts, ahead of next Thursday's Monetary Policy Statement. The economy continues to run close to 'maximum sustainable employment', notwithstanding the small uptick in the unemployment rate this quarter. And the message from the wages data is similar to that from the inflation figures last month: underlying wage and price pressures are gradually picking up, though they are still on the lower side of what would be consistent with the RBNZ's inflation target.
The balance of those factors argues for keeping the OCR at a low level for a considerable period of time. In its May MPS the RBNZ's forecasts showed an unchanged OCR through until late 2019, and gradual increases thereafter. However, the language of the statement emphasised that the next move in the OCR could be in either direction, if required by changing conditions.
We expect that language to be retained in next week's review. Economic developments in the past three months have been mixed: growth has been softer than expected in the near term, but underlying inflation has been a little stronger. House prices have softened in the last few months, and the international environment looks a little more hazardous as the US's various trade spats heat up. But the lower New Zealand dollar provides something of a buffer to exporters.
If anything, there is a risk of a slightly more dovish tone to the statement compared to May, reflecting the RBNZ's judgement on fiscal policy. In the June OCR review we were surprised that the RBNZ regarded the 2018 Budget as less stimulatory, in contrast to the Treasury's view that it was more stimulatory. We suspect the RBNZ will stick to its view, but up to now there hasn't been an opportunity to elaborate on it.
Our view remains that the next move in the OCR will be up, but not until the end of 2019. Financial markets, which for some time were picking an earlier rate hike, have now fallen into line with our view. A slightly more dovish tone to next week's statement would likely produce very little market reaction.
Data Previews
Aus RBA policy decision
- Aug 7, Last: 1.50%, WBC f/c: 1.50%
- Mkt f/c: 1.50%, Range: 1.50% to 1.50%
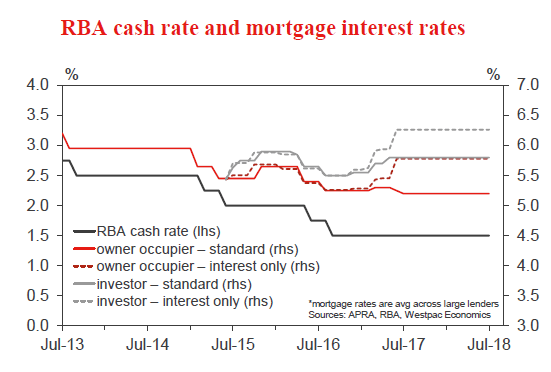
The RBA is certain to keep the overnight cash rate unchanged at 1.5% at its August policy meeting. The Governor's decision statement is also likely to retain the key line that: "further progress in reducing unemployment and having inflation return to target is expected, although this progress is likely to be gradual".
This month's decision will be followed by the release of updated commentary and forecasts with the RBA's Statement on Monetary Policy on Aug 10. We expect the Bank to retain its upbeat 3.25% growth forecasts for both 2018 and 2019. There will be more interest around the trajectory for inflation, with current forecasts only just nudging into the 2-3% target band by June 2020 but the August update extending that forecast horizon to December 2020. See p2 for a further discussion of the risks around policy. Note that the RBA Governor is also scheduled to speak on Aug 8, the topic being "Demographic Change and Recent Monetary Policy".
Aus Jun housing finance (no.)
- Aug 8, Last: 1.1%, WBC f/c: –1.0%
- Mkt f/c: 0.0%, Range: -2.0% to 2.0%
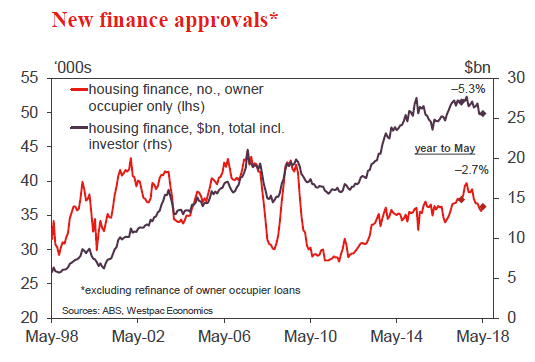
Australian housing finance approvals were firmer than expected in May, the number of owner occupier loans rising 1.1% and the value of investor loans up 0.1% in the month. The result was against the wider 'run of play' for housing markets – auction activity and prices both pointing to a further softening through the middle of the year.
Finance approvals should reconnect with the wider market picture in June although specific indicators are a bit mixed. Industry data covering the major banks suggest seasonally adjusted approvals posted a rise in June, but were much weaker than the ABS figures in May. Other indicators tracking wider mortgage activity look to have better captured the May resilience and point to some softening in June that accelerated in July. Overall we expect owner occupier finance approvals to show a 1% decline with a clearer weakening showing through in July. Note that as well as more stringent lending criteria, some of this will reflect delays due to longer processing times.
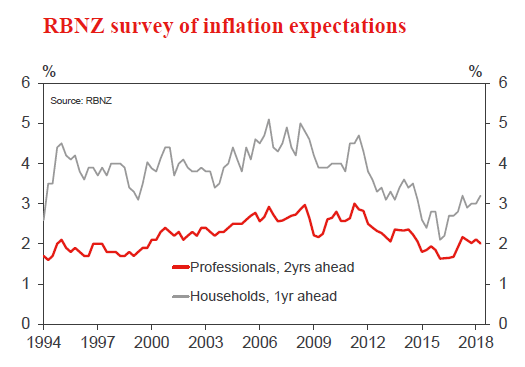
NZ Q3 RBNZ survey of inflation expectations
- Aug 8, Two years ahead, last: 2.01%
The latest RBNZ expectations survey was held soon after the June quarter CPI result. While headline inflation was a touch softer than expected in June, core inflation measures point to a firming in underlying pressures centred on the more persistent non–tradable components. On top of that, there have been some well publicised price increases (e.g. petrol), as well as growing concern about Government policy and rising costs.
Inflation expectations in this and other surveys have lifted from the lows we saw in 2016/17 and are now at levels consistent with the RBNZ's 2% target mid–point. Most other surveys have pointed towards a further firming recently.
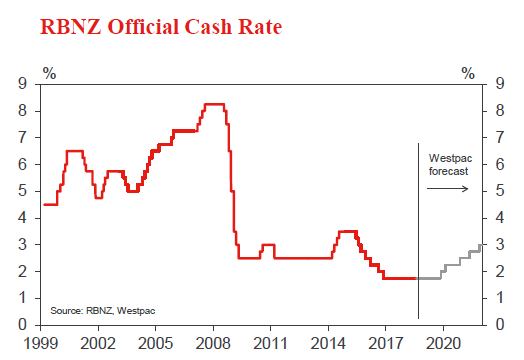
NZ RBNZ Official Cash Rate decision and Monetary Policy Statement
- Aug 9, Last: +1.75%, WBC f/c: +1.75%, Mkt: 1.75%
We expect that the RBNZ will keep the Official Cash Rate unchanged at its August policy meeting. The economy has delivered mixed messages recently, with growth slowing but inflation pressures rising. These forces will broadly offset one another in the RBNZ's thinking.
The RBNZ is likely to retain its policy outlook from recent meetings, and will signal that the OCR is expected to remain at its current low level for a long while. The forecast track for the OCR will likely be unchanged, or perhaps a tiny smidgen lower. We expect the RBNZ to restate that the next move in the OCR could be "up or down".
Like us, markets are primed for a neutral to slightly dovish Statement.
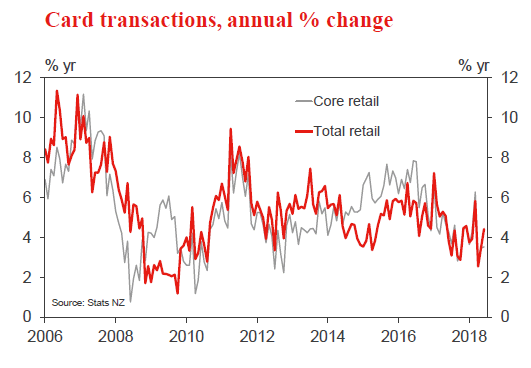
NZ Jul retail card spending
- Aug 10, Last: +0.8%, WBC f/c: +0.6%
Smoothing through month–to–month volatility, the first half of 2018 saw the momentum in spending growth fade, with overall retail spending effectively trending sideways since January. In large part, this was due to the slowdown in the housing market and related changes in household spending appetites.
We expect to see spending picking up again through the middle part of the year, with a 0.6% gain expected in June. This is due to increases in government transfer payments, such as Working for Families payments and the accommodation supplement. Nominal spending levels will also be boosted by increases in fuel taxes (though this will limit spending growth in other areas).
US Jul CPI
- Aug 10, last 0.1%, WBC 0.2%
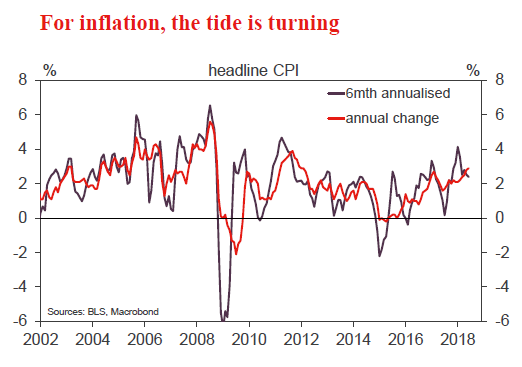
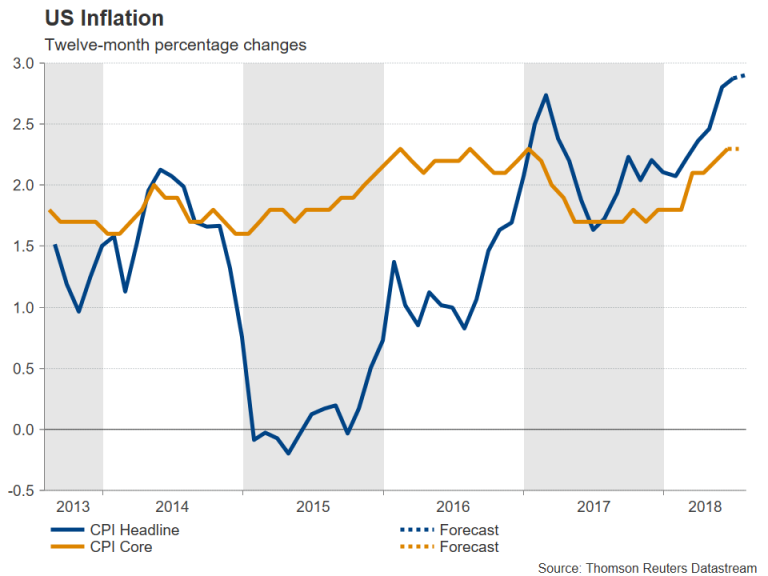
Since February 2018, headline annual CPI inflation has been well in excess of the FOMC's 2.0%yr inflation target, having risen from 2.2%yr at February to 2.9%yr at June. While in part due to energy prices, core inflation (which exclude food and energy) also moved higher, from 1.8%yr to 2.3%yr.
Shortening the time horizon assessed highlights why the FOMC has not been concerned by these well-above target outcomes. Notably, the six-month annulised pace has eased, from 3.6% to 2.4% for headline inflation and 2.5% to 2.3% for core. The three-month metric suggests a further deceleration will occur in coming months, but likely not quite yet. In July, a 0.2% gain is likely to instead hold up the annual rate.
Looking further ahead, the extent to which CPI inflation holds to target will depend critically on the shelter component – a third of the basket. Private measures of rents are pointing to a material slowing, but this is yet to be seen in the CPI detail.
Week Ahead – UK and Japan Next to Report GDP Figures; RBA and RBNZ Rate Decisions Eyed
There will be a continuation of the central bank and Q2 GDP theme in the next seven days as interest rate decisions will be awaited out of Australia and New Zealand, while the United Kingdom and Japan will publish growth figures. Monthly data on trade balance and industrial output will also be in focus, along with Canadian employment and US inflation numbers.
RBA and RBNZ to stand pat again
It will be the turn of the Reserve Bank of Australia and the Reserve Bank of New Zealand to set monetary policy, following decisions from other major central banks in the past two weeks. The RBA will be the first to hold its monetary policy meeting on Tuesday, with no change in rates anticipated. Although recent data from Australia have been fairly strong, there’s been no change in market expectations of how soon the RBA will raise its cash rate. Investors are not presently fully pricing a rate increase until November 2019 and the RBA is not expected to shift from its neutral stance anytime soon as inflation only moved into the Bank’s target band of 2-3% in the second quarter and wage growth remains subdued.
While the RBA will probably maintain its rosy outlook for growth, this is unlikely to provide much support to the Australian dollar, which has been under pressure this week from intensifying Sino-US trade tensions. Nevertheless, aussie traders should be on the standby next week as, apart from the RBA announcement, the Governor Philip Lowe will be taking to the podium on Wednesday, while on Friday, the Bank will publish its quarterly outlook report. In terms of data, June housing finance numbers should be watched on Wednesday.
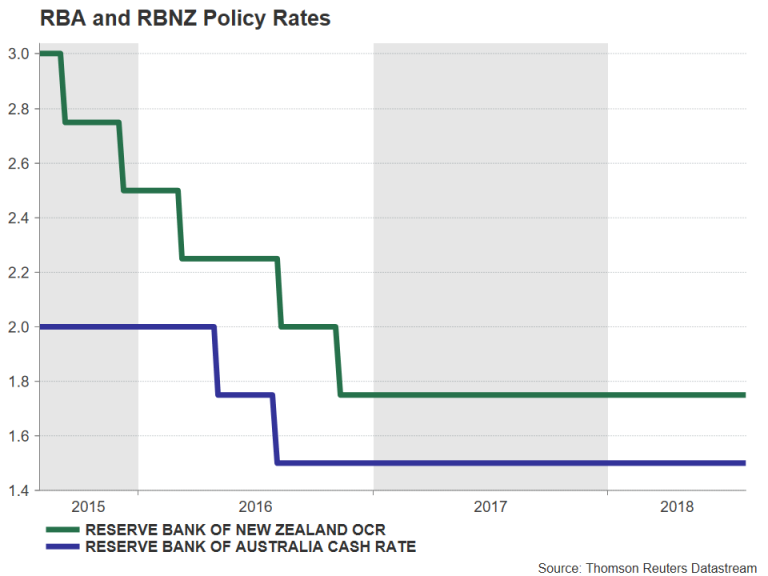
Across the Tasman Sea, the RBNZ decision on Thursday is not expected to generate much excitement either as it too is anticipated to keep rates unchanged. However, while both the RBA and RBNZ have been bound to a neutral mode since 2016, there’s been a bit of divergence recently, with the New Zealand economy showing some unexpected weakness. The RBNZ has even said the next move in rates could be down, though for now, the broad consensus for the next move is an increase. The kiwi could be headed back towards the two-year low of $0.6686 it hit in July if the Governor Adrian Orr maintains a somewhat downbeat view of the economy in his statement, and more importantly, if the Bank lowers its economic forecasts in its quarterly monetary policy statement due the same day.
China’s exports to slow in July
Exports from China had maintained strong growth in June, rising by 11.2% year-on-year. However, the figure was skewed as exporters were front-loading shipments before the $34 billion of US tariffs came into force in July. A mild slowdown is therefore expected in July to 10% when the trade numbers are released on Wednesday. A weaker reading could upset an already fragile Chinese equity market, as well as broader global risk sentiment, as it would suggest US tariffs are hurting demand for Chinese goods. Also out of China next week are the latest producer and consumer price indicators on Thursday.
Japanese economy to return to positive growth
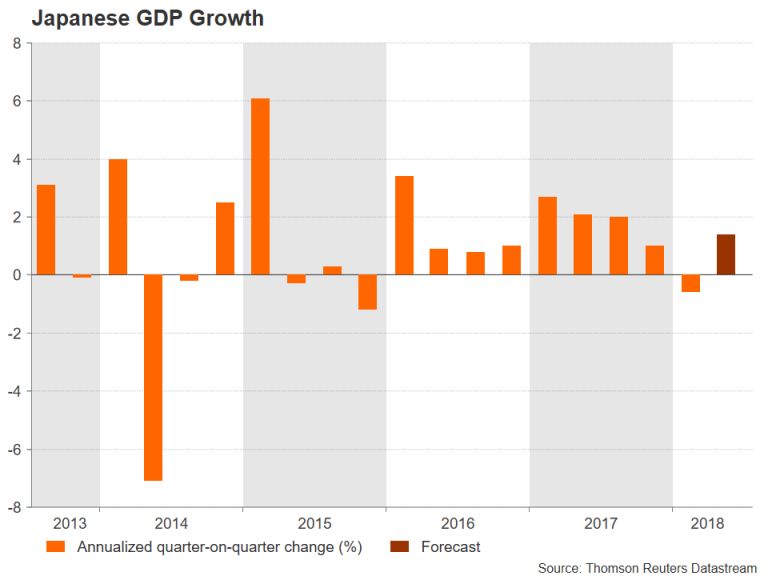
Japan will have a relatively busy week with the spotlight being on the first reading of second quarter GDP growth due at the end of the week. Ahead of that though, household spending and earnings numbers will be looked at on Tuesday. Recent household spending figures have been dreadful, falling during every month of 2018 so far except in January. A turnaround of 1.7% month-on-month is expected in June, which would raise hopes that the pick-up in growth that is currently underway would be sustainable. Wage growth data due the same day could also send positive signals about the economy and the outlook for consumer spending if they maintain the recent uptrend in June. On Thursday, machinery orders for June will be watched for the latest indication on business spending before attention turns to the GDP numbers on Friday.
Japan ended its two years of uninterrupted economic expansion in the first quarter of 2018 when GDP contracted by 0.6% on an annualized basis. However, growth is expected to have bounced back in the second quarter with the economy forecast to have expanded by an annualized 1.4%. Alongside the GDP figures, July corporate goods prices will also be released.
The yen could benefit from any upside surprises in the GDP report after being sold off this week following the disappointment that the Bank of Japan didn’t announce a winding down of its massive asset purchase program when it concluded its two-day policy meeting on Tuesday. A summary of opinions of that meeting will be published on Wednesday.
French and German industrial output to be European focus
It will be a quieter time for the European calendar with the main releases coming from French and German trade and industrial output figures. Starting the week though will be German industrial orders for June and the Eurozone sentix index for August on Monday. German June industrial output will follow on Tuesday together with trade data for the same month. Industrial output in Germany is forecast to have declined by 0.5% m/m in June, indicating the weak patch continued until the very end of the second quarter. France will also release trade figures on Tuesday, with industrial production numbers coming up on Friday.
The euro is unlikely to get much comfort from next week’s data as it found itself once again testing the $1.16 level this week, with any positive surprises expected to provide only a modest lift.
UK GDP to rebound in Q2
Across the English Channel, the UK’s Office for National Statistics (ONS) will publish its first estimate of second quarter growth. There will be a flurry of data releases on Friday as the GDP numbers will be accompanied by monthly indicators on industrial, manufacturing and services output, as well as trade figures for June.
Following recent changes by the ONS, the GDP data will include both quarterly and monthly series. The UK economy is forecast to have grown by 0.4% quarter-on-quarter in the three months to June, with the annual rate edging up to 1.3%. If validated, the quarterly figure would represent a moderate acceleration on the prior 0.2% rate. On a month-on-month basis, GDP is expected to have expanded by 0.2% in June.
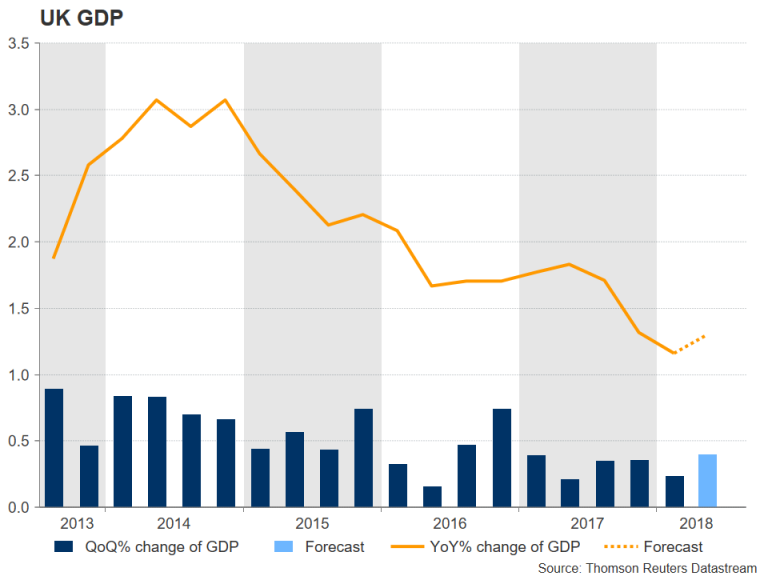
Looking at the production sectors, industrial and manufacturing output are projected to have increased by 0.4% and 0.3% m/m, respectively, in June.
The pound could find some reassurance from Friday’s data if they confirm that the slowdown in the first quarter was temporary and that further rate increases by the Bank of England would not be totally unwarranted.
US inflation and Canadian employment eyed in North America
After an eventful week dominated by top tier data and the Fed policy meeting, dollar traders might be able to catch a break next week as the only highlight will be the July CPI report on Friday. Prior to that, producer prices will be viewed first on Thursday, where the annual rate of PPI is forecast to remain at 3.4% in July. The headline rate of CPI, meanwhile, is anticipated to hold steady at 2.9% y/y in July, with the core rate also staying unchanged at 2.3%.
North of the border, the July employment report will be Canada’s leading data point. The last jobs report showed a big jump in employment in June and has been followed by even more robust data for the Canadian economy, with everything from GDP, retail sales and inflation numbers beating expectations. Another strong set of employment figures on Friday would pave the way for one more rate hike by the Bank of Canada in the Autumn and help drive the loonie beyond this week’s 7-week peak of C$1.2971 per US dollar.
EURUSD Outlook: Overall Solid US Jobs Data/Negative Techs Keep Bears in Play
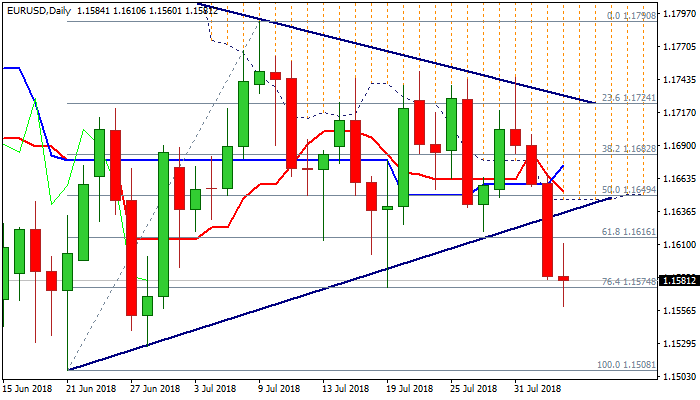
The Euro showed mild reaction on weaker than expected US NFP data (July 157K vs 193K f/c and upward-revised June figure from 213K to 248K). The pair ranged between 1.1560 (new five-week low) and 1.1610 as markets were digesting results of US labor data. Disappointing NFP numbers (although well within levels that are seen positive) were accompanied with average hourly earnings and unemployment which came in line with expectations (0.3% & 3.9% respectively), marking overall result positive. Solid labor sector figures would keep the Fed on the front foot for further rate hikes, as the central bank kept the door open for two more hikes this year. Overall picture was improved by better than expected US trade data as trade gap narrowed to $46.3B in July vs forecast for $46.5B. The sentiment could be soured by weaker than expected US Services PMI data (July 56.0 vs 56.2 f/c / prev). The pair maintains negative tone, following strong fall in past three days, and is on track for the second weekly close in red, which reinforces negative outlook. Bearish daily techs support scenario, however, oversold conditions may result in consolidation before bears continue towards key near-term support at 1.1508 (21 June low), violation of which would expose next target at 1.1447 (50% of 1.0340/1.2555 ascend).
Res: 1.1616; 1.1646; 1.1662; 1.1675
Sup: 1.1560; 1.1527; 1.1508; 1.1447
US: Job Growth Slows, but Labor Market Continues to Tighten
Payrolls rose 157,000 in July, while gains in May and June were revised up. Along with a pickup in wages and lower unemployment, the labor market continues to strengthen and supports the Fed's plan to hike next month.
Revisions Take the Edge Off of the Headline Miss
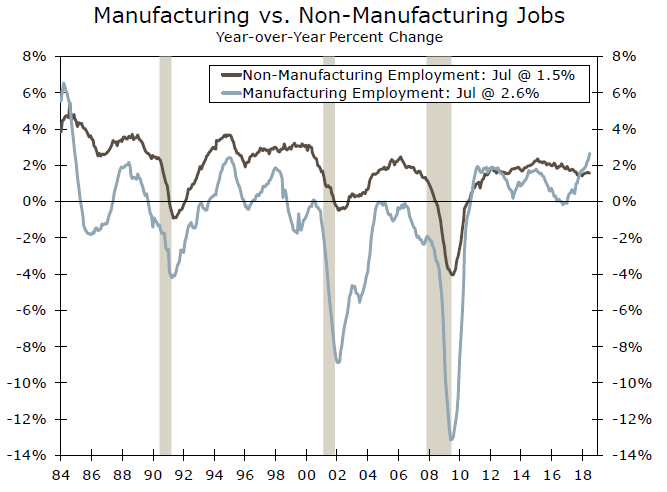
Employment growth slowed in July, with employers adding 157,000 new jobs. July's gain was somewhat weaker than expected, but came on the heels of a net upward revision of 59,000 to May and June. Healthcare, leisure & hospitality and temporary employment posted notable gains. Manufacturing also stood out with 37,000 jobs added—the largest monthly increase this year. While the evolving trade picture has manufacturers concerned about costs and profits, the heady pace of hiring suggests that the sales outlook among the nation's manufacturers has not deteriorated (top chart).
Wages Trek Higher, Consistent with Tighter Labor Market
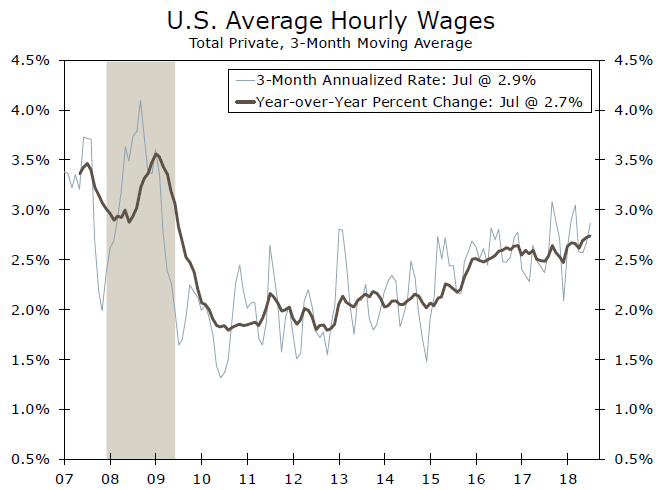
Average hourly earnings rose 0.3 percent over the month, keeping the yearago change at 2.7 percent (middle chart). That is up from the 2.5 percent pace this time last year and, along with the stronger Employment Cost Index reading reported earlier this week, shows wage pressures have begun to intensify as the labor market has tightened.
The income proxy, which combines aggregate hours worked and average hourly earnings, is rising at a 5.1 percent three-month annualized pace and points to some strengthening in consumer spending from the pace registered over the first half of the year.
Unemployment Resumes Its Downward Trend
Even with today's miss, the trend in payroll growth remains solid. Employers have added an average of 215,000 jobs per month since the start of the year, which is up from an average of 182,000 in 2017. That is still plenty strong enough to put further downward pressure on the unemployment rate, which fell back to 3.9 percent in July. Employment growth is running at about twice the pace of the labor supply (bottom chart).
Improved participation has helped support growth in the labor force as the working-age population has stalled out. The increasing availability of jobs and rising wages have encouraged more workers to join the labor force. A record 71 percent of labor force entrants are becoming employed within one month. The workers that have been pulled into the labor force has helped keep the labor force participation rate generally steady despite the aging of the population shaving off about a ¼ percentage point each year. Overall labor force participation was flat in July, but ticked up for prime age workers (ages 25-54). Slack continues to diminish both inside and outside the labor force, with the U-6 unemployment rate, which includes under-employed and marginally-attached workers, falling to the lowest rate since 2001.
On balance, today's report is unlikely to change the Fed's assessment that "the labor market has continued to strengthen," as the overall trend in hiring remains strong, labor availability continues to decline and wages are moving higher.
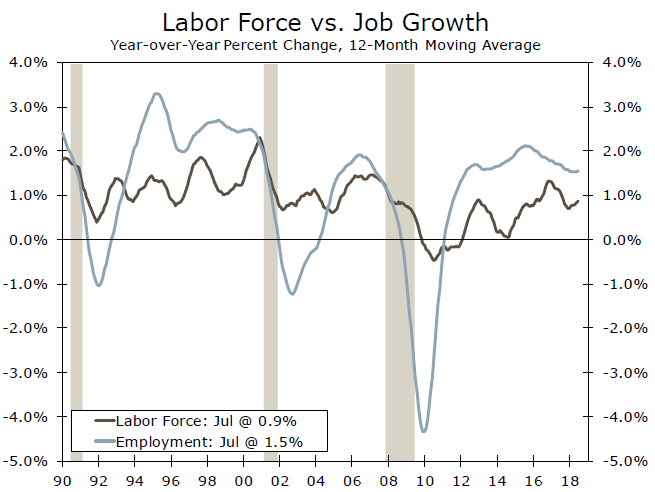
U.S. July Employment Growth Slows
Highlights:
- July payroll employment gains slowed to 157k after upwardly revised increases the previous two months of 248k (213k previously) and 268k (244k).
- The separate, and more volatile, household survey indicated a stronger employment gain in July of 389k which, in conjunction with a more modest 105k gain in the labour force, lowered the unemployment rate to 3.9% after unexpectedly rising 0.2% in June to 4.0%.
- Despite a low unemployment rate, the annual increase in wages remained unchanged at 2.7%.
Our Take:
July’s employment gain of 157k was below market expectations of a 192k increase though the shortfall was more than offset by upwardly revised gains of 248k (213k previously) and 268k (244k) in June and May, respectively. As well, with labour markets at capacity, the slowing reflects more a supply issue of a diminishing pool of available skilled workers rather than an indication of slackening demand by businesses. Confirmation of tightening labour markets was conveyed in today’s report by the July unemployment rate dropping back down to 3.9% after unexpectedly jumping 0.2 percentage points in June to 4.0%. The Fed’s long-run expected range for the unemployment rate, widely viewed as its assessment of full employment, is estimated at a higher 4.3% to 4.6%.
The Fed is likely to view today’s employment report as reinforcing its statement following Wednesday’s policy meeting that labour markets remain strong. Though the central bank opted to leave the fed funds range unchanged at 1.75% to 2.00%, it also indicated that further gradual increases in official rates will be required going forward to insure that inflation remains close to its 2% objective. Our expectation is that gradual tightening will imply 25 basis point-hikes each quarter through the end of next year with the fed funds range eventually rising to 3.25% to 3.50%. The fed’s statement indicated that the risks remained balanced. Though not explicitly stated, rising trade protectionism is likely viewed as the main downside risk with continued strong consumer response to recent tax reductions presenting an offsetting upside risk.
Canada’s Trade Deficit Gapped Lower in June
Highlights:
- June’s $0.6 billion deficit is the smallest since January 2017.
- Exports rose 4.1% in June though roughly half of that increase was price-related. Imports edged down only slightly.
- Non-energy export volumes rose for the third time in four months and were up strongly in Q2. But the level itself remains in the same range seen over the last few years.
Our Take:
We thought steel and aluminum tariffs would be the story of this morning’s trade report, but strong export growth in most other sectors swamped the impact of those new duties. The trade deficit shrank dramatically to $0.6 billion in June from $2.7 billion in May—a much better outcome than markets expected. The smaller shortfall almost entirely reflected a 4% increase in exports. About half of that came from energy (largely price-driven) and aircraft shipments, but other industries also recorded solid gains. That caps off an impressive quarter for Canadian exporters, with volumes up a whopping 16% annualized in Q2—the strongest pace in four years. We thought trade would add solidly to growth in the second quarter but today’s data has us nearly doubling the expected contribution. Our current monitoring for 3% GDP growth in Q2 includes about a 2 percentage point add from net exports—a welcomed change following three consecutive quarters of drag from trade.
Today’s report is the latest in a string of upside surprises that include May’s GDP data and June inflation numbers. Exports are key to the Bank of Canada’s forecast for sustained GDP growth over the coming year, so June’s data will certainly please them. This adds to the case for the BoC to raise rates again in the near-term, though we expect their gradual approach to tightening will see them hold off until October. That would also give them some time to further evaluate the impact of tariffs and trade uncertainty. In July they assumed steel and aluminum tariffs would lower the level of export volumes by 0.6 percentage points, mostly over the second half of this year. If that is accurate, we could see further declines in steel and aluminum exports in the coming months.
Sunset Market Commentary
Markets
Bond trading was quite volatile today. Core bonds initially profited from volatile Chinese markets. The German Bund outperformed US Treasury, benefitting from a classic risk hedge. Markets stumbled on what was called a key Italian budget meeting. However, the BTP sell off in favour of the Bund proved rather premature as markets realized the Italian budget plan isn’t due until September. In the afternoon, the picture was more diffuse. Bonds lost further ground after the Chinese central bank stepped in to counter bearish bets on the country’s currency. The PBOC’s move prompted a sudden risk-on mood only to reverse again after China said it is ready to impose new tariffs on US imports should the US follow through with its latest trade threats. US payrolls were close to expectations and triggered no significant market reaction. At the time of writing the US and German yield curve bear flatten with yield changes varying from 1-2 bps (2-y) to 2-3 bps (10-y). Except for Italy (+5bps), intra-EMU spreads were close to stable.
The dollar initially maintained the benefit of the doubt attracting safe haven flows as Chinese markets traded volatile going into the weekend. The picture in Europe was mixed. Equities performed rather well. At the same time, Italy spreads widened, putting additional pressure on the euro. EUR/USD dropped to the 1.1565 area. The dollar returned intraday gains going into the payrolls. Global sentiment improved, at least temporarily, as China raised the RRR on FX forwards, an indication that it wants to limit CNY speculation. The US payrolls were very close to expectations. The report again failed to give any clear guidance for USD trading. Just before the publication of the payrolls, China said it plans tariffs on $60bln of US imports in case the US would implement trade threats. The announcement hindered the improvement in global risk sentiment, but had only limited impact on USD trading. USD/JPY ceded some ground after the announcement. The pair dropped below 111.50. EUR/USD trades currently in the 1.1575 area.
The scenario for sterling trading was little changed from previous days. EUR/GBP hovered in a tight range near the 0.89 big figure. Cable followed the intraday swings of the dollar. The UK services PMI declined from 55.1 to 53.6 (54.7 was expected). The report suggests UK growth momentum might ease going into the key phase of the Brexit process. Even so, the reaction of sterling was limited. EUR/GBP gained a few ticks, but the move had no strong legs, amongst others, as the euro was also in the defensive at that time. In a broader perspective, markets already knew that sterling won’t get any BOE interest rate support soon. Today’s PMI’s only confirmed this scenario. EUR/GBP is holding near 0.89. Cable hovers around the 1.30 pivot.
News Headlines
US payrolls were close to expectations. The US economy added 159k jobs in July. 193k additional jobs were expected, but May and June numbers were upwardly revised adding an extra 59k jobs. Unemployment rate declined to 3.9% from 4% in June. Strong labour market still has only a modest impact on wage growth (2.7% y/y), unchanged from June.
China’s central bank announced that financial institutions trading in some FX forwards will be subject to a reserve requirement of 20%. The Bank stepped in to halt the rally on its currency, as the yuan faced substantial losses over the previous weeks in the wake of persisting trade tensions. On the other hand, China also detailed how it plans to retaliate against new possible US tariffs. The country plans to impose $60 bln of import tariffs on US goods if the US implements recently announced plans.
Italy’s senior ministers met today to discuss next year’s budget. Deputy PM Salvini said the budget would include tax cuts and pension reform, which would likely increase Italy’s large public debt, unless it’s matched with spending cuts. Worried investors pushed the Italian 10-year yields (temporarily?) north of the 3% level today.
EUR/JPY Mid-Day Outlook
Daily Pivots: (S1) 129.83; (P) 129.63; (R1) 130.02; More....
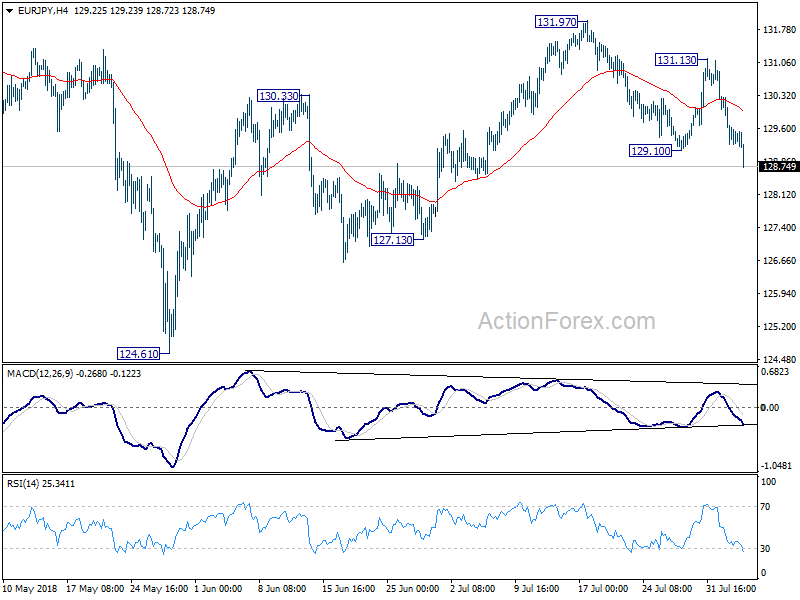
EUR/JPY drops to as low as 128.72 so far today. The break of 129.10 indicates resumption of fall from 131.97. It also revives the case that corrective rise from 124.61 has completed with three waves up to 131.97. Intraday bias is now on the downside for 127.13 support first. Break there will pave the way to 124.61 low. ON the upside, break of 131.13 resistance is needed to confirm completion of the fall from 131.97. Otherwise, outlook will remain bearish in case of recovery.
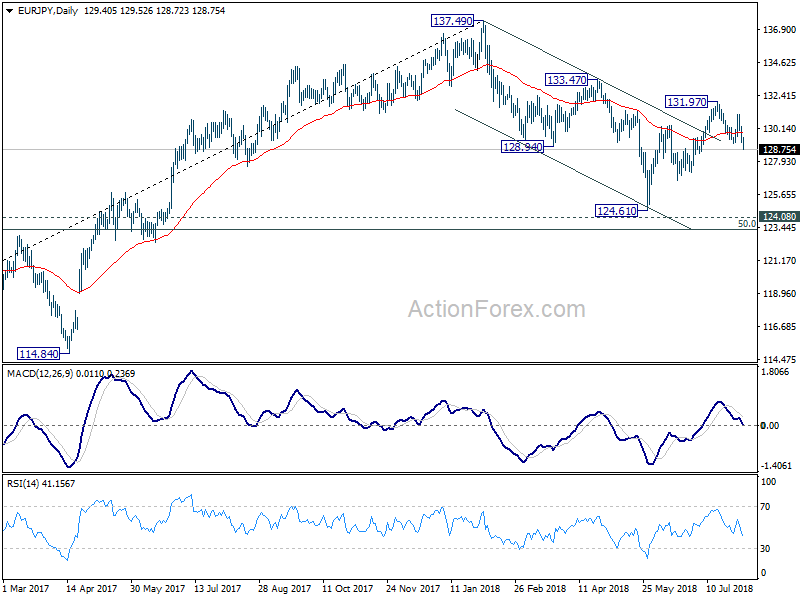
In the bigger picture, for now, medium outlook remains cautiously bullish. the three wave structure of the fall from 137.49 to 124.61 argues that it's a correction. Also, 124.08 key resistance turned support was defended. Break of 133.47 resistance will affirm the bullish case that rise from 109.03 (2016 low) is still in progress for another high above 137.49. And this will remain the favored case as long as 127.13 support holds.
GBP/JPY Mid-Day Outlook
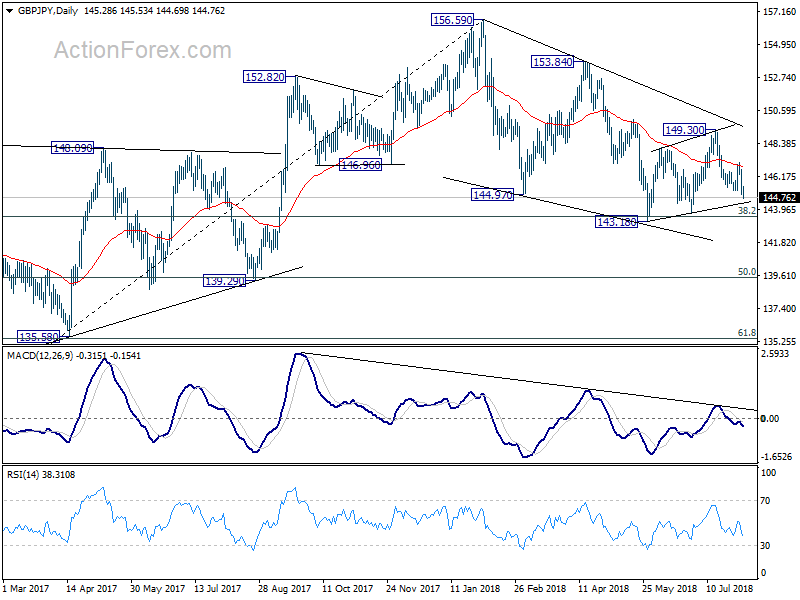
Daily Pivots: (S1) 144.67; (P) 145.68; (R1) 146.35; More...
GBP/JPY's fall extends to as low as 144.69 so far and intraday bias remains on the downside for 143.18 low. As noted before, consolidation pattern from 143.18 has completed with three waves up to 149.30 already. Break of 143.18 will extend larger fall from 156.69 to key support level at 139.29/47. On the upside, above 145.53 minor resistance will turn intraday bias remains neutral first. But near term outlook will stay bearish as long as 147.13 resistance holds.
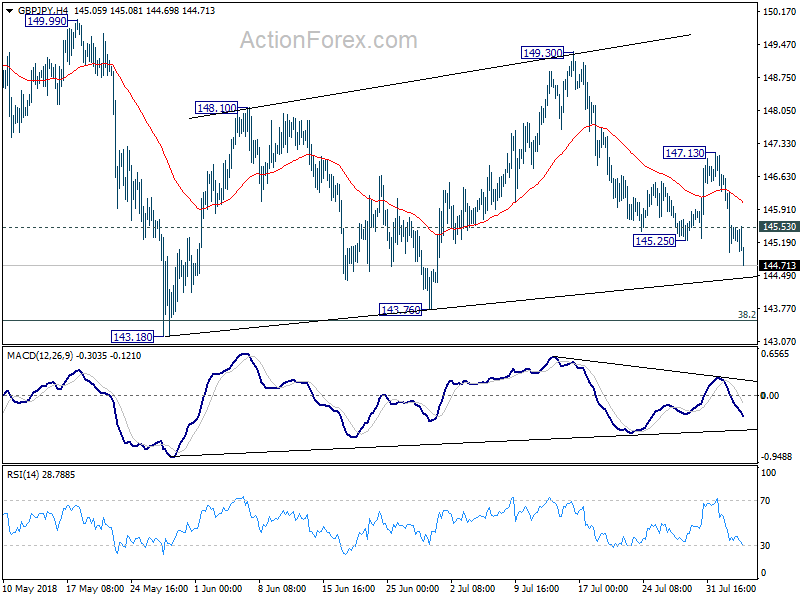
In the bigger picture, decline from 156.59 is seen as a corrective move. In case of another fall, strong support should be seen above 139.29 cluster support (50% retracement of 122.36 to 156.59 at 139.47) to contain downside and bring rebound. Meanwhile, break of 153.84 should confirm that the correction is completed and target 156.59 and above to resume the medium term up trend.