Sample Category Title
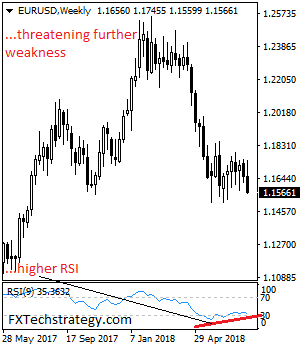
EURUSD – Bearish, Retains Downside Pressure
EURUSD - The pair looks to weaken further as it holds on to its downside pressure. On the upside, resistance comes in at 1.1600 level with a cut through here opening the door for more upside towards the 1.1650 level. Further up, resistance lies at the 1.1700 level where a break will expose the 1.1750 level. Conversely, support lies at the 1.1500 level where a violation will aim at the 1.1450 level. A break of here will aim at the 1.1400 level. Below here will open the door for more weakness towards the 1.1350. All in all, EURUSD faces further downside pressure.
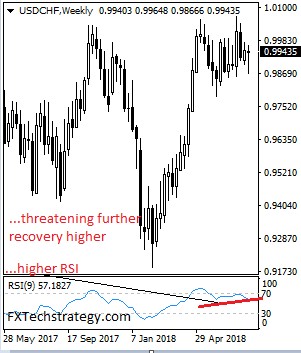
USDCHF – Rejects Lower Prices, Recovers Higher
USDCHF - The pair looks to strengthen further in the new week. On the downside, support lies at the 0.9900 level. A turn below here will open the door for more weakness towards the 0.9850 level and then the 0.9800 level. On the upside, resistance resides at the 1.0000 level where a break will clear the way for more strength to occur towards the 1.0050 level. Further out, resistance comes in at the 1.0100 level. Above here if seen will turn attention to 1.0150. All in all, USDCHF faces further upside pressure
Eco Data 8/6/18
[php_everywhere instance="1"]
Forex Forecast and Cryptocurrencies Forecast
First, a review of last week’s forecast:
EUR/USD. The past week was filled with events, which at another time could initiate quite strong movements in the market. But not now, not at the height of the holiday season. We did not expect any surprises either from the data on the Eurozone GDP or from the values of the consumer price index. There was a little hope for the US Federal Reserve's decision on the interest rate and on the publication of data on the US labor market, but there were no special volatility outbursts there either. Even the drop in the NFP by 36.7% (from 248K to 157K) did not impress the market.
As a result, the situation was as had been expected by many experts: taking into account the standard backlash, the pair stayed within the two-week zone 1.1575-1.1750, reaching a maximum of 1.1745, then groping for the local bottom at 1.1560 and finally ending the five-day session at the mark 1.1567;
GBP/USD. The future of the British pound was not encouraging, even despite the Bank of England's possible increase in the interest rate - 65% of experts considered that the GBP/USD would continue its decline to the zone of 1.3000.
This prediction turned out to be absolutely correct. On the eve of raising the rate, the pound grew slightly. Then, as expected, on Thursday, August 2, the regulator lifted it from 0.50% to 0.75%. But then the accompanying commentary made it clear that one should not expect another increase in the foreseeable future - they say, the economy is not all right, and there are problems with the Brexit. As a result, the pair turned around and quickly fell to the horizon 1.2975. And it met the end of the week's session exactly where the experts expected, at 1.3000;
USD/JPY. The report on the monetary policy of the Bank of Japan, collapsed the yen, instead of strengthening it. The main theses from its head Haruhiko Kuroda speech were interpreted by the market as the intention to preserve ultra-soft policy and to stimulate the weakening of the Japanese currency by increasing the yield of 10-year government bonds.
As a result, the USD/JPY quotes jumped to 112.15. However, the pair did not manage to consolidate at this height and, having gone down about 90 points, it finished the week at the level of 111.25;
Cryptocurrencies. This market was controlled by the bears for the whole week. The fact that bitcoin and major altcoins were recently overbought sided with the bears. The absence of positive news from regulators and market makers did not help the growth either.
As a result, the BTCUSD fell by $1,000, losing about 12% during the week, and reached the mid-July value around $7,280 per coin.
The Ethereum lost even more, about 14%, breaking at some point the support at $400. Litecoin lost 11%, but the ripple was more stable: having fallen by 7%, it then turned and gained back 2.5%;
As for the forecast for the coming week, summarizing the opinions of a number of analysts, as well as forecasts made on the basis of a variety of methods of technical and graphical analysis, we can say the following:
EUR/USD. No significant events that could seriously affect the mood of the market are expected next week. Many indicators indicate a virtually total lack of activity. MACD on D 1 almost horizontally moves slightly below the zero mark for the fourth week running. Approximately 85% of all oscillators are painted red, but the remaining 15% are already signaling the pair is oversold.
As for the experts, 70%, supported by graphical analysis, still believe that the pair still should reach the lower boundary of the medium-term side channel 1.1505-1.1850, and only then go up. The remaining 30% have voted for the move in the narrower three-week corridor 1.1575-1.1750;
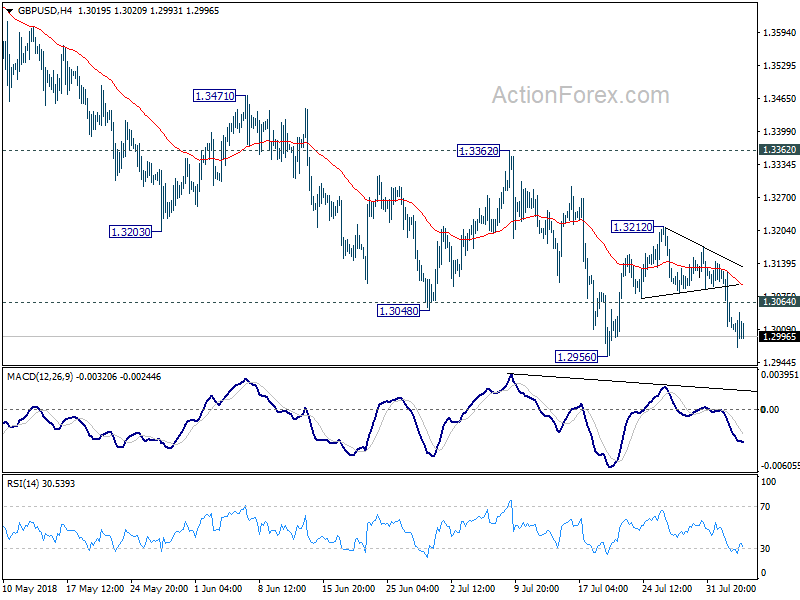
The scenario for the future of the British pound is also negative. Most analysts (70%) are waiting for the pair GBP/USD to fall to the low of the summer of 2017 in the zone of 1.2800. This development is supported by all oscillators (except one) and graphical analysis on H4 and D1. The nearest support is 1.2955, the next one is 100 points lower.
An alternative point of view is represented by 30% of experts who believe that the pair has moved to a lateral movement in channel 1.2955-1.3210. The nearest resistance is in the area of 1.3100;
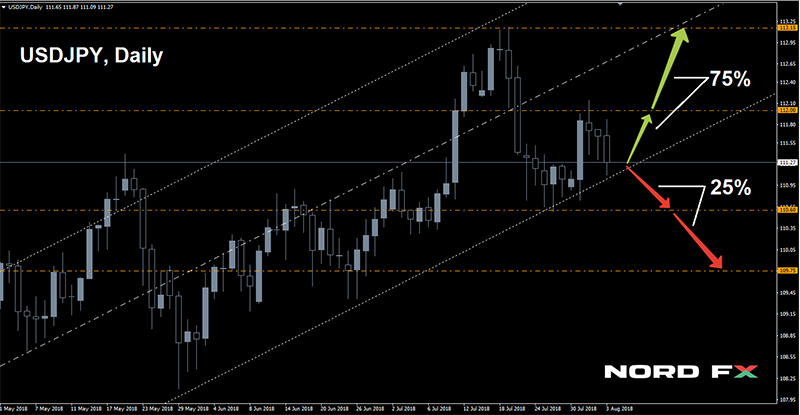
USD/JPY. here most of the experts (75%) support the strengthening of the dollar .Despite the fall of the pair at the end of last week, it stayed within the medium-term rising channel, which began at the end of this March, and is now at the line of its support .The immediate goal for the pair will be the height of 112,000, the ultimate goal - 113.15.
If the the supporters of the bears win, the pair is expected to march to the south. In this case, the support is at levels 110.60, 110.30 and 109.75. It should be noted that, when moving from a weekly forecast to a forecast until the end of the summer, the number of supporters of such a scenario is growing among analysts from 25% to 45%.
The compromise version is offered by graphical analysis: first a decline to the level of 110.60, and then rise to the level of 112.00;
Cryptocurrencies. Supporters of the Elliot wave theory can see the end of the 5th rising wave of the BTC/USD in the July 25 maximum. Thus, the subsequent fall is an impulse wave A, after which the market expects a corrective wave B and a rise to the zone of 7,800-8,000. The most optimistic goal for the first half of August is to take the height of $10,000.
However, the main indicators - both trend and volume indicators, as well as oscillators - do not yet give explicit signals for the trend change on timeframes D1 and W1. Therefore, in case the height $7,300 is broken down, it is possible to decline to the horizon $6,700. The strongest support is in the $6,000-6,100 zone - this is the level when mining becomes almost unprofitable.
According to one of the theories, one of the main reasons for the fall in quotes in 2018 in many respects are the miners. Their increased number resulted in a significant complication of the mining algorithm. And, as the price of bitcoins declined, and the profitability of mining was reduced, the owners of crypto farms began to get rid of the stocks of the coins they had mined, thus rendering themselves a truly bad service.
EUR/USD Weekly Outlook
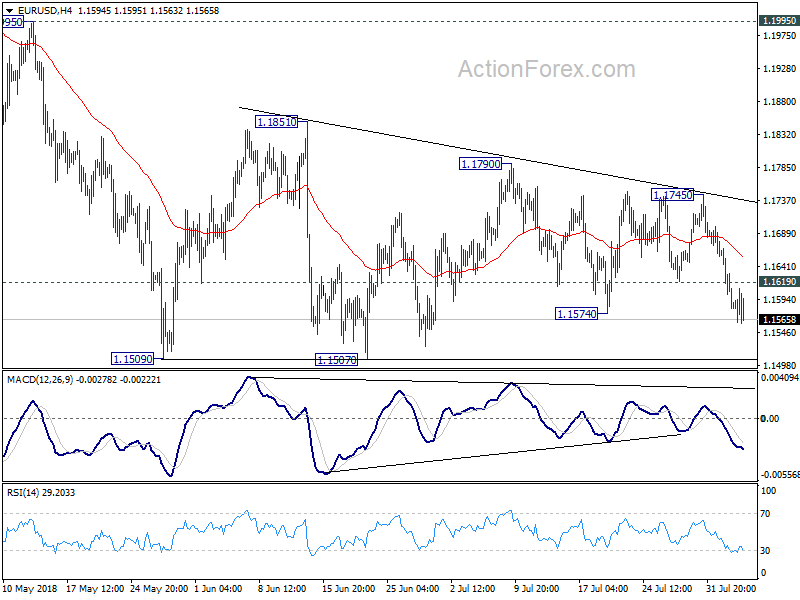
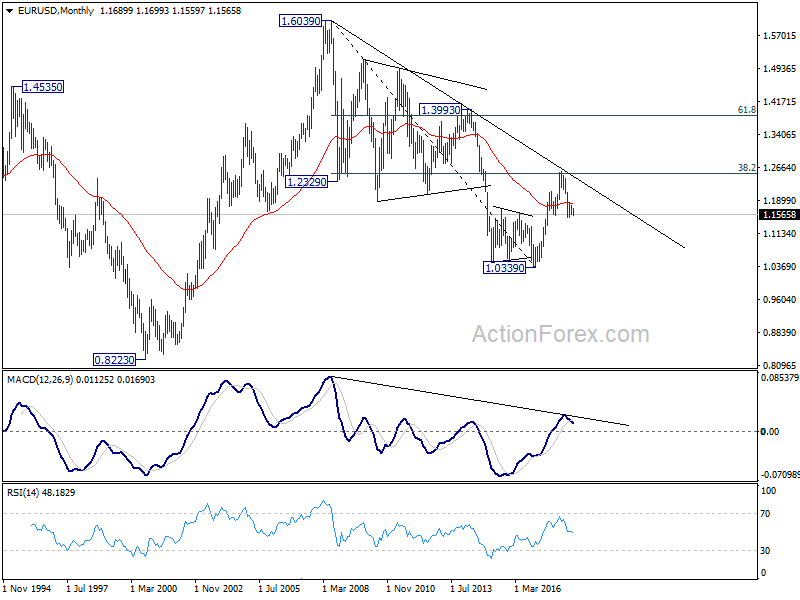
The breach of 1.1574 support last week is tentatively treated as sign of downside breakout and down trend resumption. Initial bias is cautiously on the downside this week for 1.1507 support. Break there will resume larger down trend from 1.2555 through retracement of 1.0339 to 1.2555 at 1.1447. On the upside, however, above 1.1619 will delay the bearish case and extend the consolidation from 1.1509 with another rebound instead.
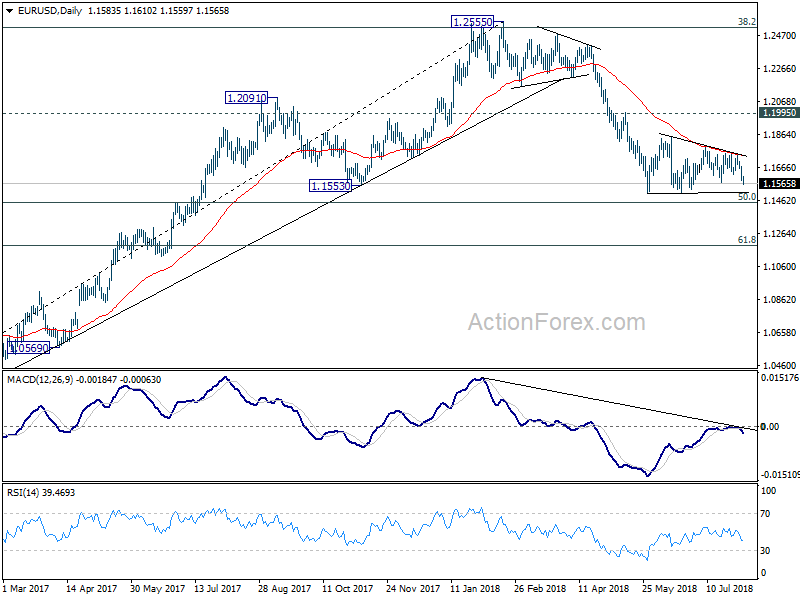
In the bigger picture, EUR/USD was rejected by 38.2% retracement of 1.6039 (2008 high) to 1.0339 (2017 low) at 1.2516. And, a medium term top was formed at 1.2555 already. Decline from there should extend further to 61.8% retracement of 1.0339 to 1.2555 at 1.1186 and below. For now, even in case of rebound, we won't consider the fall from 1.2555 as finished as long as 1.1995 resistance holds.
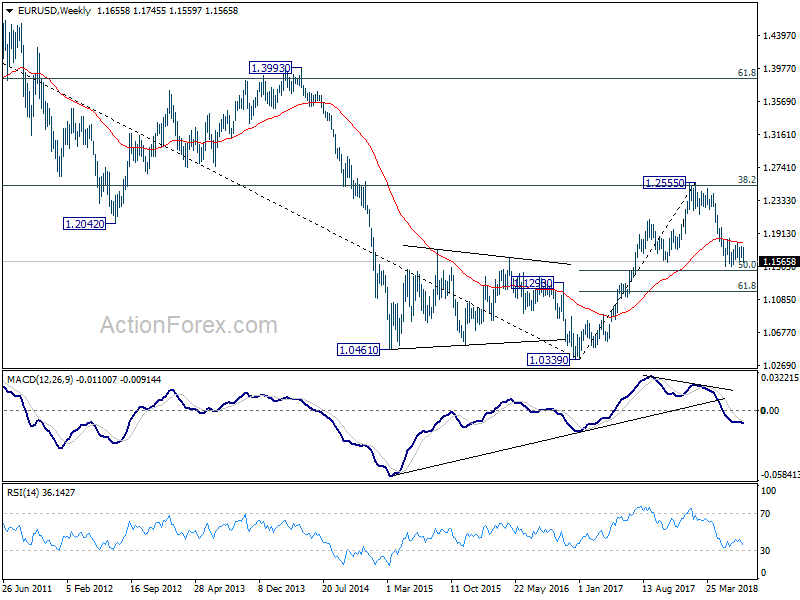
In the long term picture, the rejection from 38.2% retracement of 1.6039 to 1.0339 at 1.2516 argues that long term down trend from 1.6039 (2008 high) might not be over yet. EUR/USD is also held below decade long trend line resistance. Sustained trading below 55 week EMA adds bearishness to the case. Sustained break of 61.8% retracement of 1.0339 to 1.2555 at 1.1186 should at least bring a retest on 1.0339 low.
USD/JPY Weekly Outlook
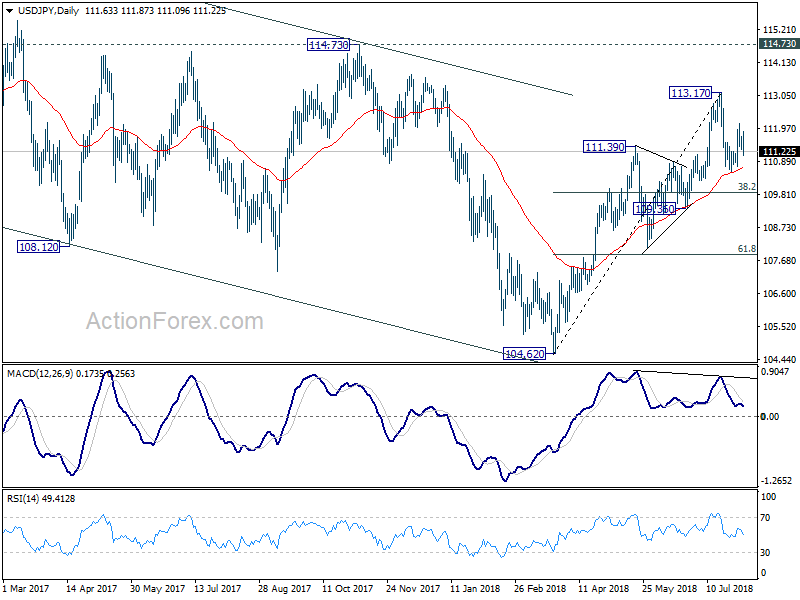
USD/JPY recovered to 112.13 last week but reversed since then. The development suggests that correction from 113.17 is in progress and could have started the third leg. Initial bias is mildly on the downside for 110.58 and below. But after all, we'd expect strong support from 38.2% retracement of 104.62 to 113.17 at 109.90 to bring rebound. On the upside, above 112.14 will target a test on 113.17 high.

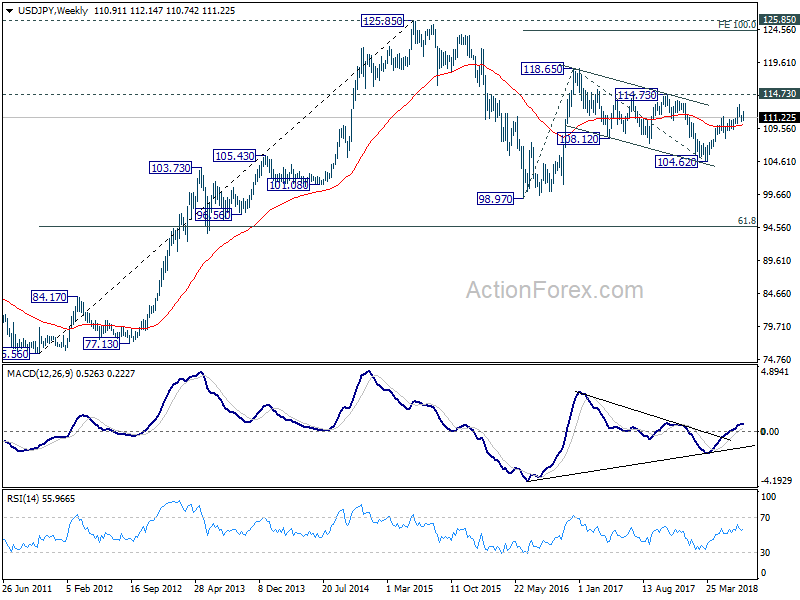
In the bigger picture, corrective fall from 118.65 (2016 high) should have completed with three waves down to 104.62. Decisive break of 114.73 resistance will likely resume whole rally from 98.97 (2016 low) to 100% projection of 98.97 to 118.65 from 104.62 at 124.30, which is reasonably close to 125.85 (2015 high). This will stay as the preferred case as long as 109.36 support holds.
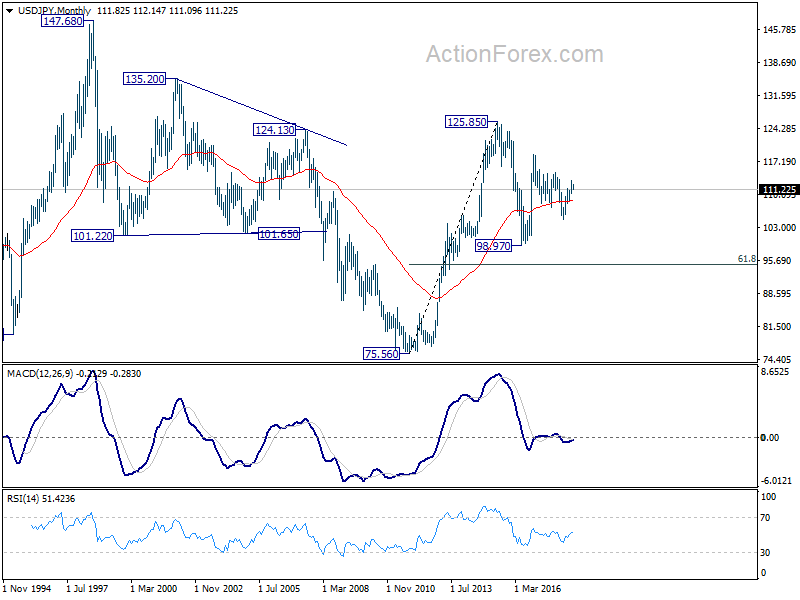
In the long term picture, the rise from 75.56 (2011 low) long term bottom to 125.85 top is viewed as an impulsive move, no change in this view. Price actions from 125.85 are seen as a corrective move which could still extend. In case of deeper fall, downside should be contained by 61.8% retracement of 75.56 to 125.85 at 94.77. Up trend from 75.56 is expected to resume at a later stage for above 135.20/147.68 resistance zone.
GBP/USD Weekly Outlook
GBP/USD's sharp decline last week suggests that corrective rebound from 1.2956 has completed at 1.3212 already. Initial bias stays on the downside this week for 1.2956. Firm break there will resume larger decline from 1.4376 for 1.2874 fibonacci level next. On the upside, above 1.3064 minor resistance will possibly extend the correction from 1.2956 with another rebound through 1.3212. But even in that case, upside should be limited by 1.3362 resistance to bring larger decline resumption eventually.
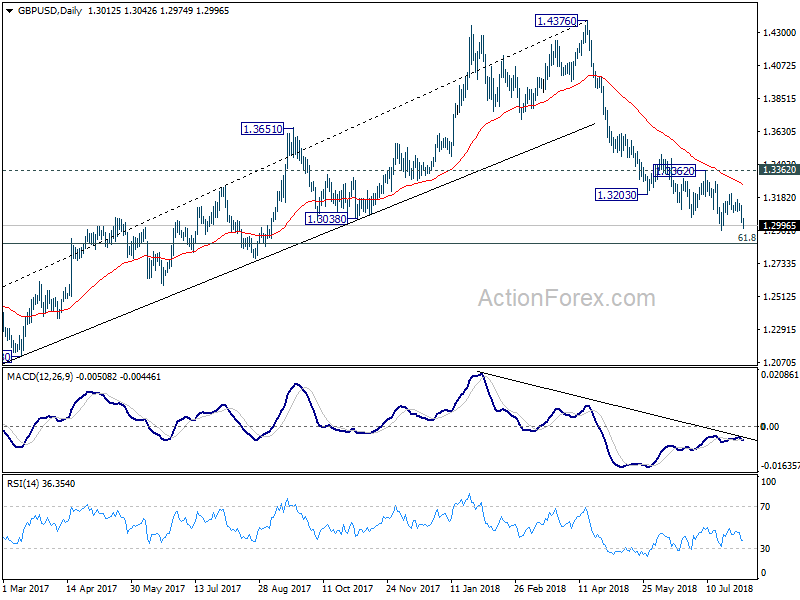
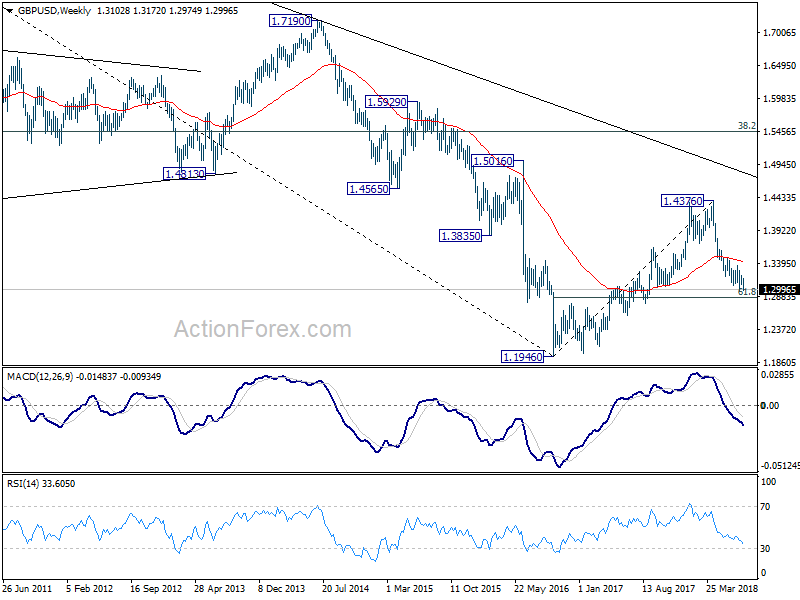
In the bigger picture, whole medium term rebound from 1.1946 (2016 low) should have completed at 1.4376 already, after rejection from 55 month EMA (now at 1.4141). Fall from 1.4376 should extend to 61.8% retracement of 1.1946 (2016 low) to 1.4376 at 1.2874 next. Decisive break of 1.2874 will raise the chance of long term down trend resumption through 1.1946 low. On the upside, break of 1.3362 resistance is needed to be the first indication of medium term bottoming. Otherwise, outlook will remain bearish even in case of strong rebound.
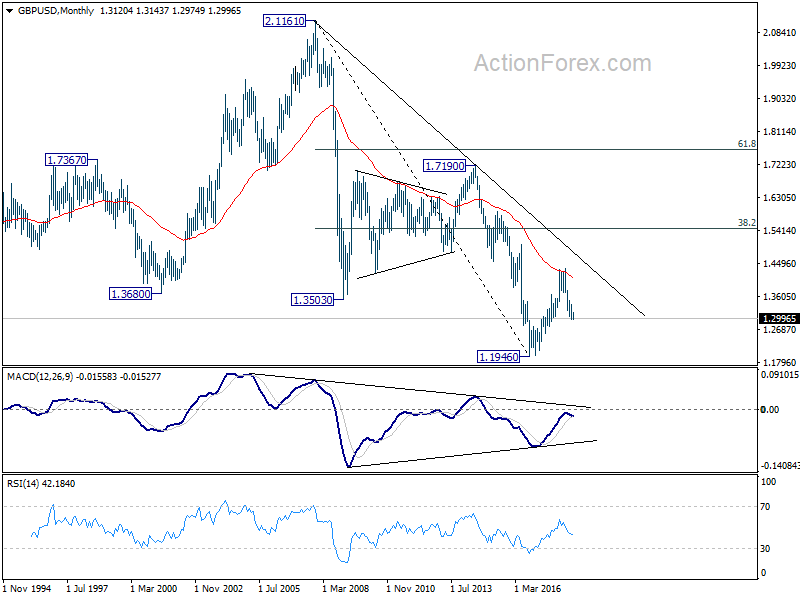
In the longer term picture, rise from 1.1946 (2016 low) is viewed as a corrective move, no change in this view. Rejection from 55 month EMA argues that it might be completed already. Larger down trend from 2.1161 (2007 high) could extend to a new low. This will now be the preferred case as long as 1.4376 resistance holds.
USD/CHF Weekly Outlook
USD/CHF rebounded to as high as 0.9964 last week but failed to break through 0.9977 resistance yet. Indeed, upside momentum diminished as seen in 4 hour MACD too. Initial bias stays neutral this week first. On the upside, break of 0.9977 will suggest that the pull back from 1.0067 has completed. And that will bring retest of 1.0067 first. Decisive break there will resume larger rally from 0.9186. On the downside, below 0.9866 will extend the fall from 1.0067 through 0.9856 to 0.9787 support. As price actions from 1.0056 are seen as a corrective pattern, downside should be contained by 38.2% retracement of 0.9186 to 1.0056 at 0.9724 to bring rebound.
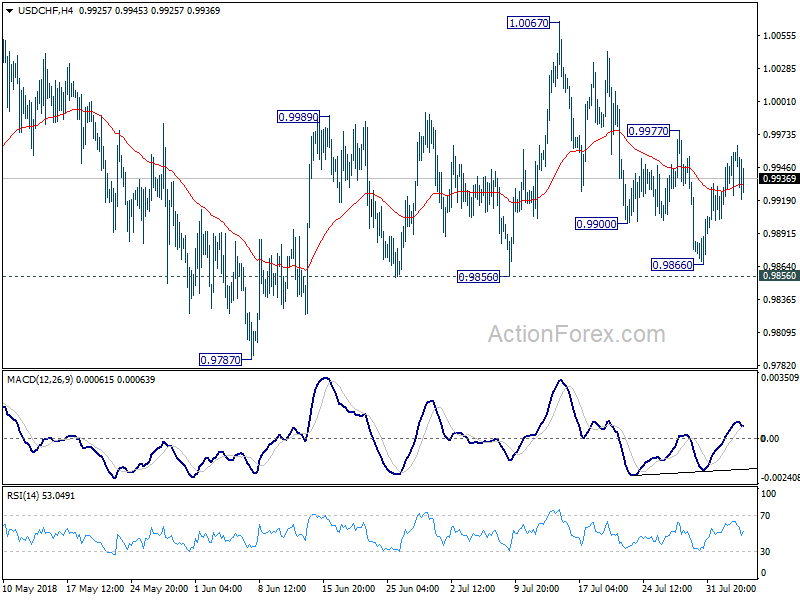
In the bigger picture, current development suggests that the consolidation pattern from 1.0056 is extending with another leg. As long as 38.2% retracement of 0.9186 to 1.0056 at 0.9724 holds, we'd expect rise from 0.9186 to resume at a later stage to retest 1.0342 key resistance (2016 high). However, sustained break of 0.9724 fibonacci level will bring deeper fall, as another declining leg in the long term range pattern.
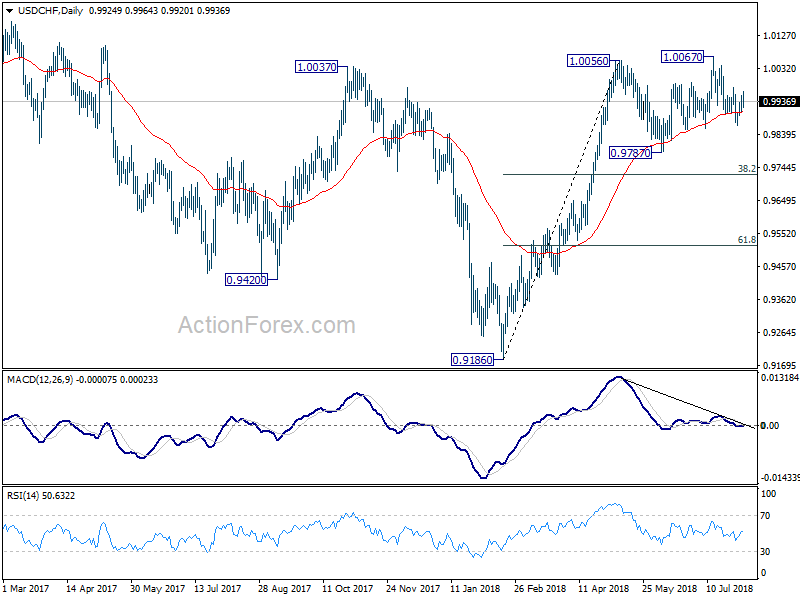
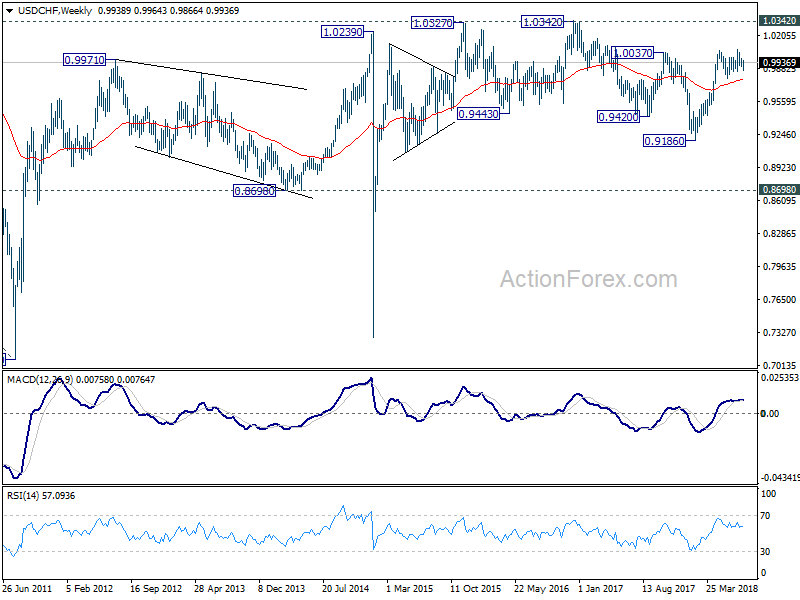
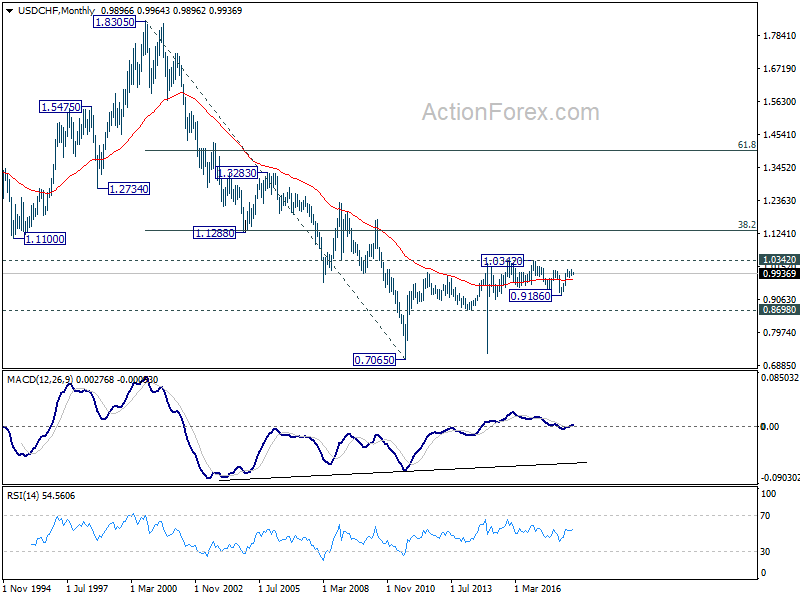
In the long term picture, price actions from 0.7065 (2011 low) are not clearly impulsive yet. Thus, we'll treat it as developing into a corrective pattern, at least, until a firm break of 1.0342 resistance.
AUD/USD Weekly Outlook
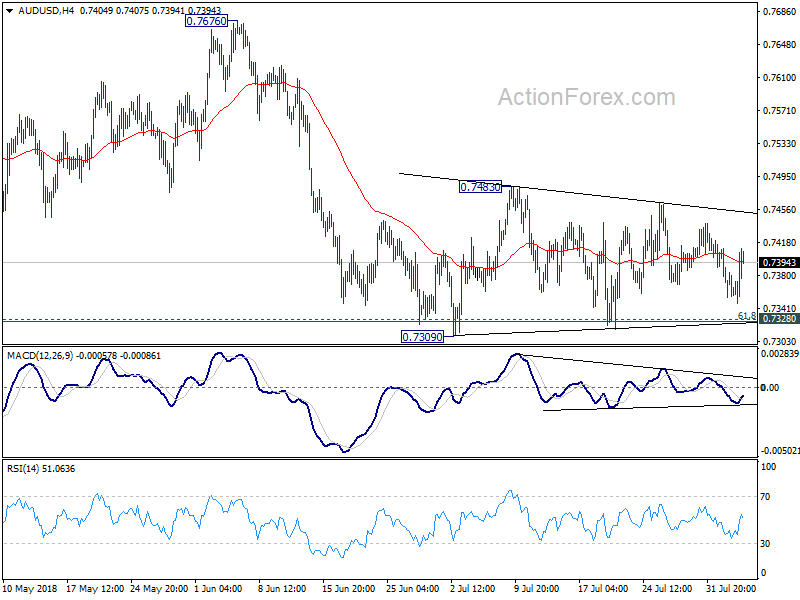
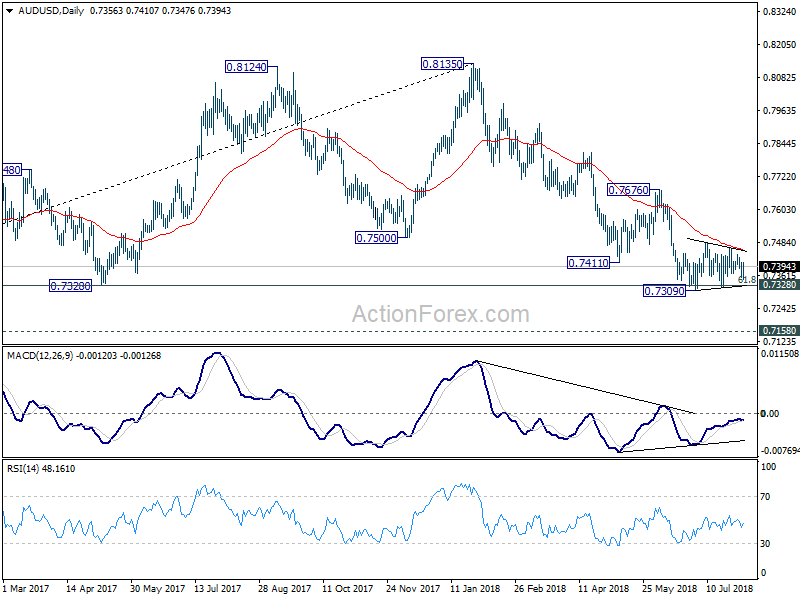
No change in AUD/USD's outlook as the sideway consolidation from 0.7309 continued last week. Initial bias stays neutral this week first. On the downside, break of 0.7309 and sustained trading below 0.7328 cluster support (61.8% retracement of 0.6826 to 0.8135 at 0.7326) will extend the fall from 0.8135 to 0.7158 support next. On the upside, above 0.7483 resistance will bring stronger rebound. But upside should be limited below 0.7676 resistance to bring larger fall resumption eventually.
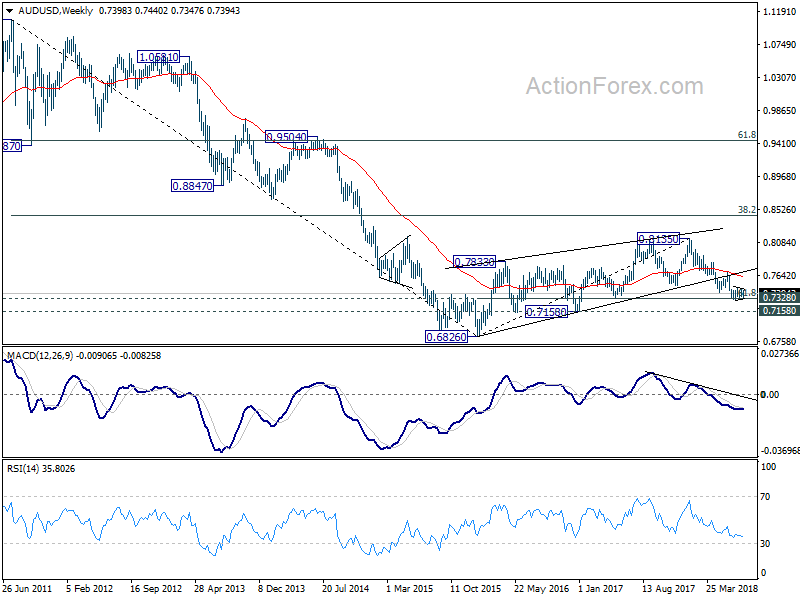
In the bigger picture, medium term rebound from 0.6826 is seen as a corrective move that should be completed at 0.8135. Deeper decline would be seen back to retest 0.6826 low. This will now remain the favored case as long as 0.7676 resistance holds.
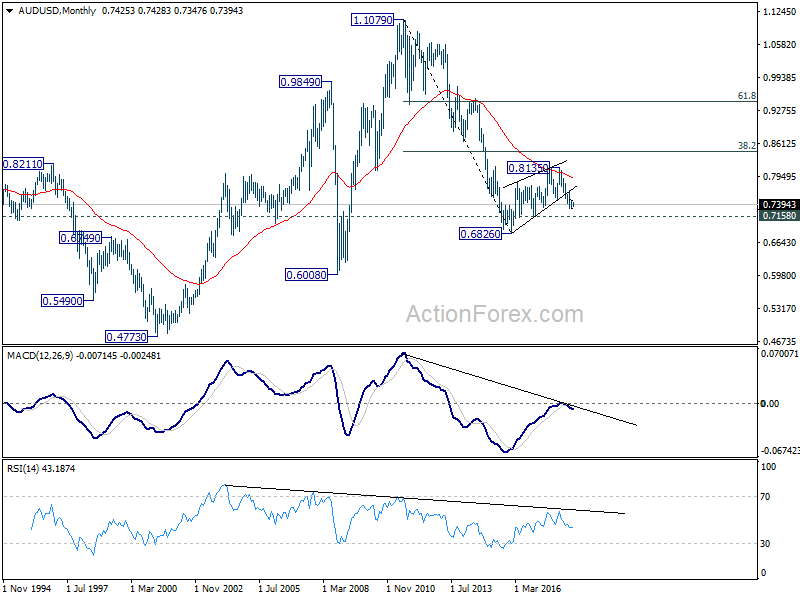
In the longer term picture, 0.6826 is seen as a long term bottom. Rise from there could either reverse the down trend from 1.1079, or just develop into a corrective pattern. At this point, we're favoring the latter. And, as long as 38.2% retracement of 1.1079 to 0.6826 at 0.8451 holds, we'd anticipate another decline through 0.6826 at a later stage. But strong support should be seen between 0.4773 (2001 low) and 0.6008 (2008 low).
USD/CAD Weekly Outlook
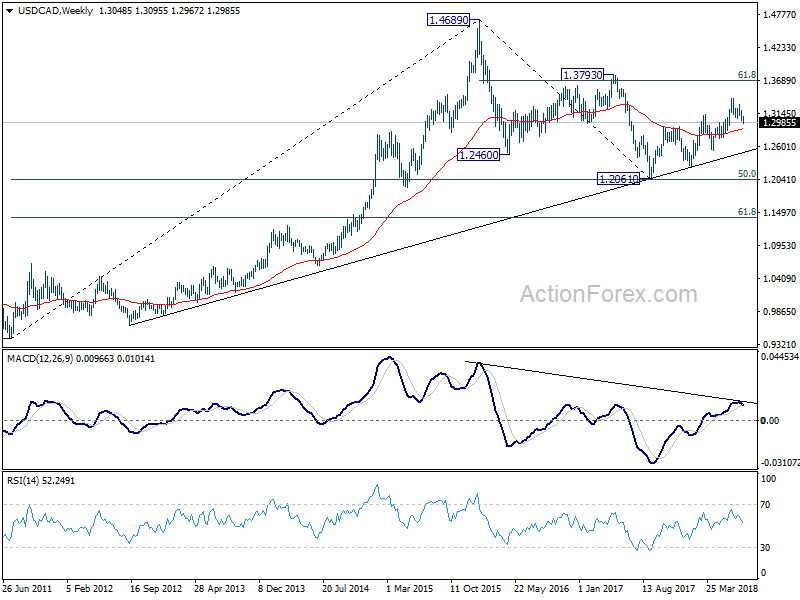
USD/CAD dipped lower to 1.2967 last week as the correction from 1.3385 extends. Downside momentum has been diminishing clearly as seen in 4 hour MACD. While further decline cannot be ruled out, we'd continue to expect strong support from rising channel line (now at 1.2912) to contain downside and bring rebound. On the upside, firm break of 1.3095 resistance will turn bias to the upside for 1.3289 resistance.
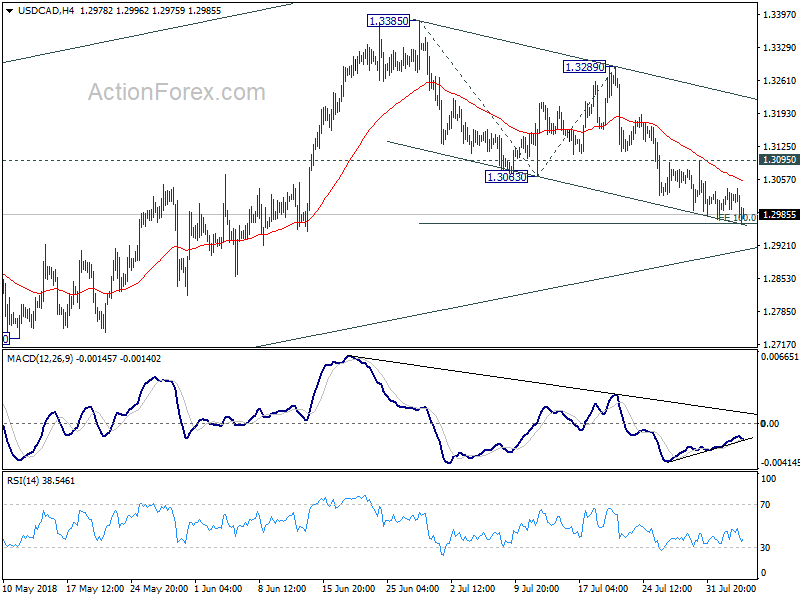
In the bigger picture, as long as channel support (now at 1.2912) holds, we're holding to the bullish view. That is, fall from 1.4689 (2015 high) has completed at 1.2061, ahead of 50% retracement of 0.9406 (2011 low) to 1.4689 (2015 high) at 1.2048. Further rally should be seen for 61.8% retracement of 1.4689 to 1.2061 at 1.3685 and above. However, sustained break of the channel support will argue that rise from 1.2061 has completed and will bring deeper fall to 1.2526 support to confirm.
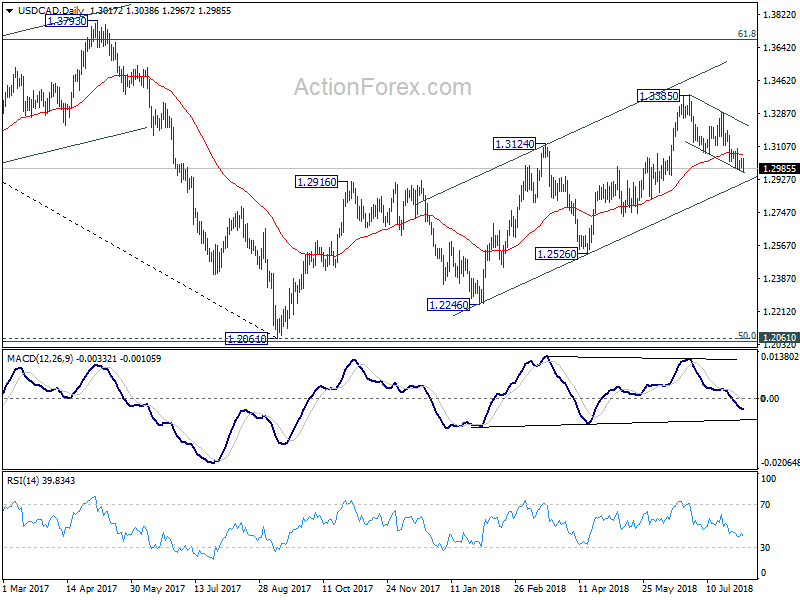
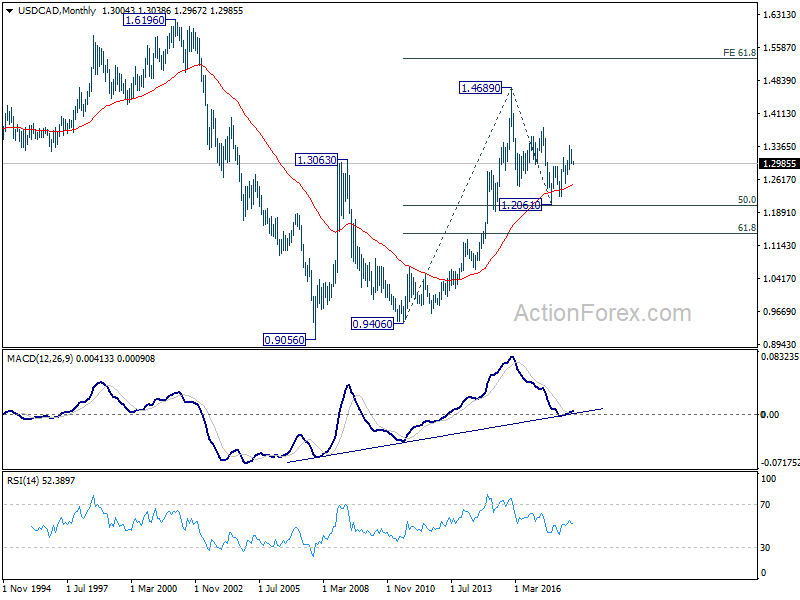
In the longer term picture, corrective fall from 1.4689 (2015 high) should have completed with three waves down to 1.2061, just ahead of 50% retracement of 0.9406 (2011 low) to 1.4689 (2015 high) at 1.2048. The development keeps long term up trend from 0.9406) and that from 0.9056 (2007 low) intact. It's early to tell, but there is now prospect of extending the long term up trend to 61.8% projection of 0.9406 to 1.4689 from 1.2061 at 1.5326 in medium to long term.