

Sample Category Title
Is the FOMC Overly-Optimistic?
"I am an optimist. Anyone interested in the future has to be otherwise he would simply shoot himself." - Arthur C. Clarke
Executive Summary
Does the Federal Open Market Committee (FOMC) behave over-optimistically to achieve its objective? We propose a framework to find the answer. Recently, Federal Reserve Chairman Jerome Powell presented his semi-annual Monetary Policy Report to Congress. One of the important elements of the report, which is also the focus of this report, is the near-term forecasts of major economic and financial variables including GDP, inflation and the unemployment rate.
The importance of these forecasts can be divided into two groups. First, the FOMC utilizes its own forecasts in setting the stance of monetary policy. Second, the private sector, and financial market participants in particular, closely monitor these forecasts as signals of the economic outlook. The FOMC's forecasts may also influence private sector expectations of the economic outlook.1 As forecasts seldom hit their targets, we must estimate the potential losses from forecast errors.
.We find that the FOMC tended to over-forecast GDP growth and the unemployment rate and under-forecast inflation during the 1992-2017 period (Figures 1 and 2). We also find that the FOMC's forecasts displayed different behavior under different chairs. Our analysis also suggests that the FOMC is overly-optimistic, as it tends to forecast a more optimistic GDP growth outlook with "controlled" inflation expectations. Furthermore, its optimism has increased over time. And, outside of recessions, the FOMC never predicted negative or only slightly positive GDP growth.
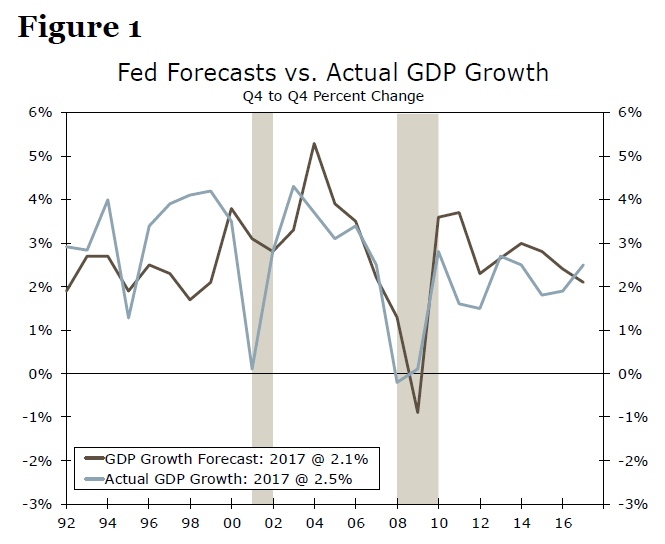
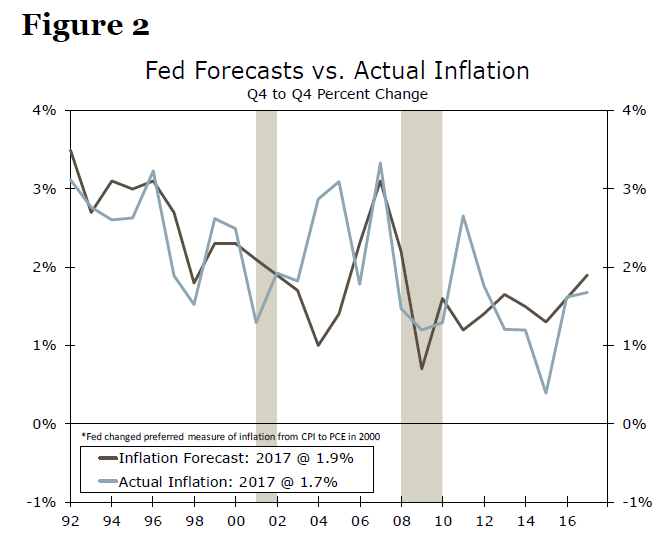
The FOMC's GDP growth and inflation forecasts also appear to be inconsistent with each other. One major reason for this inconsistency is that it may help the FOMC achieve its dual mandate. An overly-optimistic growth outlook while under-forecasting inflation would paint a "rosy" picture where the economy is growing close to its potential while also not overheating. Another potential explanation for this overly-optimistic behavior is that the FOMC "spreads" positive news, and these forecasts influence the private sector. If the FOMC forecasts a weaker outlook, some analysts could consider this a signal of a change in monetary policy stance and/or that a recession is imminent. Therefore, in our view, the FOMC has an incentive to avoid predicting a weaker economic outlook.
We plan to publish a three-part series of reports, with the first part focusing on the FOMC's behavior and whether it is overly-optimistic. The second part will include the Blue Chip forecasts as a measure of private sector behavior and evaluate whether the FOMC is more optimistic than the Blue Chip. We will also examine whether the FOMC's forecasts influence private sector forecasts. The final report will analyze whether the FOMC forecasts are consistent with its adopted monetary policy stance. For example, we will analyze whether an overly-optimistic outlook is consistent with neutral versus contractionary monetary policy.
A Theoretical Framework to Estimate the Cost of Forecast Error
To determine whether the FOMC is overly-optimistic, we first discuss a theoretical framework, which will help us evaluate the FOMC's forecasts and answer the question of over-optimism. In practice, forecasts do not always hit their targets, and this creates a higher possibility of forecast errors. The total cost (potential damages/losses) of forecast errors is labeled as the loss function. Moreover, the forecast error can be divided into an under-forecast (the forecast is lower than the actual value) and an over-forecast (the forecast is higher than the actual value). The question then becomes whether the cost of under-forecasting is identical to the cost of over-forecasting, known as a symmetric loss function. If the cost of being wrong is not identical for under-/over-forecasts, then it is called an asymmetric loss function.
In the case of a symmetric loss function, a forecaster is indifferent between under- and over-forecasting. However, an asymmetric loss function has the potential to dictate a preference for forecast errors. If a forecaster knows that under-forecasting could cause more damage than over-forecasting, that forecaster may tend to over-forecast. We utilize a simple example of weather forecasting to illustrate the asymmetric loss function scenario. In our view, a weather forecaster would generally prefer to over-forecast inclement weather, all else equal. The forecaster would want to prepare the general public for impending severe weather, and could "inflate" the probability of an upcoming winter storm, for example. If the over-forecast never comes to fruition, besides reputation, it would cause relatively small losses in terms of business closures and evacuations. However, under-forecasting a storm that did indeed affect the area could cause serious damages, both in terms of loss of life and monetary losses. Therefore, in our view, weather forecasters have an incentive to over-forecast because of their asymmetric loss function.
We believe that the FOMC's loss function is also asymmetric, as it would prefer to avoid under-forecasting economic growth, for example by avoiding making a recession forecast. We discuss the implications of this tendency in the following section.
The FOMC's Loss Function: Is Predicting Recession Unsuitable?
The dual objective of the FOMC is price stability and fostering maximum employment. Naturally, the FOMC's loss function would be to avoid recessions, bubbles, a run-up in prices or deflationary periods. As discussed earlier, the FOMC utilizes its own forecasts in setting the stance of monetary policy, and these forecasts also influence private sector expectations of the economic outlook.2 The potential consequences of the FOMC's forecast errors include an unsuitable monetary policy stance and undesired signals to the private sector. We first analyze the potential consequences of under-and over-forecasting on monetary policy, and then highlight the implications for the private sector. We utilize GDP growth and inflation forecasts as a case study. We first discuss the potential cost of under-forecasting GDP growth and CPI, and then discuss the cost of over-forecasting these two variables. In this section, our discussion is theoretical, and in the next section we examine the FOMC's actual forecasts.
In theory, under-forecasting GDP growth and inflation rates would create the possibility of an overly-accommodative monetary policy stance, which may fuel an asset price bubble. For example, if the FOMC forecasts relatively weaker GDP growth and lower inflation rates, the FOMC would follow an accommodative monetary policy stance to stimulate the economy and push inflation toward target, all else constant. If we analyze one-year ahead forecasts, the FOMC would learn roughly a year later about the result of under-forecasting GDP growth and inflation. However, the FOMC would need to set the policy stance in the near term using its forecasts, which would suggest an overly-accommodative policy stance. Assuming actual GDP growth and inflation turn out be stronger, this scenario would suggest that the implied monetary policy stance is over accommodative, potentially fueling an asset price bubble. We define an "overly-accommodative" monetary policy stance as an instance where the policy stance should have been neutral or tighter, but instead the FOMC follows an accommodative policy stance. This means that the fed funds target rate is lower than it should have been otherwise. Some analysts suggest that the monetary policy stance was overly accommodative during the 2002-2004 period, which partially contributed to the housing bubble.3
Conversely, over-forecasting GDP growth and inflation may turn monetary policy toward an overly-restrictive stance, which may result in an economic slowdown or recession, as borrowing costs would be overpriced. That is, over-forecasting GDP growth above its potential growth rate would put upward pressure on inflation. Theoretically, the FOMC would raise the fed funds rate to tame inflation and prevent the economy from overheating. Raising the fed funds rate would boost the cost of capital, as interest rates are an important element of borrowing costs. Assuming actual GDP growth and inflation are weaker than forecasted, the scenario would suggest an overly-restrictive monetary policy stance. By the same token, the fed funds target rate would be higher than it should be given the actual data. Overpriced borrowing costs and weaker demand would open the door for a slowdown or a recession, all else equal.
Romer and Romer (2000) suggest that the FOMC forecasts influence private sector forecasts, because typically the private sector modifies its forecasts in response to Fed signals. Therefore, under-/over-forecasting, in theory, has potential consequences for the private sector and for the economy. For example, under-forecasting GDP growth and inflation may make the private sector nervous. As suggested by Romer and Romer (2000), the private sector believes that the Fed has more information relative to other decision makers, and may view a weaker outlook as a signal for a potential slowdown or recession. Conversely, over-forecasting has the potential to make the private sector overly optimistic, which may fuel excessive growth and overheat the economy.
If the FOMC's forecasts are consistently too optimistic or pessimistic, it could affect its forecast reputation and ability to influence expectations, in addition to an unsuitable monetary policy stance. Forecasting is a double-edged sword for the FOMC, and it would likely want to avoid forecasting extreme events such as bubbles or recessions, at least publicly. Similarly, under-forecasting key variables may make the private sector worried, which could also bring a slowdown or recession. In light of this proposed theoretical framework, we evaluate the FOMC's actual forecasts.
Forecasts vs. Reality: Is Over-Optimism a Secret Weapon of the FOMC?
We utilize the FOMC's forecasts for the 1992-2017 period.4 We start our analysis in 1992 to analyze three recent Fed chair tenures over the past 25 years, and examine the forecasts under different FOMC leadership. As recessions are difficult to predict, particularly one year ahead, we exclude the 2001 and 2008-2009 recessionary periods when evaluating the forecasts. However, there are three recoveries/expansions in our analysis, and we evaluate the FOMC's behavior during these periods. We use an annual dataset with 23 observations for our analysis. We use a one-year-ahead forecast horizon, as long-term forecasting is inherently difficult and has the potential for larger forecast errors. The possibility of structural breaks/outliers is also higher in the long term. In our view, the FOMC gives more weight to the near-term outlook and actual data when setting the stance of monetary policy.
For the overall 1992-2017 period (excluding recessions), The FOMC over-forecasted GDP growth 52 percent of the time, the unemployment rate 91 percent of the time and under-forecasted inflation 52 percent of the time (Table 1). Since the 2001 recession, the FOMC over-forecasted GDP growth 75 percent of the time and under-forecasted inflation 57 percent of the time. However, for the pre- 2001 recession era (1992-2000), the FOMC under-forecasted GDP growth 78 percent of the time and over-forecasted inflation 56 percent of the time. On net, the FOMC displayed different forecasting behavior for the post-2001 recession period compared to the pre-2001 era. In addition, the FOMC over-forecasted GDP growth in the 2010-2012 period after the Great Recession. The motivation of over-forecasting in the early phase of a recovery/expansion would be to spread optimism.
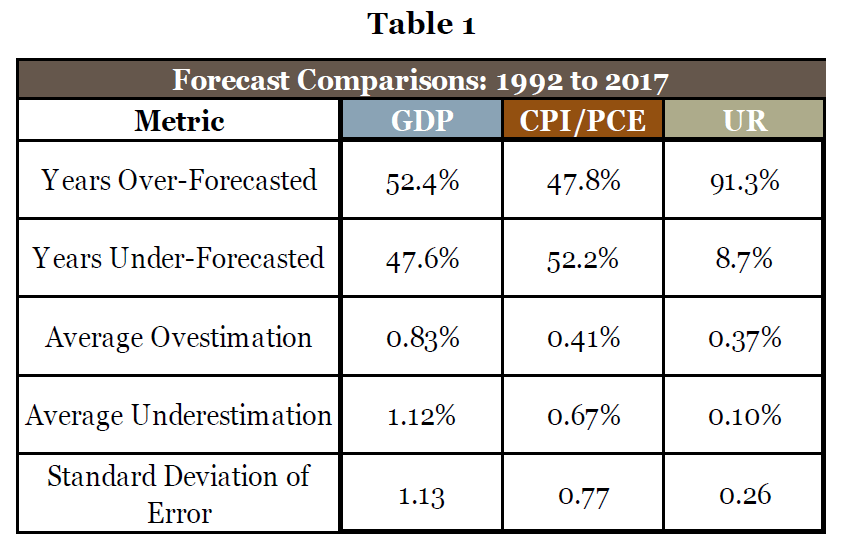
Our analysis suggests that the FOMC is overly-optimistic, as it forecasts a stronger growth outlook with "controlled" inflation expectations. Its optimism has also grown over time, as the FOMC had a greater tendency to over-forecast GDP growth in the post-2001 period compared to the pre-2001 era. In addition, outside of recessions, the FOMC never predicted negative or only slightly positive GDP growth numbers. During the 1992-2017 period (excluding the Great Recession), the FOMC predicted GDP growth rates less than 2 percent three times, all in the 1990s. This means that the Bernanke and Yellen eras never forecasted below-2-percent GDP growth. However, excluding recessions, actual GDP growth dropped five times below 2 percent during the period. One potential reason for above-2-percent forecasts after the Great Recession is that the potential GDP growth rate was slightly below 2 percent (1.5 percent for the 2008-2017 period per CBO estimates).5 The FOMC may have been suggesting that the economy was growing above its potential growth rate, meaning that it was "healthy".
Another interesting observation from the FOMC's GDP growth and inflation forecasts is that the data suggest that the forecasts are inconsistent with each other. For example, in the 2001-2017 period the FOMC over-forecasted GDP growth 75 percent of the time but under-forecasted inflation 57 percent of the time. Higher growth rates should put upward pressure on prices, all else equal, and over-forecasting GDP growth would have coincided with over-forecasting inflation. However, the FOMC's inflation and GDP growth forecasts disagree with each other. One major reason for this inconsistency and for the overly-optimistic behavior may be that it could help the FOMC achieve its dual mandate. Over-forecasting economic growth while under-forecasting inflation would paint a "rosy" picture where the economy is growing close to its potential, but growth would not create inflationary pressures in the near term.
Another potential justification for the FOMC's overly-optimistic behavior is that the FOMC "spreads" positive news, as the FOMC's forecasts influence private sector expectations. If the FOMC forecasts a weaker outlook, that would make the financial sector and other watchers of the Fed's forecasts uncomfortable. Some of those participants may consider a weaker outlook a signal for upcoming changes in the near-term monetary policy stance and/or a recession. In our view, the FOMC has an incentive to avoid predicting a weaker economic outlook in the near term. Eisenhower once said that pessimism never won any battle, and by being overly-optimistic the FOMC seems to follow Eisenhower's quote.
The Legend of Fed Leadership: Yes, the Chairperson Matters
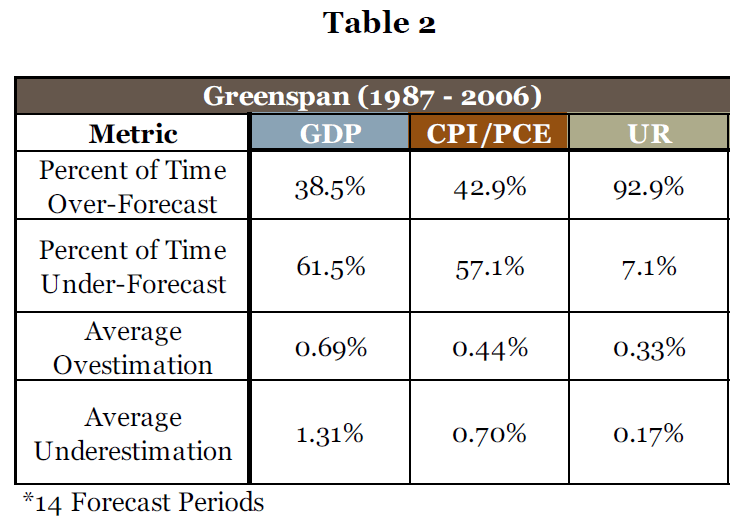
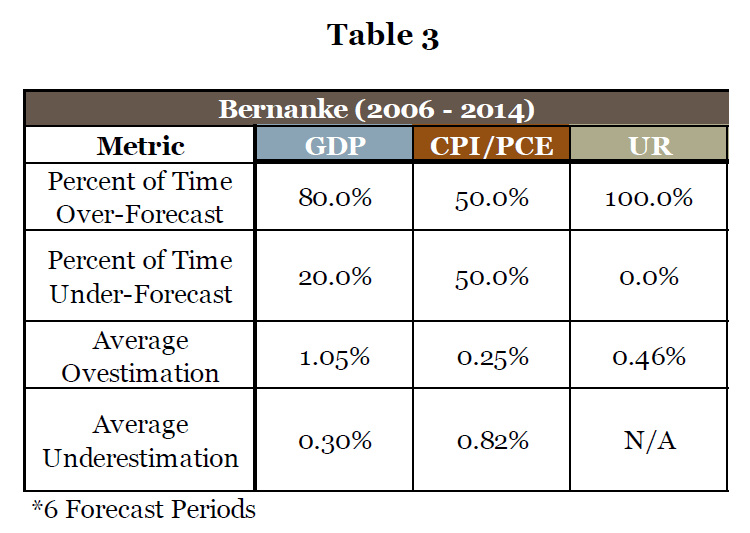
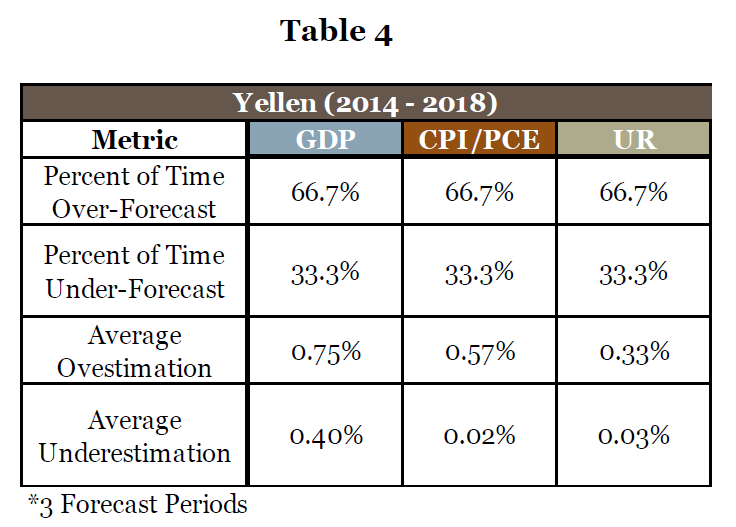
Finally, we analyze the FOMC's forecasts under different chairs, and find that the forecasts are different under different leadership. For example, under Greenspan, the FOMC under-forecasted GDP growth 62 percent of the time, inflation 57 percent of the time and over-forecasted the unemployment rate 93 percent of the time (Table 2). During the Bernanke era, the FOMC over-forecasted GDP growth 80 percent of the time and the unemployment rate 100 percent of the time, while inflation was split 50-50 between the percent of the time over-forecast and under-forecast (Table 3). Yellen's leadership displayed different forecasts than Greenspan and Bernanke. Under Yellen, the FOMC over-forecasted GDP growth, inflation and the unemployment rate two-thirds of the time. (Table 4).
Conclusion: Setting Monetary Policy Is a Double-Edged Sword
The FOMC utilizes several tools to achieve its dual mandate, including its forecasts of major economic variables. Our analysis shows that the FOMC tends to project a "rosy" path of GDP growth and inflation close to target, which satisfies its dual mandate. In sum, the FOMC's forecasts tend to be overly-optimistic. In the next report, we plan to include Blue Chip forecasts as a measure of private sector behavior, and we will examine whether the FOMC or the private sector is more optimistic. Our final report will analyze whether the FOMC's forecasts are consistent with its adopted monetary policy stance during the 1992-2017 period.
Appendix: The Data
Our analysis utilizes 23 years of historical forecast data from the Fed's Greenbook forecasts and the FOMC's Summary of Economic Projections (SEP). As the FOMC did not begin publishing the SEP until 2012, we use the forecasts complied by the Fed staff in the Greenbook and given to the FOMC ahead of each meeting as a proxy for the FOMC's forecasts from 1992-2012. Our three variables of interest are GDP growth, inflation and the unemployment rate.
For each variable, we take the one-year ahead forecast published in the December Greenbook/SEP of the prior year. For example, we use the December 1991 Greenbook to get the full-year 1992 forecast. For GDP growth, both the Greenbook and the SEP calculate the annual growth rate as the change from the fourth quarter of the prior year to the fourth quarter of the given year. For inflation, prior to 2000 the FOMC forecasted CPI inflation, and began forecasting the PCE deflator in 2000. We align our data with this addition, analyzing the CPI forecasts until 2000 and the PCE forecasts from 2000-2017, as the PCE deflator is what is forecasted in the SEP. The Greenbook/SEP forecasts for inflation are also the change from the fourth quarter of the prior year to the fourth quarter of the given year. For the unemployment rate, the Greenbook/SEP forecasts annual values are calculated as the average for the fourth quarter of the given year. While the FOMC began publishing the SEP in 2012, it forecasted only the central tendency and range of each variable until 2015, and only began publishing the median in 2015. From 2012-2014 we use the average of the central tendency for each variable, and begin using the median forecast for each variable in 2015.
Finally, we use actual data for each variable in the same form as the forecast calculation. For the GDP numbers, as the GDP data is subject to several revisions, we use the advance release full-year estimate for each year beginning in 1996. Prior to 1996, the historical GDP press release archives were not readily available, so we utilize historical GDP vintage data from the Federal Reserve Bank of Philadelphia6, again using the same fourth quarter to fourth quarter growth rate calculation. For years in which there were major GDP revisions that coincided with the Q4 release, we calculate the full year growth rate using the advance number for the current year and the first revision number for the prior year to account for the level change under the GDP revision.
1Romer, Christina, D., and David H. Romer. 2000. "Federal Reserve Information and the Behavior of Interest Rates." American Economic Review, 90 (3): 429-457.
2 For more detail see Romer and Romer, 2000.
3 Iqbal, Azhar and Vitner, Mark. (2013). Did Monetary Policy Fuel the Housing Bubble? The Journal of Private Enterprise. Vol 29, pp 1-24.
4 For more detail about the data used in our analysis, please see the Appendix of this report.
5 For more detail about potential growth rates, see CBO's website: https://www.cbo.gov/about/products/budget-economic-data
6 https://www.philadelphiafed.org/research-and-data/real-time-center/real-time-data/data-files/routput
Elliott Wave Intra-day Update – S&P500
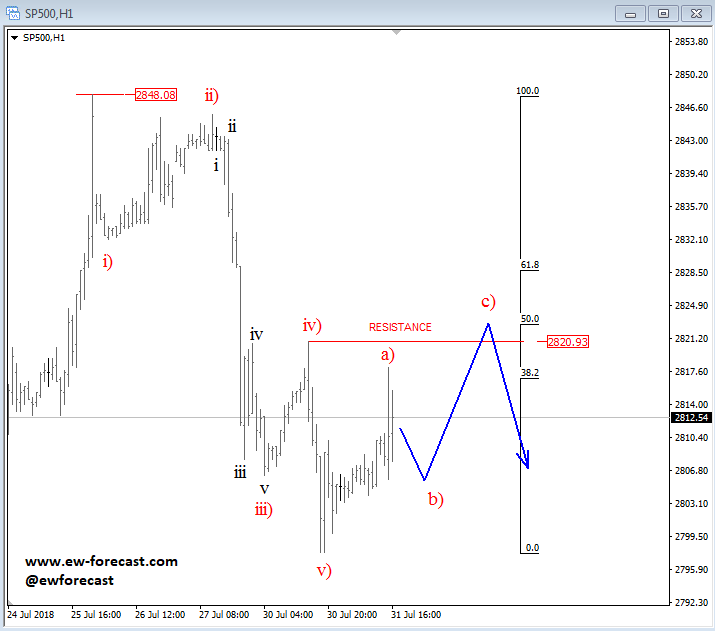
As expected, after a five-wave decline from 2848, S&P500 has turned into a correction. Price has already retraced for 38,2% Fibo. retracement which can be enough, but we still think that resistance at previous wave iv) can be achieved, so be aware of a bigger recovery towards 50% - 61,8% Fibo. retracement and 2820-2830 area. However, S&P500 remains bearish as long as it's trading below 2848 invalidation level.
S&P500, 1h
Euro Eases after Failure on Triangle Resistance as Dollar Rallies
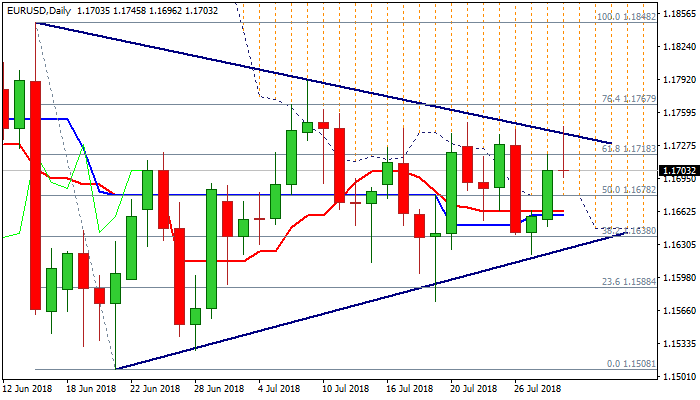
The Euro ran out of steam and fell back to daily lows at 1.1700 and erased all gains of the day, as fresh dollar’s strength put the single currency under pressure.
Initial probe through triangle resistance at 1.1740 (session high was at 1.1745) proved to be short-lived, but positive momentum exists and keeps near-term bullish bias alive for now.
Dips need to find ground above daily cloud base (1.1678) with another close within the cloud, needed to maintain bullish stance.
On the other side, Italian GDP fell below expectations in Q2 and despite stronger than expected inflation numbers, could sour the sentiment together with IMF’s comments uncertain outlook about Greece’s long-term debt.
We look for constructive tone while the price holds within the cloud, while return below cloud base would weaken near-term structure.
Wednesday’s FOMC decision could be a catalyst for final and strong direction signal.
Res: 1.1745; 1.1762; 1.1790; 1.1848
Sup: 1.1700; 1.1678; 1.1648; 1.1627
GBP/USD Pares Gains ahead of BoE
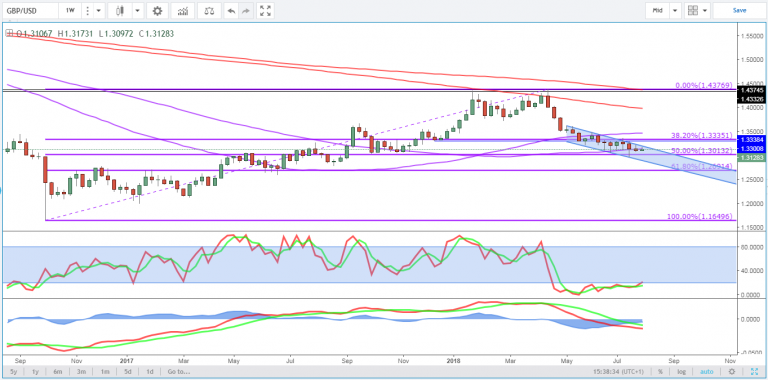
The sell-off in GBPUSD (cable) has been losing momentum for a couple of months now, with the pair having stalled around 1.30 despite one attempt to break below a couple of weeks ago, something that now looks like a false breakout.
The move has coincided with a general improvement in sentiment towards the greenback, with the already hot US economy getting an additional fiscal boost from tax reforms, leading to an increase in expectations for rate hikes in the near to medium term.
GBPUSD Weekly Chart
It has also coincided with a slowdown in other countries which has forced their respective central banks to take a more gradual approach to tightening plans, with the Bank of England being one of those to have adopted such an softening in stance.
The dollar has also benefited from its renewed safe haven appeal, with US Treasuries being favoured in trade-related risk averse environments thanks in part to the higher yield that is now on offer.
This pair is not short of potential catalysts this week, with the BoE meeting on Thursday – or Super Thursday as it has now become known – being at the very top of these (Fed rate decision Wednesday and US jobs report on Friday also clearly stand out).
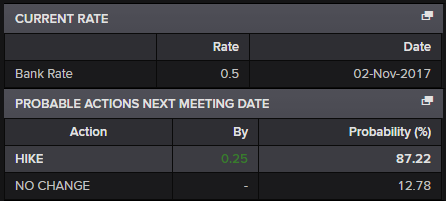
The UK central bank is widely expected to raise interest rates by 25 basis points at the meeting – 87% priced in – the second post-financial crisis rate hike but the first time rates will be above 0.5% which for some time was seen as the lowest they could reasonably go.
BoE Interest Rate Probability
Source – Thomson Reuters Eikon
While the decision to raise interest rates has been met with confusion and even criticism, due to the economy very much not firing on all cylinders and Brexit talks now at a crunch point and likely to be much clearer in only a few months, policy makers have done nothing to correct markets interpretation of events which if anything makes investors even more confident that it will happen.
This comes after policy makers backtracked on a rate hike in May due to the first quarter slow down, despite being confident at the time that it was largely weather related, something recent data has gone some way to confirming.
This determination to raise rates may be one of the things supporting the pound recently but if a hike is so priced in, has sterling peaked? I’m not sure. For one, any progress in Brexit negotiations should be good for the pound. The same applies to the economy, with both providing comfort to the central bank. Something it can’t have much of right now given the sheer amount of uncertainty.
GBPUSD Daily
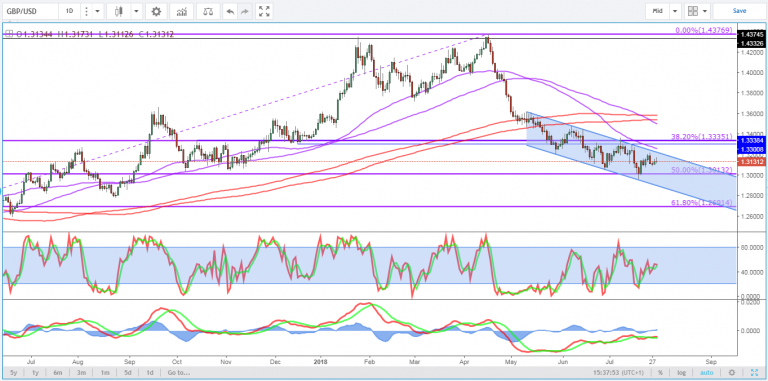
From a purely technical perspective, the sell-off appears to have potentially run its course. The pair has found support around a notable technical support level – 50 fib from lows to highs, previous support and resistance and a big round number just to complete the hatrick.
What’s more, upon reaching here, momentum had already started to decline and has continued to do so, with the MACD and stochastic making higher lows even as price made lower ones. This divergence, while not being a buy signal, is a sign that all may not be as bearish as it was and that there may be some profit taking or even buying creaping back in (remember, if this is a corrective move, then the recent weakness should prove only temporary and bulls become increasingly interested once again).
The pair may be flat on the day after US inflation, income and spending figures brought some life back to the dollar, but should it find some upward momentum again and break back above 1.32 – and the falling channel – it could be a bullish signal in the near-term.
Yuan rebounds as US, China seek to restart trade talk, but we doubt.
Dollar is apparently lifted mildly by a Bloomberg report that US Treasury Secretary Steven Mnuchin and Chinese Vice Premier Liu He are having private conversations for restarting the trade negotiations.
It seems like a very early stage of re-engagement as there is no time-table, nor any format for the talk. But, there is only vague consensus that talks need to take place.
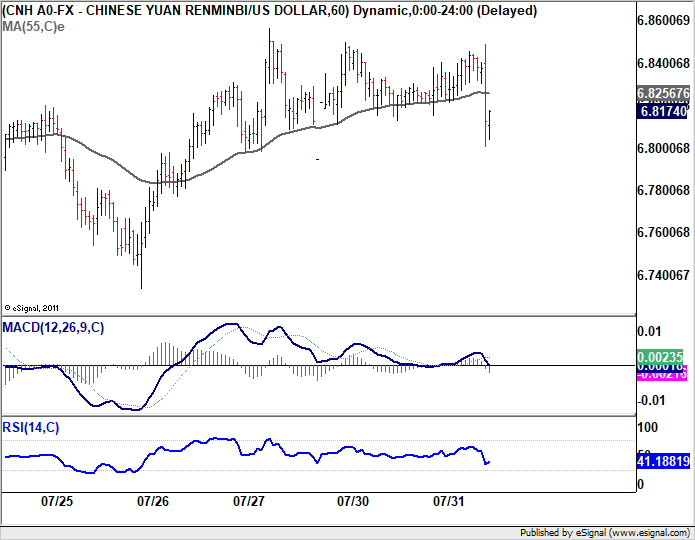
While Dollar is strengthening against Yen, it dips notably against the offshore China Yuan on the news.
On the one hand, it's understandable for China to seek a way out of the tariffs vicious cycle given that US and EU are now aligned against it after Juncker's visit.
On the other hand, it should be noted that Liu He was assigned a new task last week to lead a special work group to oversee state-owned enterprise reforms. Adding another task for Liu in such a crucial time when he's leading trade negotiation with the US is unusual. And that prompted speculations that President Xi Jinping is not satisfied with what Liu has done. And Liu could be moved away from the circle on the trade issue.
So, the news is doubtful to us.
Sunset Market Commentary
Markets
Investor cautiousness preceding the Bank of Japan policy meeting put core bonds under pressure yesterday. The BoJ decided this morning to keep (the unchanged) interest rates low for “an extended period of time” and kept the 10-y yield target near 0.0%. The BoJ also allows greater flexibility surrounding the 10-y yield target (up to ±20 bps). US eco data (PCE core, PCE deflator, personal spending) came in close to/a little below expectations. EMU data was more mixed as GDP growth (2.1% YoY) was slightly below expectations (2.2% YoY) while CPI (headline 2.1% YoY vs. 2.0%, core 1.1% YoY vs. 1.0%) beat consensus. However, neither US nor EMU data triggered a significant impact on yields and, in any case, were eclipsed by the BoJ. After witnessing a BoJ induced relief rally, core bonds took a step back. This is especially the case for the German Bund. We think the newly introduced flexibility by the Bank of Japan – which is likely to lead to a steeper yield curve – makes markets ponder whether the EMU yield curve flattening (at the longer end) has gone far enough. This Bund underperformance held on more clearly until headlines appeared, reporting China seeks to restart US trade talks. Intra EMU-spreads also narrowed with Italy outperforming (-3bps).
Today, the EUR/USD rebound continued. The move started Friday evening as the dollar failed to gain on a solid but as expected US Q2 growth. In this respect, the move in the first place started as USD softness rather than euro strength. However, yesterday interest rate differentials narrowed already further in favour of the euro/in disadvantage of the dollar. Initially, US and European bond yields eased this morning as the BOJ kept is policy/target rates unchanged. However, the US-German interest rate differential soon widened again and supported further EUR/USD gains. EMU data were mixed with inflation (both core and headline) slightly beating the consensus. However, EMU Q2 growth was softer than expected (0.3% Q/Q vs 0.4% expected). Even so, the euro temporarily kept its intraday upward bias. In the afternoon US spending and income data were as expected, but the price deflators were marginally softer than expected. EUR/USD came close to the 1.1750 intermediate resistance, but the area again proved to be tough resistance. EUR/USD trades currently in the 1.1715 area. So for now, EUR/USD remains locked in the established sideways range. The yen fell prey to profit taking today as the BOJ made only limited changes to its monetary stimulus program. The move started rather slowly this morning, but gained momentum during the US trading session. USD/JPY trades in the 111.80 area. The move was supported by a positive risk sentiment at the start of the US trading session as China was said to seek to restart talks with the US to defuse a trade war.
Today, EUR/GBP trended further north of the 0.89 barrier. UK Gfk consumer confidence (-10 vs -9 expected) published overnight maybe was a slightly sterling negative. However, the EUR/GBP was mainly euro driven. EUR/GBP trades in the 0.8920 area. 0.8958/68 resistance is coming closer but also proved to be though. Cable rose temporarily on USD softness this morning, but the pair currently trades little changed in the 1.3130 area.
News Headlines
European data came in mixed today. Inflation rose by 2.1% in July (YoY), from 2% the month before. The core inflation also rose from 0.9% to 1.1% (1% expected). EMU GDP growth slowed to 0.3% (QoQ), with 0.4% expected, leading to a lower GDP growth (YoY) of 2.1% (2.2% expected). The unemployment rate remains 8.3%.
IMF has signaled that the current debt relief deal between the EU and Greece is not sufficient. It warned the EU governments that Greece’s debt relief package is fine for the medium run, but it will need more long-term debt relief, if it wants to return to international capital markets after eight years reliant on loans from the EU and IMF.
US PCE Core (MoM) rose marginally with 0.1% in June, coming from 0.2% in May, keeping the year-on-year increase at 1.9% for a third straight month. The Chicago Purchasing PMI rose to 65.55 (from 64.1 in June) while a drop to 62.0 was expected. The Conf. Board Consumer confidence rose to 127.4 (vs. 126.0 expected).
USDJPY Outlook: Surges on US-CHINA Renewed Talks News; Solid US Data
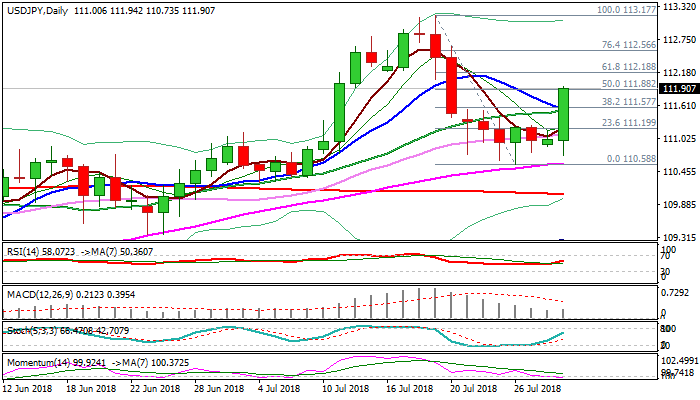
The dollar surged to the highest levels in past seven days against yen, on news that US and China are to restart talks in attempt to avert growing risk of a trade war between world's two biggest economies. In addition, data released today showed that the US personal income and spending came in line with expectations, while PCE index stays at 1.9% for a third consecutive month and consumer confidence rose to 127.4 in July, beating forecast and previous release. The greenback appreciated in positive environment, retracing over 50% of 113.17/110.58 pullback and eventually confirmed break out of four-day congestion, limited by rising 55SMA and 20SMA. Bullish tone that now dominates on lower timeframes also improved daily techs. Bulls need confirmation on daily close above already broken pivotal 110.50/60 zone (converged 10/20SMA/Fibo 38.2% of 113.17/110.58) for extension above 112.00 barrier, which would signal full retracement of 113.17/110.58 corrective leg. Fed's policy decision on Wednesday will be next key event for the dollar.
Res: 112.00; 112.18; 112.56; 113.17
Sup: 111.88; 111.57; 111.19; 110.73
US: Core Inflation Holds Slightly Below Target for the Third Straight Month in June
Personal income rose 0.4% in June, right on market expectations and matching the prior month's gain. Adjusted for inflation and removing taxes, real disposable income was up 0.3% in the month.
Personal spending rose 0.4% in nominal terms, bang on market expectations. Spending in real terms rose 0.3%, driven mostly by services (+0.4%), with particular strength seen in food services and accommodations. Real goods spending was buoyed by durables (+0.4%) but held back by non-durables (-0.1%), resulting in a near-flat print.
Both, the headline and core PCE deflators rose 0.1% in June, in line with market consensus. A boost from food prices (0.2%) was partially offset by lower energy costs(-0.1%). Year-over-year gains held roughly steady for both, but came in a touch below expectations. Revisions to the data indicate that the Fed's preferred measure of inflation hit its target earlier in March, and has held near target at 1.9% since then.
Personal income and spending data were subject to revisions as part of the GDP benchmark revisions last Friday. The most notable change was that to the personal savings rate was revised up significantly. The May figure for instance, was revised up to 6.8% from 3.2% – over double the prior reading. The upward revision was the result of higher income growth as more complete data sources resulted in upward revisions to proprietors' income, dividend income and wages & salaries. In June, the personal savings rate held steady at 6.8% after three consecutive monthly declines.
Key Implications
Last week's GDP report had already revealed a 4% (annualized) gain in second-quarter consumption, so today's data held few surprises. But, the data is still useful in gauging near-term activity, with a respectable outturn in June providing a decent handoff to third quarter spending. In addition, it's worth remembering that the second-quarter reflects a rebound from a very soft start to the year, with a similar performance unlikely to be repeated in the second half of 2018. We expect spending to settle back toward a more sustainable pace of around 2½ percent ahead – a path also supported by still-decent income gains.
The results from today's report must also be considered alongside numerous revisions to the data, the most striking of these being that to the personal savings rate, which is now over double that of prior estimates. The upgrade, which points to the rate being closer to that of the mid-1990s, rather than near the trough of the mid-2000s, helps ease some of the concerns that Americans had been excessively dipping into their piggy banks to sustain their spending habits.
More cushion than previously-thought in the forms of savings, a decent consumption pace and the Fed's preferred inflation measure holding near the target, are all elements consistent with a continuation of the tightening cycle. But, given that core PCE is still slightly below target, the Fed should be in no rush to raise rates, leaving September as the most likely time for the next trigger pull.
Dollar regains ground after Chicago PMI and consumer confidence
Dollar regains some ground after better than expected consumer confidence reading.
US Conference Board consumer confidence rose to 127.4 in July, up from 127.1 and beat expectation of 126.5. Lynn Franco, Director of Economic Indicators at The Conference Board said in the release that "Consumers' assessment of present-day conditions improved, suggesting that economic growth is still strong. However, while expectations continue to reflect optimism in the short-term economic outlook, back-to-back declines suggest consumers do not foresee growth accelerating."
Chicago PMI rose to 65.5 in July, up from 64.1 and beat expectation of 61.8. Jamie Satchi, Economist at MNI Indicators said in the release that "the MNI Chicago Business Barometer started the third quarter in bullish form, with business activity supported by robust demand and output. Both, like the headline index, registered 6-month highs and the majority of firms expect demand to increase further over Q3." However, "input prices continue to be a thorn in the side of businesses, however, with the Prices Paid indicator at the highest in a decade and continuing to signal pipeline inflation."
Canadian GDP Surprised to the Upside in May; Growth Broadly-Based
Highlights:
- Canadian GDP rose a solid 0.5% in May following April’s weather-dampened 0.1% increase.
- Service-producing industries saw across-the-board gains, led by retail, wholesale and arts & entertainment.
- A reversal of April’s transitory shutdowns in the oil sands sent non-conventional oil & gas extraction 5% higher.
- The energy sector is set to remain volatile with a full shutdown of one oil sands facility in July. That is expected to hold down Q3 growth (our current forecast +1.6%) before activity rebounds in Q4.
Our Take:
It’s hard not to like this morning’s GDP report. Growth came in above consensus with a 0.5% increase in May—markets were expecting +0.3%. With activity rising month-over-month in 19 of 20 industries it was the most broadly-based gain in more than a decade. Utilities provided the only drag as April’s weather-related increase in electricity demand was retraced. Conversely, sectors that were held down by bad weather in the prior month (retail and construction) saw a healthy rebound in May. The other factor that held growth to 0.1% in April was a pullback in non-energy mining, which increased only modestly in May. Across-the-board gains in services sent activity in the sector up 0.5%, matching the best monthly pace in a decade.
When the Bank of Canada released their July MPR just three weeks ago their forecast for 2.8% growth in Q2 looked a bit ambitious. Not so anymore with monthly figures tracking close to a 3% annualized pace. A sting of solid data—last Friday’s inflation report was also a bit firmer than expected—might stir more talk of the BoC raising rates again as soon as September. In any case it will put even more attention on Governor Poloz’s Jackson Hole comments in late August. For our part we still think the bank will hold off on raising rates until October to keep the pace of tightening gradual. Today’s solid growth numbers simply improve our confidence that the overnight rate is set to move higher again this year.