

Sample Category Title
GBP/USD Analysis: Unchanged On Tuesday
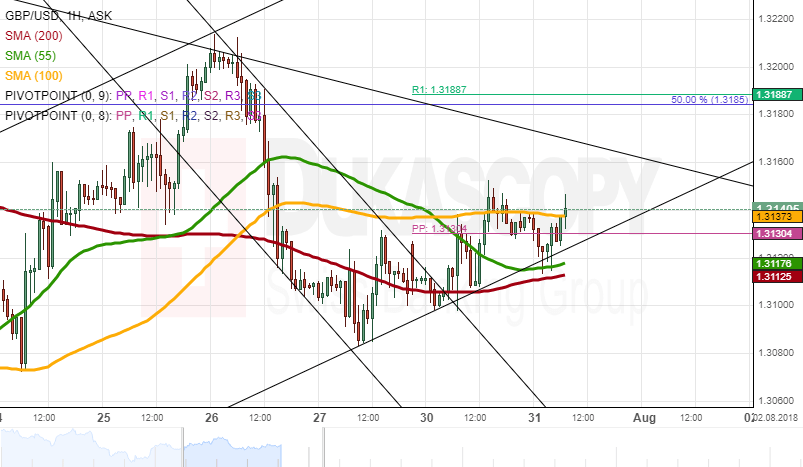
No changes occurred to the positioning of GBP/USD on Monday. Lack of outside pressure resulted in the pair remaining between the 100– and 200-hour SMAs in the 1.3100/50 area. It does show a slight tendency upwards along the bottom channel line.
The Pound failing to pick up momentum during the previous trading sessions allows to think that some bearish pressure could dominate the pair in the short term. This move should still be confirmed with a southern breakout of the 55– and 200-hour SMAs. In case this occurs, the Sterling should approach the weekly S1 at 1.3040.
Conversely, the rate surpassing the 100-hour SMA would result in a test of the 50.00% Fibonacci retracement, the weekly R1 and the 200-period (4H) SMA at 1.32.
USD/JPY Analysis: Increases Volatility
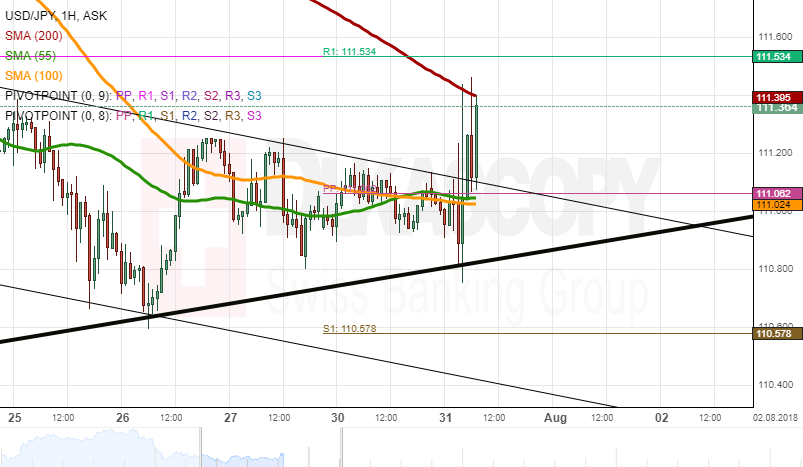
The previously-low volatility of USD/JPY changed early today when the Bank of Japan pledged to keep its interest rates at low levels, as the rate started fluctuating between the 200-hour SMA and a senior channel line. The US will release several data sets today; thus, the current movement sideways might end today.
Given that the Greenback has moved above the 55– and 100-hour and 200-period (4H) SMAs, these moving averages might provide support for the rate.
However, traders should still consider the strong resistance cluster set by the 55– and 100-period SMAs and the weekly R1 at 111.55. A breakout from this level should be followed by a surge up to 113.00 in the medium term. Technical indicators suggest that this appreciation might occur within the following week.
XAU/USD Analysis: Remains Under SMAs
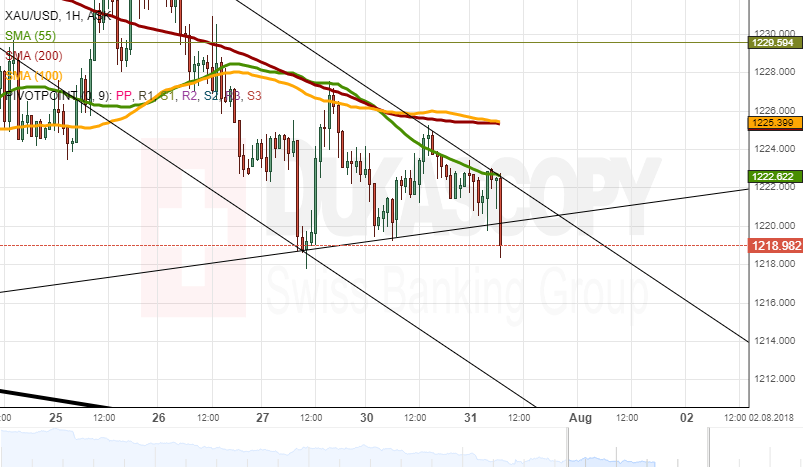
Gold trading above the 1,220.00 mark during the following two sessions has revealed a two-week ascending triangle. XAU/USD has recently failed to accelerate from its bottom boundary, being bounded by the 55-, 100– and 200-hour SMAs.
Technical indicators on longer-term charts show that the tendency does remain upwards, so it is likely that the nearest resistance cluster at 1,225.580 is breached. In line with this scenario, the yellow metal should aim for the upper triangle line at 1,235.00.
In case the 55-period (4H) and -hour SMAs prove to be stronger, this pattern should be breached to the downside. The next support is the monthly S2 at 1,206.00. It should be noted that monthly pivot points will be recalculated tomorrow, as a new month begins.
USDJPY Outlook: Initial Range Remains Intact After BoJ, Fed Eyed For Stronger Signals
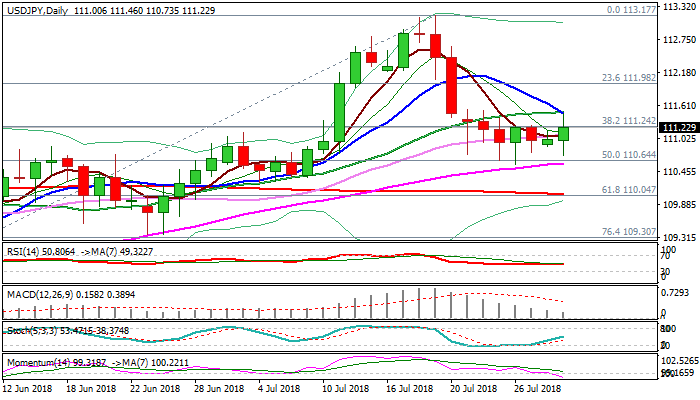
The pair spiked to one-week high at 111.46 after BoJ decision, but gains were so far short-lived and capped by sideways-moving 20SMA, reinforced by formation of bear-cross with falling 10SMA, keeping week-long congestion intact.
The Bank of Japan made little changes to the policy on today’s meeting, disappointing many who expected more drastic action.
The central bank kept interest rate unchanged as expected and kept its massive stimulus program, required by stubbornly low inflation, but will look for changes in the policies on other parts of the economy, to reduce cost of prolonged delay in starting to tighten the policy.
Overall little change done by the central bank against the expectations for more significant steps, made minimum impact to the USDJPY pair.
Initial range between 110.58 (55SMA) and 111.50 (converged 10/20SMA’s) remains intact and break of either boundary would provide firmer direction signal.
Mixed daily techs (strongly bearish momentum, bullish slow stochastic, mixed setup of MA’s and neutral RSI), lack signals and turning focus towards tomorrow’s FOMC verdict, which is expected to spark stronger action.
Break and close above upper pivots at 111.50/57 (20SMA / Fibo 38.2% of 113.17/110.58 pullback) would activate bullish scenario for recovery extension towards Fibo barriers at 111.88 (50%) and 112.18 (61.8%), with break above the latter to confirm higher low at 110.58.
Bearish scenario requires close below 55SMA to generate bearish signal for test of key supports at 110.00 zone (200SMA / Fibo 61.8% of 108.11/113.17 rally / daily cloud top) violation of which would be strong bearish signal.
Res: 111.50, 111.57, 111.88, 112.18
Sup: 110.73, 110.58, 110.06, 109.90
EURUSD Outlook: Bulls Pressure Triangle Upper Triangle Boundary, Data Could Help
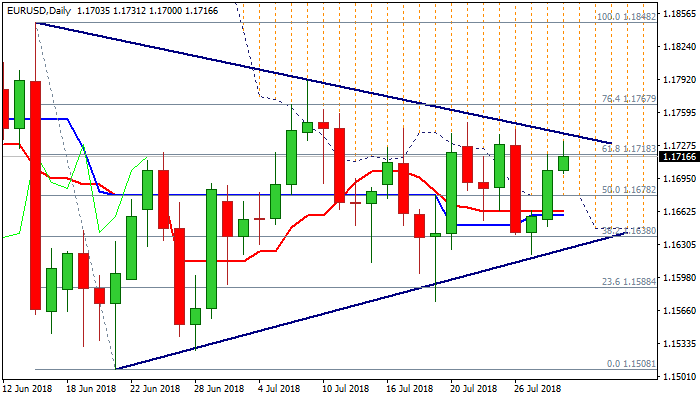
The Euro maintains bullish tone on Tuesday and extends rally from 1.1620 trough into third straight day.
Monday's strong rally which resulted in penetration and close in the daily cloud, was bullish signal.
Fresh strength broke above pivot at 1.1718 (Fibo 61.8% of 1.1848/1.1508 descend) and pressures key obstacle at 1.1738 (triangle resistance) break of which would generate next strong bullish signal.
Daily techs are supportive as MA's are in bullish setup and turning up, while north-heading momentum made bull-cross with its 7SMA and broke into positive territory.
German jobs data and EU CPI / GDP are key events for the single currency today and could spark stronger rally on upbeat releases.
Conversely, weaker than expected numbers would keep the Euro within narrowing range and wait for stronger signals from tomorrow's FOMC decision.
Res: 1.1734, 1.1750, 1.1767, 1.1790
Sup: 1.1700, 1.1682, 1.1635, 1.1620
The Analytical Overview Of The Main Currency Pairs
The EUR/USD currency pair
Technical indicators of the currency pair:
Prev Open: 1.16570
Open: 1.17033
% chg. over the last day: +0.41
Day's range: 1.17022 – 1.17074
52 wk range: 1.0571 – 1.2557
During yesterday's trading session, the bullish sentiment was observed on the EUR/USD currency pair. The growth of quotes exceeded 60 points. At the moment, the technical pattern is ambiguous: a trading instrument is in a sideways trend. The key support and resistance levels are 1.17000 and 1.17300, respectively. We recommend opening positions from these marks.
The news feed on 2018.07.31:
German unemployment change at 10:55 (GMT+3:00);
Consumer price index in the Eurozone at 12:00 (GMT+3:00);
CB consumer confidence index in the US at 17:00 (GMT+3:00).
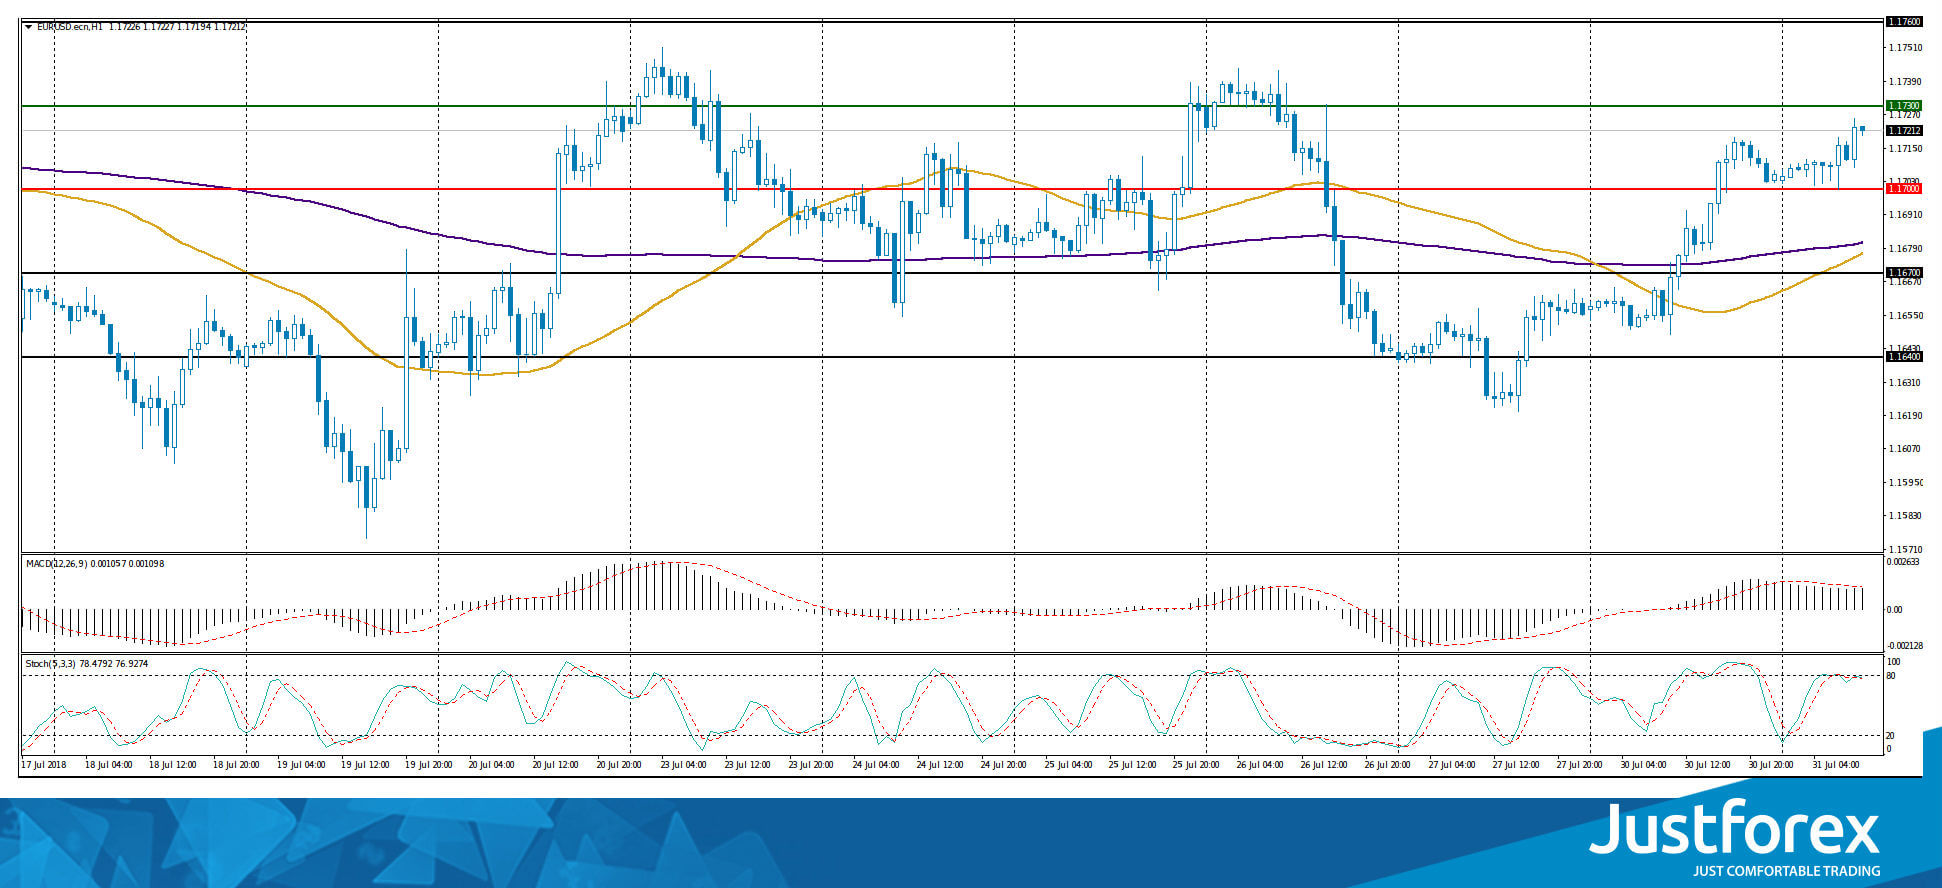
Indicators point to the power of buyers: the price has fixed above 50 MA and 200 MA.
The MACD histogram is in the positive zone, but below the signal line, which gives a weak signal to buy EUR/USD.
Stochastic Oscillator is in the neutral zone, the %K line is crossing the %D line. There are no accurate signals.
Trading recommendations
Support levels: 1.17000, 1.16700, 1.16400
Resistance levels: 1.17300, 1.17600
If the price fixes below the round level of 1.17000, we recommend considering sales of EUR/USD. The movement is tending to 1.16700-1.16400.
Alternative option. If the price fixes above the resistance level of 1.17300, the EUR/USD quotes are expected to rise. The movement is tending to 1.17600-1.17800.
The GBP/USD currency pair
Technical indicators of the currency pair:
Prev Open: 1.31090
Open: 1.31359
% chg. over the last day: +0.20
Day's range: 1.31343 – 1.31452
52 wk range: 1.2361 – 1.4345
There is a variety of trends on the GBP/USD currency pair. At the moment, the local support and resistance levels are 1.31200 and 1.31550, respectively. The positions should be opened from these marks. Investors expect the Bank of England interest rate decision, which will be taken on Thursday, August 2.
Today, the publication of important news from the UK is not expected.
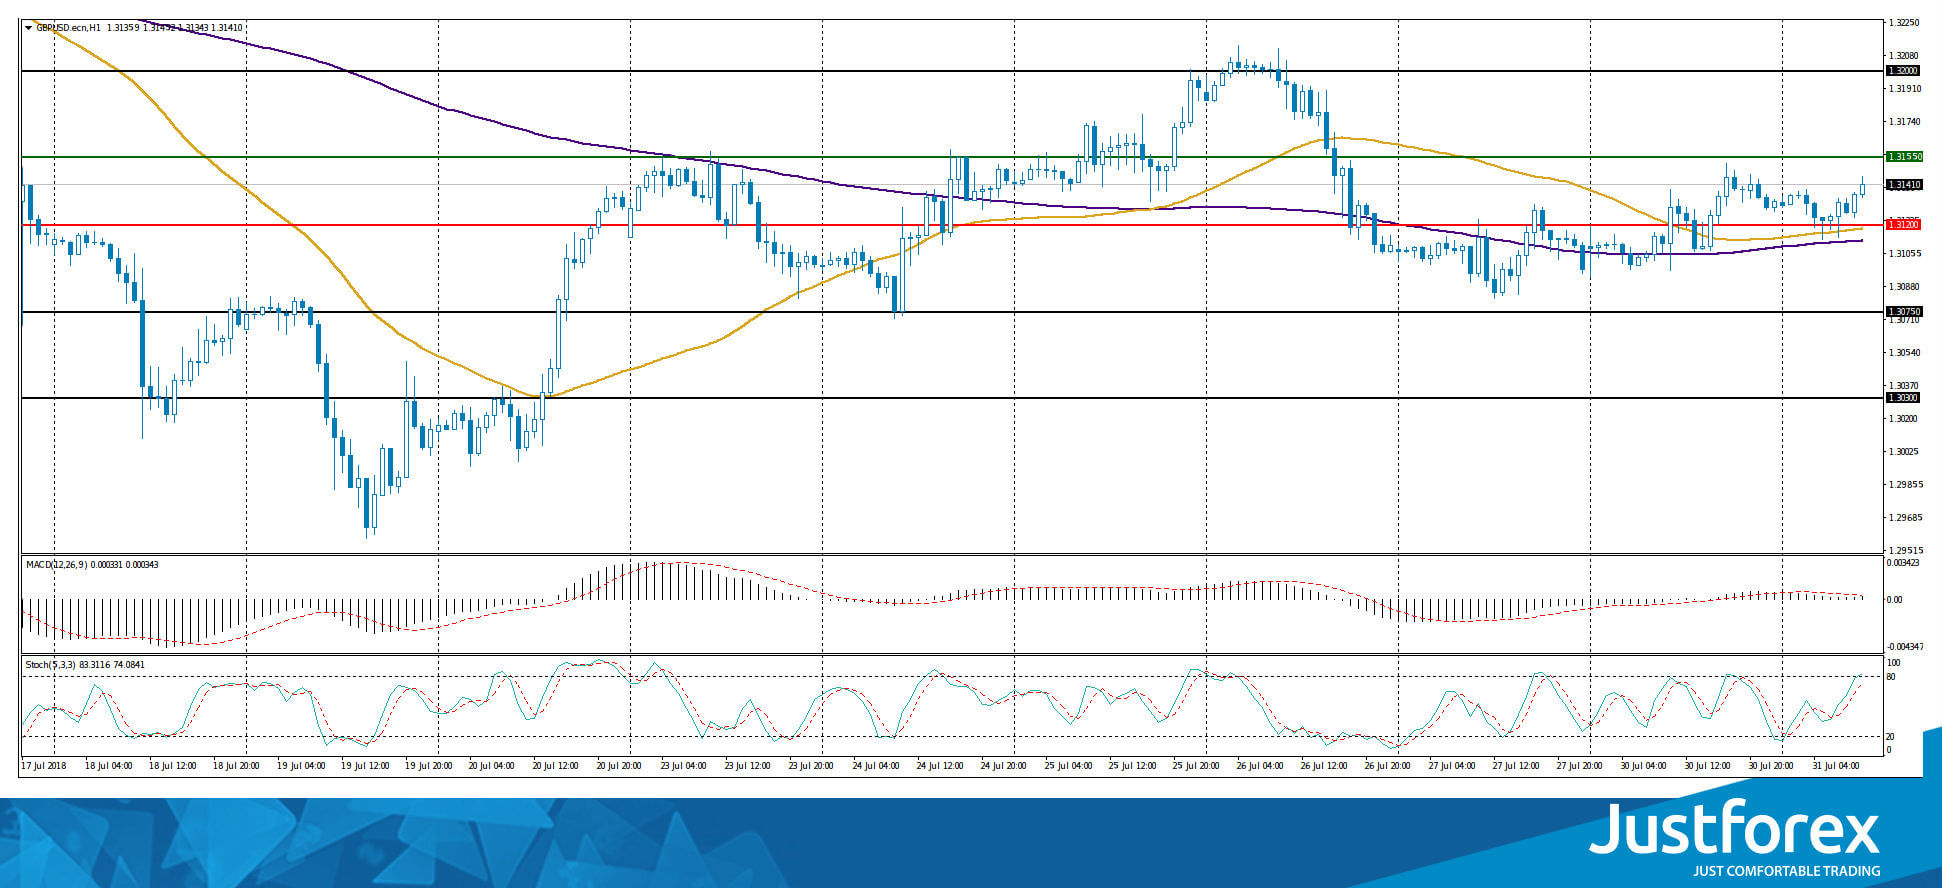
The price has fixed above 50 MA and 200 MA, which indicates the power of buyers.
The MACD histogram is near the 0 mark.
Stochastic Oscillator is located near the overbought zone, the %K line is above the %D line, which gives a signal to buy GBP/USD.
Trading recommendations
Support levels: 1.31200, 1.30750, 1.30300
Resistance levels: 1.31550, 1.32000
If the price fixes below 1.31200, we recommend considering sales of GBP/USD. The movement is tending to 1.30750-1.32300.
Alternative option. If the price fixes above the resistance of 1.31550, the GBP/USD currency pair is expected to grow. The movement is tending to the round level of 1.32000.
The USD/CAD currency pair
Technical indicators of the currency pair:
Prev Open: 1.30515
Open: 1.30315
% chg. over the last day: -0.28
Day's range: 1.30322 – 1.30449
52 wk range: 1.2059 – 1.3795
There is a variety of trends on the USD/CAD currency pair. Investors took a wait-and-see attitude before the Fed meeting, which will be held tomorrow, August 1. At the moment, the key support and resistance levels are 1.30200 and 1.30600, respectively. The positions should be opened from these marks. We recommend paying attention to the dynamics of oil quotes.
At 15:30 (GMT+3:00) data on Canada GDP will be published.
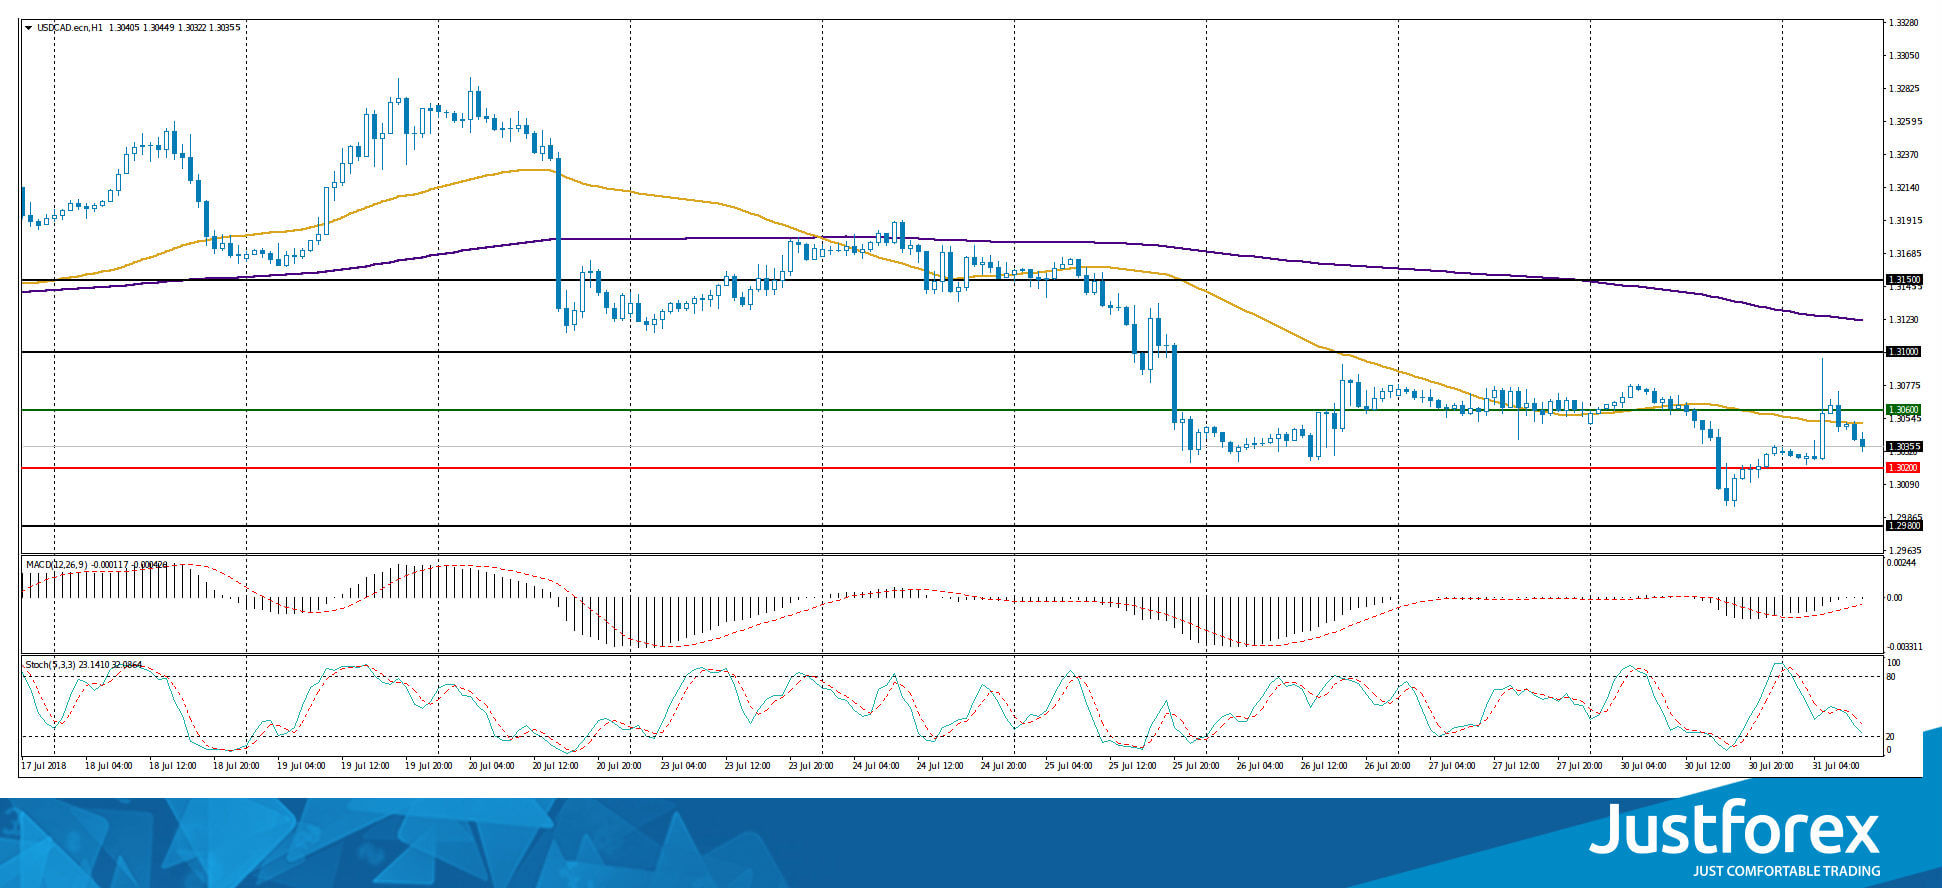
Indicators point to the power of sellers: the price has fixed below 50 MA and 200 MA.
The MACD histogram is near the 0 mark. There are no signals.
Stochastic Oscillator is in the neutral zone, the %K line is below the %D line, which gives a signal to sell USD/CAD.
Trading recommendations
Support levels: 1.30200, 1.29800
Resistance levels: 1.30600, 1.31000, 1.31500
If the price fixes below the support level of 1.30200, we recommend considering sales of USD/CAD. The movement is tending to 1.29800-1.29600.
If the price fixes above 1.30600, it is necessary to look for entry points to the market to open long positions. The target movement level is 1.31000-1.31200.
The USD/JPY currency pair
Technical indicators of the currency pair:
Prev Open: 110.936
Open: 112.120
% chg. over the last day: +0.05
Day`s range: 110.919 – 110.994
52 wk range: 104.56 – 114.74
The technical pattern on the USD/JPY currency pair is ambiguous. Quotes are still in a sideways trend. Investors expect additional drivers. At the moment, the trading instrument is moving in the range of 110.900-111.350. Positions should be opened from the key support and resistance levels. We recommend paying attention to the 10-year US government bonds yield.
Today, during the Asian trading session, the Bank of Japan meeting has taken place.
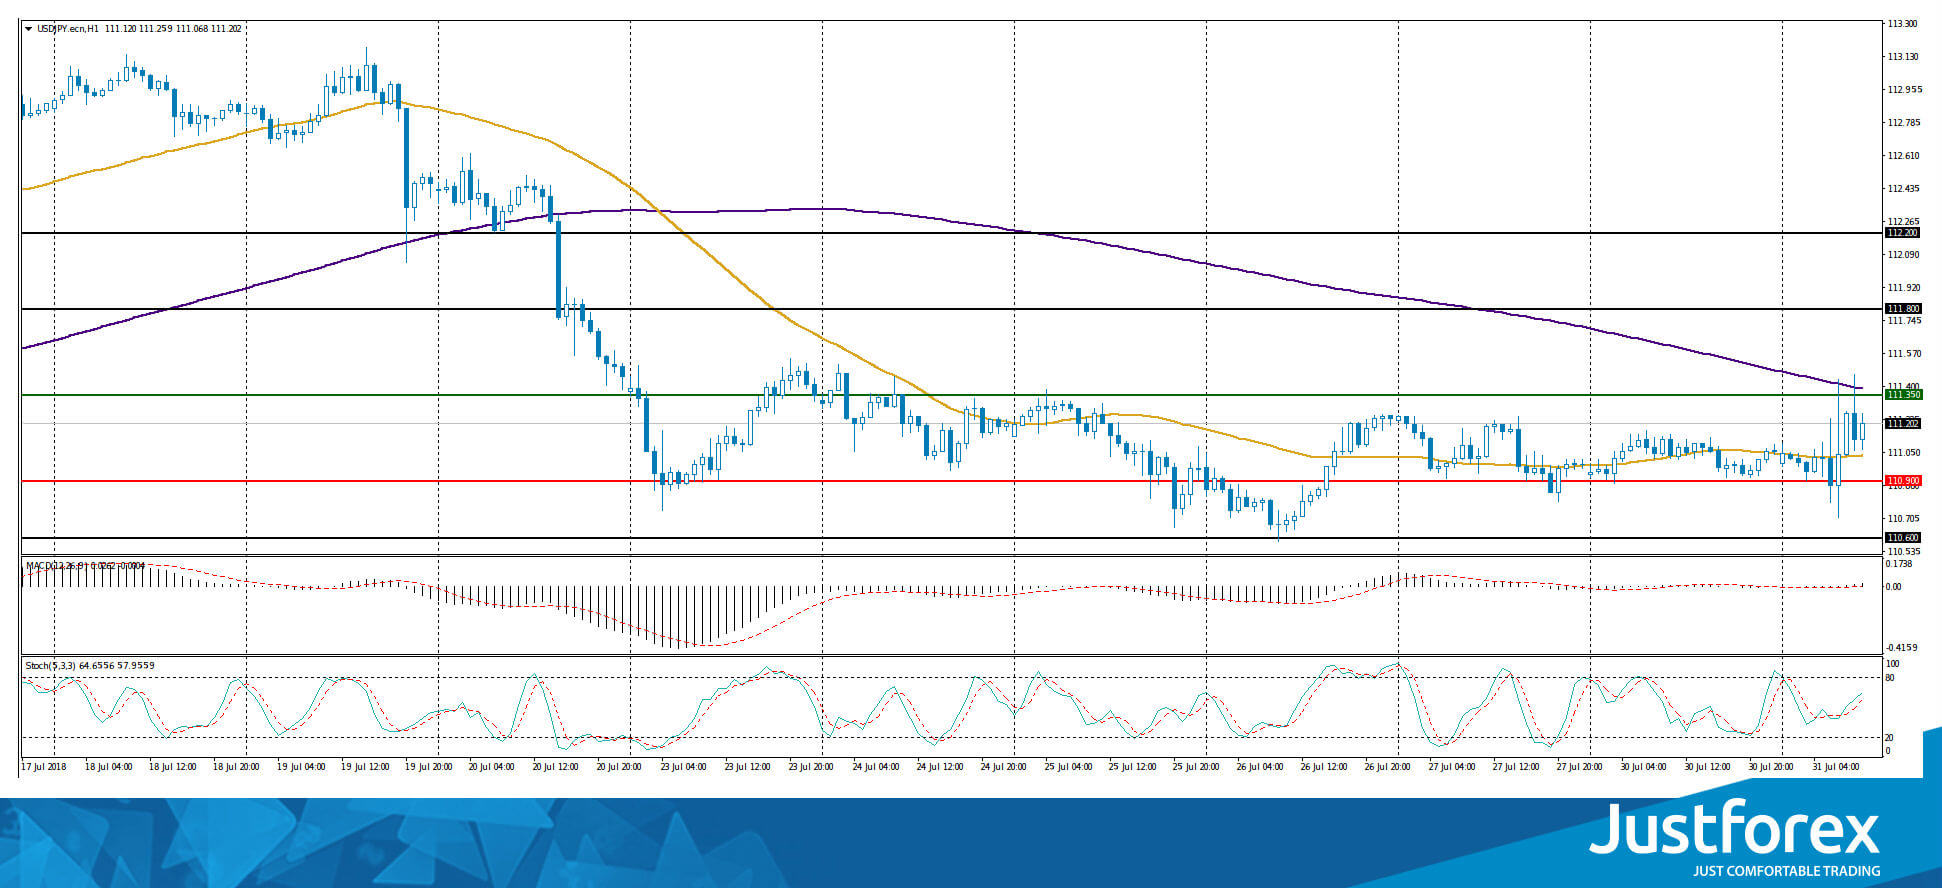
Indicators do not send accurate signals: the price is being traded between 50 MA and 200 MA.
The MACD histogram is near the 0 mark.
Stochastic Oscillator is located in the neutral zone, the %K line is above the %D line, which indicates the USD/JPY quotes growth.
Trading recommendations
Support levels: 110.900, 110.600
Resistance levels: 111.350, 111.800, 112.200
If the price fixes below the support of 110.900, we recommend considering sales of USD/JPY. The movement is tending to 110.600-110.300.
Alternative option. If the price fixes above the level of 111.350, the USD/JPY currency pair is expected to grow. The movement is tending to 111.800-112.000.
Meetings Of The Central Banks Are In The Focus Of Attention
The US dollar is moving in different directions against the basket of major currencies. Yesterday, the pending home sales index was published, which counted to 0.9% and was above the forecasted value of 0.4%. However, despite this, the US dollar index (#DX) closed in the negative zone (-0.34%) yesterday. In general, demand for the US currency is still high. Investors took a wait-and-see attitude before the Fed interest rate decision, which will be taken tomorrow, August 1. It is expected that the regulator will leave the interest rate unchanged at 2.00%.
Today during the Asian trading session the Bank of Japan meeting has taken place, at which it has been decided to leave the key interest rate unchanged at the level of -0.10%. Financial market participants expect important economic statistics from the Eurozone, the US and Canada. On Thursday, August 2, the Bank of England meeting will be held.
The "black gold" prices are rising. At the moment, futures for the WTI crude oil are testing a mark of $69.70 per barrel. At 23:30 (GMT+3:00), a report on the API weekly crude oil stock will be published.
Market Indicators
Yesterday, the bearish sentiment was observed in the US stock market: #SPY (-0.52%), #DIA (-0.55%), #QQQ (-1.41%).
At the moment, the 10-year US government bonds yield is at the level of 2.93-2.94%.
The news feed on 2018.07.31:
- German unemployment change at 10:55 (GMT+3:00);
- Consumer price index in the Eurozone at 12:00 (GMT+3:00);
- Data on Canada GDP at 15:30 (GMT+3:00);
- CB consumer confidence index in the US at 17:00 (GMT+3:00).
IT Selloff Continues: Twitter And Facebook Still Did Not Find Support
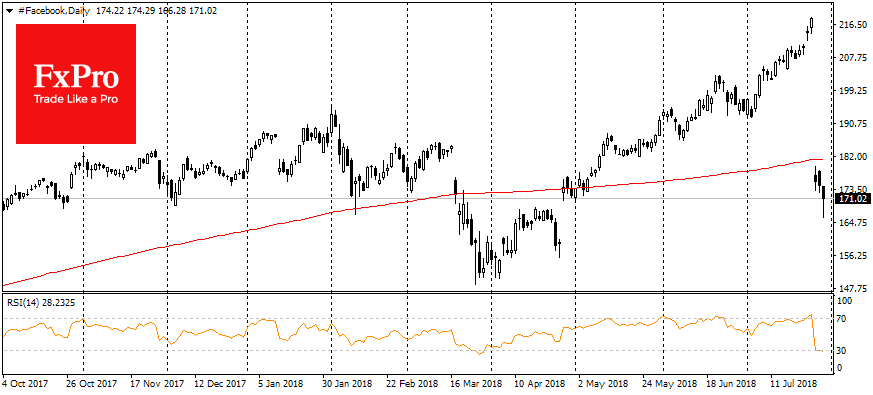
Sale off of technological stocks continues. Twitter and Facebook, the biggest movers last week, could not find support yesterday; moreover, they fell by 7.7% and 2%, respectively. Both shares are in the oversold area, according to RSI index that fell below the signal level 30 on the daily charts. However, technical analysis points out that the proper moment to buy will only be when the current sales impulse will lose power and the RSI will return above 30.
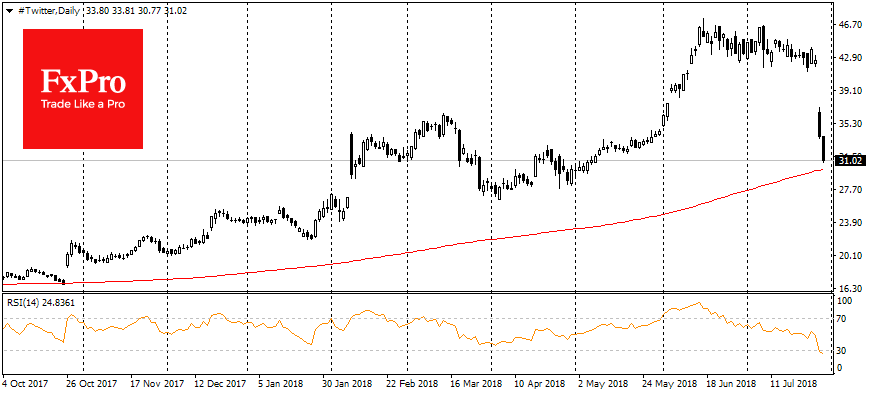
Current sale of IT shares should be considered as a correction as this sector was the key driver of the market in the previous months. Twitter Lost 27% in the latest three trading sessions, but this huge move returned the company’s capitalization to the levels of May.
GBPUSD Rebounds On 10-Month Low But Remains Bearish In Medium-Term
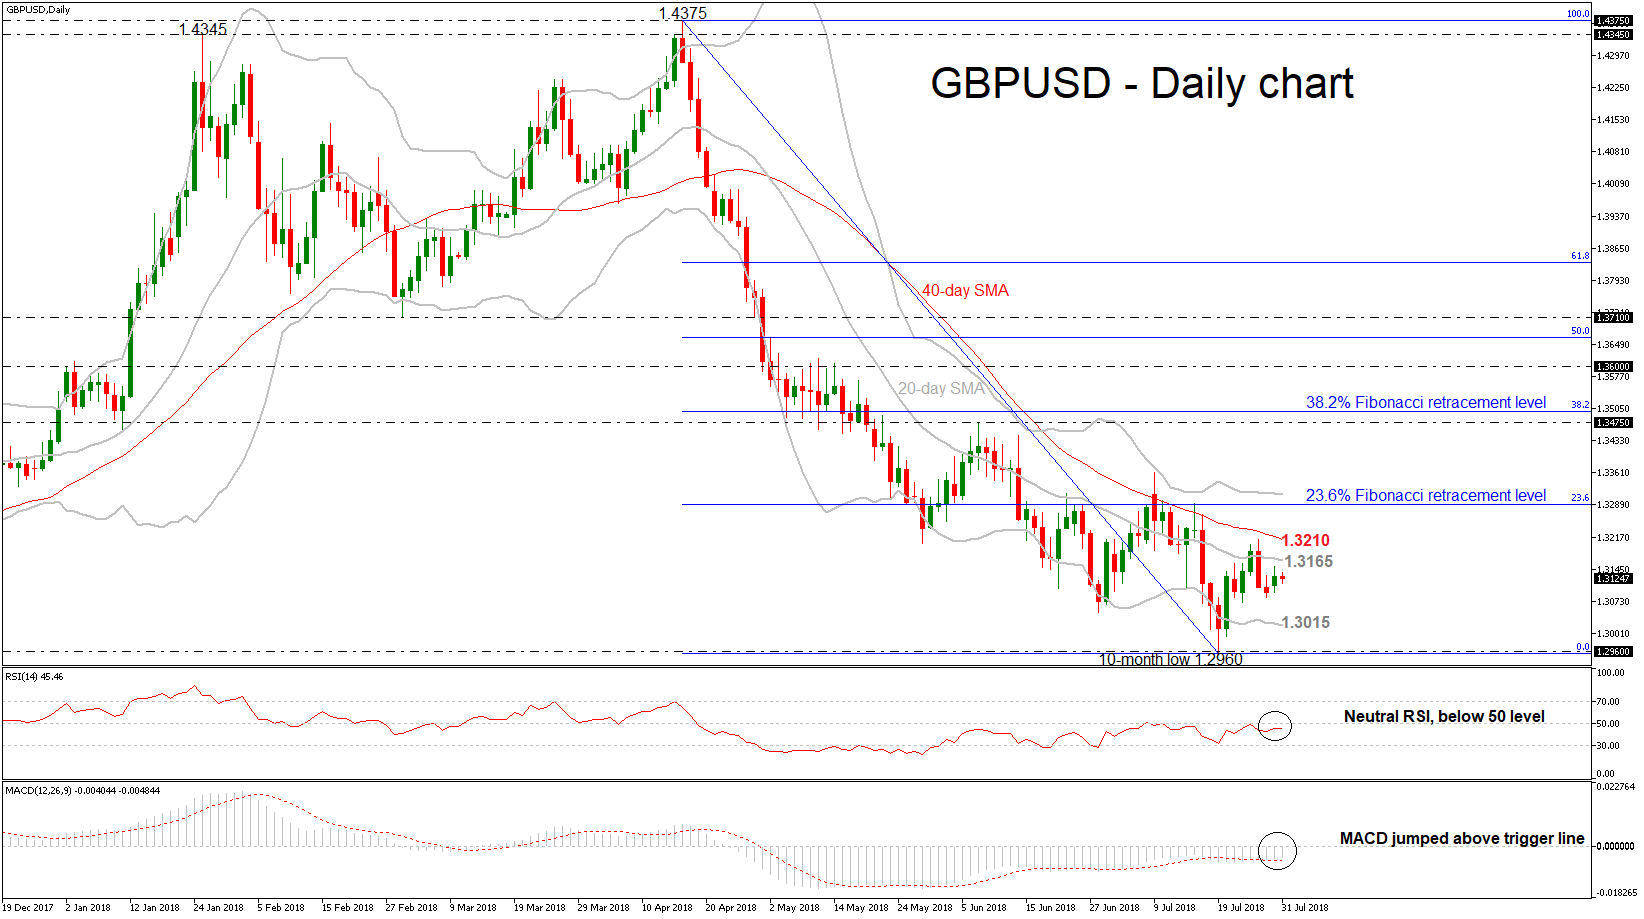
GBPUSD has eased a bit after its downfall from the 1.4375 resistance barrier, finding support at the 10-month low of 1.2960 on July 19. Since the previous week the price is trading slightly higher, however, it remains below the mid-level of the Bollinger Band (20-SMA) and the 40-day simple moving average (SMA).
In the short-term, the neutral to bearish bias is likely to be continued as the RSI has flattened slightly below its threshold of 50 and the MACD has paused its downward move as it jumped above the trigger line. Still, downside risks have not been faded out yet as both indicators continue to fluctuate in bearish territory.
On the upside, the area between the 20- and 40-SMA around 1.3165 and 1.3210 respectively, could provide immediate resistance as it did in the past two weeks. Beyond this area, resistance could then run towards the 23.6% Fibonacci retracement level of the downleg from 1.4375 to 1.2960, near 1.3290. Yet, the cable needs to successfully break this level to endorse bullish sentiment again. Above this area, it could challenge the 1.3475 key level, taken from the high on June 7.
Alternatively, should the price continue south again, it would be interesting to see whether the lower Bollinger band can stop providing support, around 1.3015. The immediate support is coming from the 10-month low (1.2960) and if the market could drop below this low, the 1.2770 level could be another target given that this zone has been frequently tested during 2017.
Regarding the bigger picture, the sharp sell-off, especially in the past four months, has shifted the long-term outlook from positive to negative.
Yen Drops As BoJ Delivers No Fireworks, Eurozone Inflation And GDP Growth Eyed
Here are the latest developments in global markets:
FOREX: The US dollar index is practically unchanged on Tuesday, after it posted considerable losses in the previous session. The yen, meanwhile, fell across the board after the BoJ delivered only minor tweaks to its policy framework, disappointing those looking for a major hawkish turn (see below). The loonie also had a rather volatile time, amid conflicting NAFTA headlines.
STOCKS: Wall Street closed lower yesterday, as a notable selloff in tech stocks dragged the broader equity indices down. The tech-heavy Nasdaq Composite (-1.39%) declined for the third straight session, while the S&P 500 (-0.58%) and the Dow Jones (-0.57%) did not escape unscathed either. Some of the biggest underperformers were Twitter (-8.03%), Netflix (-5.70%), and Facebook (-2.19%). That said, futures point to a slightly higher open for the S&P, Dow, and Nasdaq 100 today. Asia was mixed on Tuesday, with Japan’s Topix falling by 0.84%, while the Nikkei 225 rose a marginal 0.039%. The BoJ announced that it will increase the ratio of ETFs it purchases linked to the Topix moving forward. In Hong Kong, the Hang Seng dropped 0.53%. In Europe, futures were pointing to a mixed open today.
COMMODITIES: Oil prices rose on Monday, as the US dollar – in which the precious liquid is denominated – declined. A weaker greenback increases the appeal of oil for investors using foreign currencies. That said, both WTI and Brent are lower by 0.43% and 0.47% respectively on Tuesday, giving back some of their gains following a Reuters survey suggesting OPEC raised its production by around 70,000 barrels per day in July. In precious metals, gold continues to show “no signs of life”, with price action being contained in an extremely narrow range over the past few days. The dollar-denominated metal is currently hovering around $1,220 per ounce, flirting with its lows for the year at $1,211, and unable to draw any support from the recent pullback in the greenback.
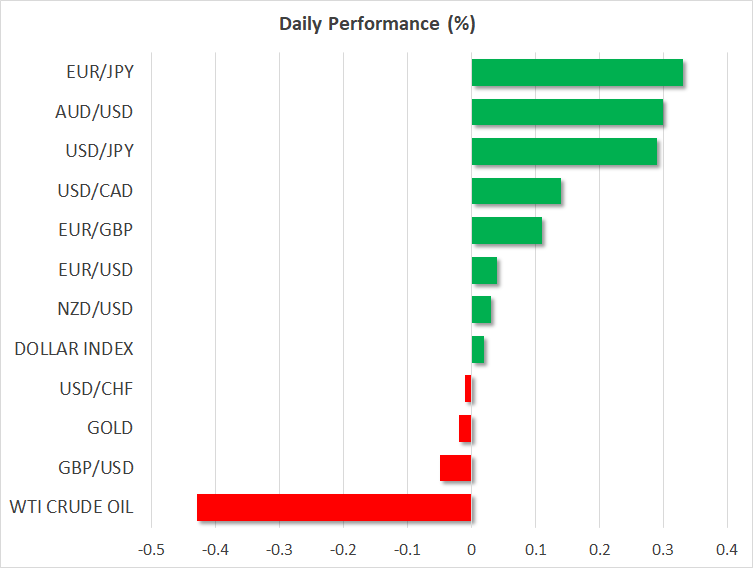
Major movers: Yen drops after “no smoking gun” from BoJ; euro regains ground
The Bank of Japan (BoJ) kept its policy rate unchanged at -0.1% earlier today, while it also made some tweaks to its policy, albeit relatively minor ones. It decided to allow the yields on longer-term Japanese Government Bonds (JGBs) more flexibility to move to the upside or the downside, but that it would keep the yield target unchanged near zero percent. In other words, it will widen the range around which the 10-year JGB yield can fluctuate, but the center of that range would remain unchanged. It also introduced forward guidance stating that interest rates will remain at very low levels for an extended period of time. Inflation forecasts were revised lower.
Overall, the BoJ made only minor adjustments aimed at enhancing its policy flexibility, and was not perceived as taking its foot off the accelerator – as had been speculated. Hence, yields on 10-year JGBs dropped immediately on the decision while the yen retreated, giving back some of the gains it had posted in recent days on speculation for a hawkish twist. Moving forward, although there remain some key questions to be answered – such as how high the Bank will allow yields to go before intervening – the bigger narrative of monetary policy divergence between Japan and other economies remains largely intact. This implies that interest rate differentials could continue to work against the yen moving forward.
The euro, meanwhile, advanced across the board yesterday, even despite preliminary CPIs out of Germany being a touch softer than expected. A fresh slew of Eurozone data today – including the bloc’s preliminary inflation figures – will likely guide price action in euro pairs.
Elsewhere, the Canadian dollar had a volatile ride. The currency initially surged on Monday after US Commerce Secretary Ross said that the trade deal closest to its completion is NAFTA. The move was short-lived though, with the loonie giving back all its Ross-related gains to trade even lower following reports overnight that US officials rejected Canada’s bid to take part in NAFTA talks between the US and Mexico this week.
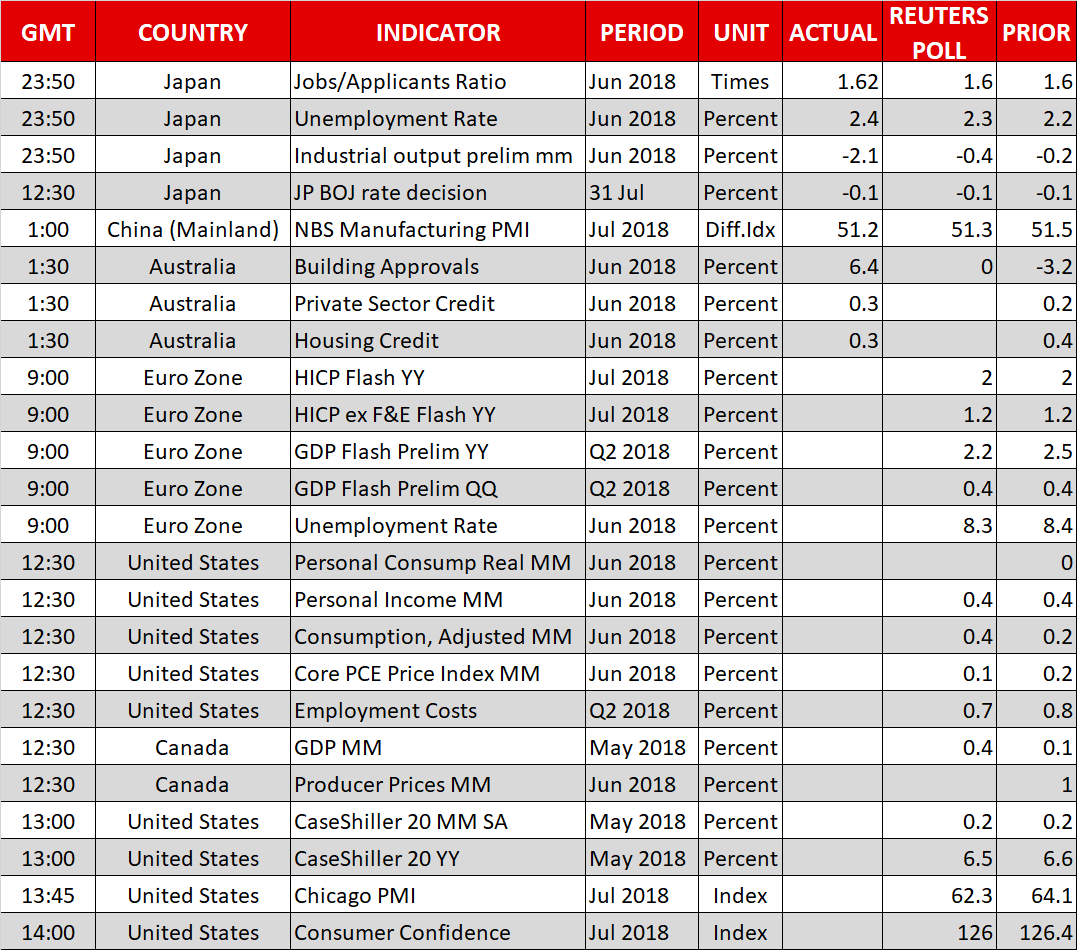
Day ahead: Eurozone inflation and GDP on the horizon; US core PCE price index and Canadian GDP also out
Eurozone flash inflation figures for July, as well as preliminary Q2 GDP estimates and data on unemployment out of the bloc are on the agenda on Tuesday. Meanwhile, the core PCE price index and numbers on personal income & consumption are due out of the US, while Canada will be seeing the release of monthly GDP data.
Projections are pointing to mostly unchanged inflationary pressures and economic activity in the eurozone during July and Q2 respectively. Specifically, the Harmonised Index of Consumer Prices (HICP), that uses a common methodology across EU countries, is anticipated to grow by 2.0% in yearly terms, the same as in June. The core HICP rate that excludes food and energy items is forecast to expand by 1.2%, again the same as in June.
Turning to eurozone GDP growth, it’s rate of expansion is expected to match Q1’s 0.4% in quarterly terms, something which would drag the annual pace of growth to 2.2%, from 2.5% previously. Lastly, the bloc’s unemployment rate for June is also due out and is projected to tick down to its lowest since late 2008 of 8.3%, from 8.4% in May. All numbers are due at 0900 GMT, while it is of note that Germany, the eurozone’s largest economy, will be seeing the release of unemployment data for July at 0755 GMT.
Out of the US, figures on personal income are expected to reflect a growth rate of 0.4% m/m in June, the same as in May. In the meantime, consumption is also expected to expand by 0.4% m/m, accelerating from the 0.2% rate seen in May. Most interest though might fall on the core PCE price index, this being the Fed’s preferred inflation gauge. The indicator of price pressures is anticipated to ease to 0.1% on a monthly basis in June, from 0.2% in May, though still post an annual growth rate of 2.0% after hitting the milestone – the US central bank’s inflation target – in May for the first time in six years. A better-than-forecasted inflation print can more conclusively put on the table two more rate hikes by the Fed in 2018, consequently boosting the greenback. The figures will be made public at 1230 GMT, alongside the reading on Q2’s employment costs.
Other US releases are May’s CaseShiller indices gauging house prices (1300 GMT), July’s Chicago PMI (1345 GMT) and the Conference Board’s consumer confidence index for the same month (1400 GMT) – the relevant index is expected at 126.0, only slightly weaker compared to June’s 126.4.
Canadian GDP data will be hitting the markets at 1230 GMT and are expected to show activity accelerating by 0.4% m/m in May, from 0.1% in April. June’s print on producer prices is due at the same time.
In equities, tech giant Apple will be releasing quarterly earnings after the US market close on Tuesday.
In energy markets, weekly API data on US crude stocks are due at 2030 GMT.
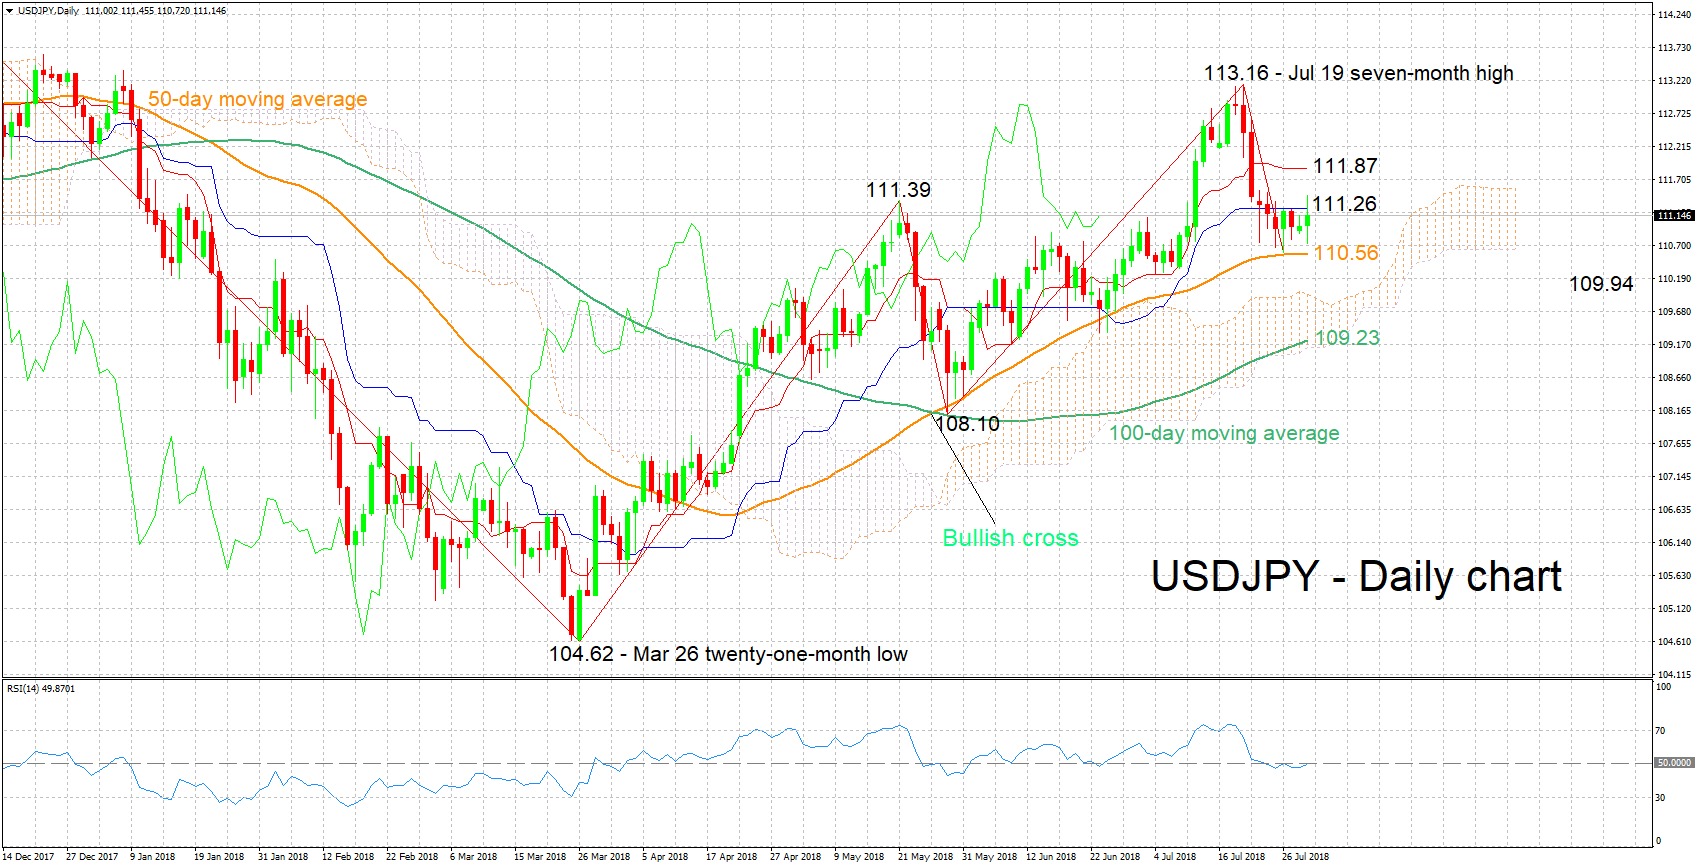
Technical Analysis: USDJPY predominantly neutral in the short-term
USDJPY has been largely moving sideways in recent days. The Tenkan- and the Kijun-sen lines are positively aligned, though they’ve both flatlined, on balance projecting a neutral picture in the short-term. This is also supported by the RSI, which is moving sideways on its 50 neutral level.
Stronger-than-anticipated core PCE price data are likely to boost the pair. Immediate resistance seems to be taking place around the current level of the Kijun-sen at 111.26, with the focus in case of an upside break falling to the region around the Tenkan-sen at 111.87 which also encapsulates the 112 round figure.
A weaker-than-expected inflation reading on the other hand, is likely to weigh on USDJPY. Given a fall below the 111 handle, support may come around the current level of the 50-day moving average line at 110.56, and then from the area around the Ichimoku cloud top at 109.94, including the 110 mark.