Sample Category Title
Aussie Trading On A Weaker Footing In The Morning Session
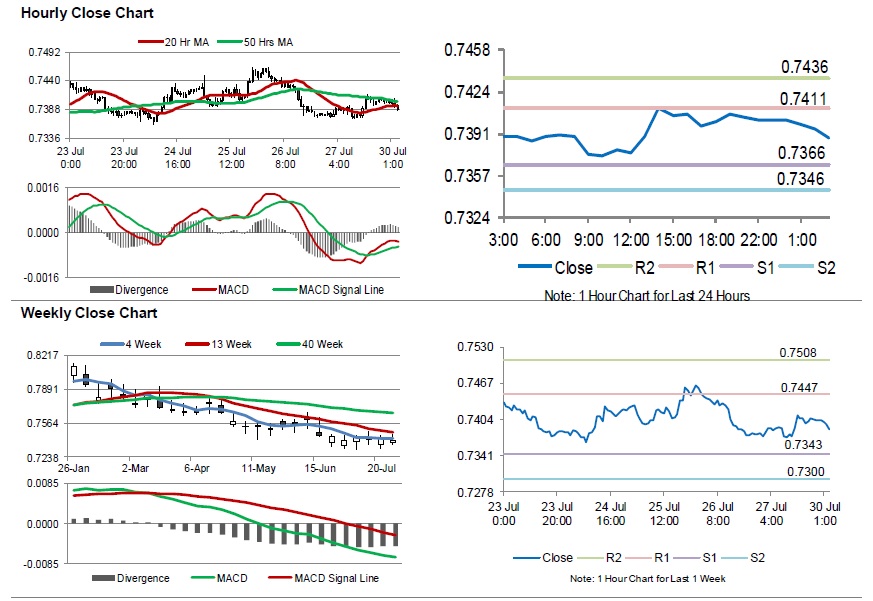
For the 24 hours to 23:00 GMT, the AUD rose 0.35% against the USD and closed at 0.7404 on Friday.
LME Copper prices declined 0.1% or $3.5/MT to $6251.5/MT. Aluminium prices rose 0.1% or $1.0/MT to $2055.0/MT.
In the Asian session, at GMT0300, the pair is trading at 0.7387, with the AUD trading 0.23% lower against the USD from Friday’s close.
The pair is expected to find support at 0.7366, and a fall through could take it to the next support level of 0.7346. The pair is expected to find its first resistance at 0.7411, and a rise through could take it to the next resistance level of 0.7436
Going ahead, traders will look forward to Australia’s building approvals for June, due to be released overnight.
The currency pair is showing convergence with its 20 Hr moving average and trading below its 50 Hr moving average.
Gold: Yellow Extends Its Losses In The Morning Session
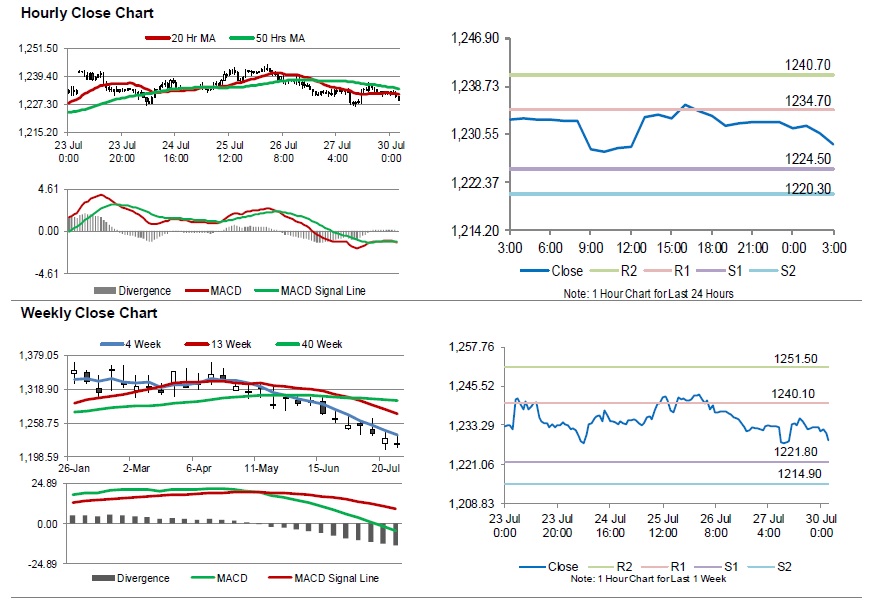
For the 24 hours to 23:00 GMT, Gold declined slightly against the USD and closed at USD1232.00 per ounce on Friday.
In the Asian session, at GMT0300, the pair is trading at 1228.70, with gold trading 0.27% lower against the USD from Friday’s close.
The pair is expected to find support at 1224.50, and a fall through could take it to the next support level of 1220.30. The pair is expected to find its first resistance at 1234.70, and a rise through could take it to the next resistance level of 1240.70.
The yellow metal is showing convergence with its 20 Hr moving average and trading below its 50 Hr moving average.
Silver: White Metal Reverses Its Gains In The Morning Session
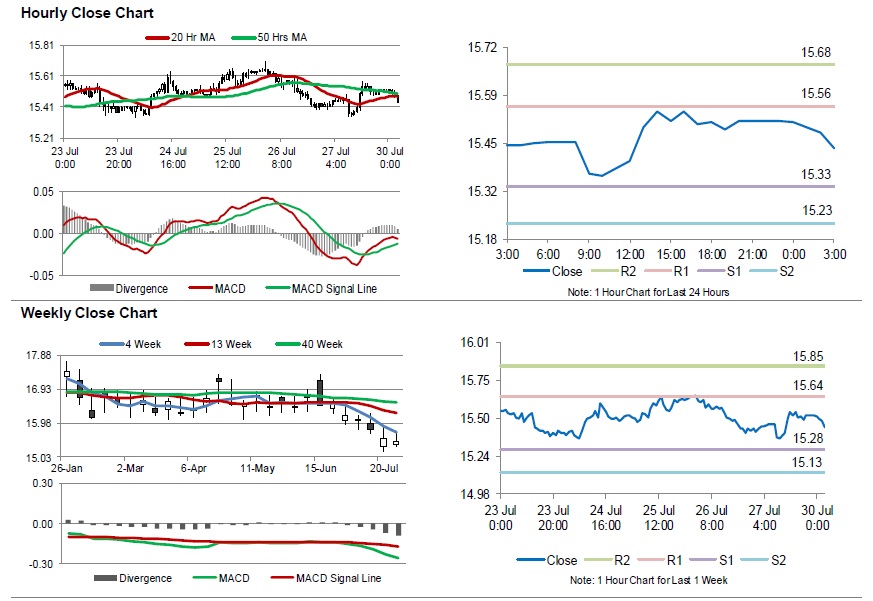
For the 24 hours to 23:00 GMT, Silver rose 0.65% against the USD and closed at USD15.52 per ounce on Friday.
In the Asian session, at GMT0300, the pair is trading at 15.43, with silver trading 0.52% lower against the USD from Friday’s close.
The pair is expected to find support at 15.33, and a fall through could take it to the next support level of 15.23. The pair is expected to find its first resistance at 15.50, and a rise through could take it to the next resistance level of 15.68.
The white metal is showing convergence with its 20 Hr and 50 Hr moving averages.
Crude Oil: Crude Oil Extends Its Losses In The Asian Session
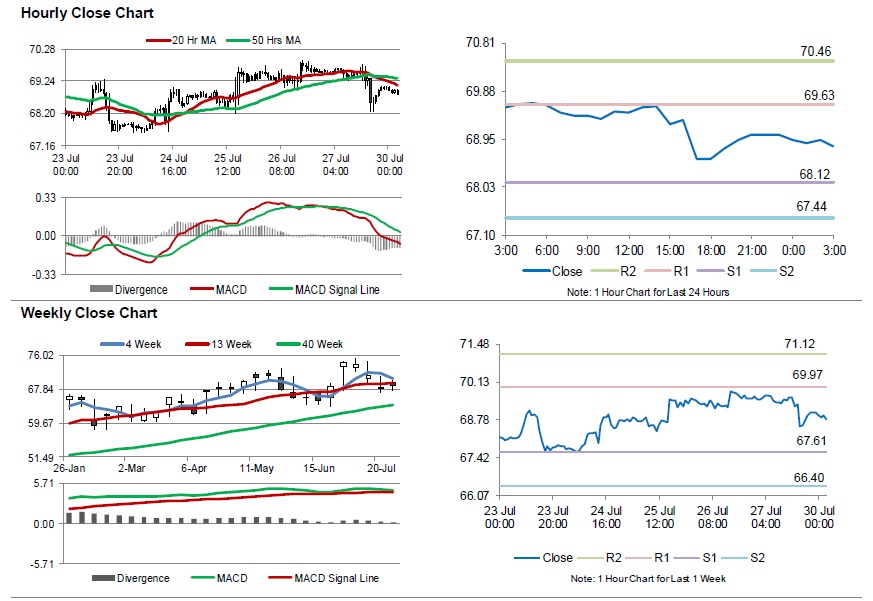
For the 24 hours to 23:00 GMT, Crude Oil declined 0.89% against the USD and closed at USD68.93 per barrel on Friday, after Baker Hughes reported that the number of active oil rigs rose by 3 to 861 in the week ended 27 July 2018.
In the Asian session, at GMT0300, the pair is trading at 68.81, with oil trading 0.17% lower against the USD from Friday’s close.
The pair is expected to find support at 68.12, and a fall through could take it to the next support level of 67.44. The pair is expected to find its first resistance at 69.63, and a rise through could take it to the next resistance level of 70.46.
Crude oil is trading below its 20 Hr and 50 Hr moving averages.
Forex Forecast and Cryptocurrencies Forecast
First, a review of last week's forecast:
EUR/USD. The past seven days, like the previous one and a half months, did not bring any significant events, and the market is in a lazy-holiday mood because of that. The pair's volatility is 130 points, and the maximum deviation from the Pivot Point of the medium-range lateral channel (1.1660) is even less - only 90 points, after which the pair returns to the central zone. So it happened this time as well - at the end of the trading session, it froze at 1.1658; the GBP/USD pair also behaved weakly, gradually consolidating near the horizon of 1.3100. The range of British currency fluctuations was not much higher than that of the euro and amounted to only about 145 points. The pair finished the week at the level of 1.3102;
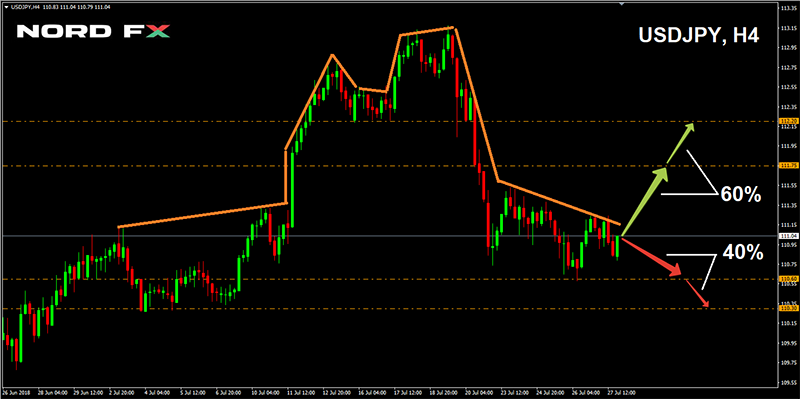
USD/JPY. This pair was painstakingly drawing the head-and-shoulders figure for the whole month of July, although to some, it might be more like a cowboy hat. Last week was devoted to the right field of this hat, which means a sideways trend within the boundaries of 110.58-111.53. As for the end of the week, the pair met it in the middle of the channel at around 111.00;
Cryptocurrencies. One of the development variants last week provided for a bitcoin attempt to break through the level of $8,000. And despite being overbought, it did it. The main growth driver was the expectation that the Securities and Exchange Commission (SEC) would still allow the Winklevoss brothers to launch Bitcoin ETF. The main trading volumes were traded at Japanese and South Korean crypto-exchanges.
But as soon as the BTC/USD approached the mark of $ 8,500, it became known that the SEC rejected the application of the brothers once again. As a result, bitcoin collapsed below the $8,000 horizon once again, losing about $630. However, the fall did not last long, and the pair once again broke through the eight-thousand level on Friday evening and reached the height of $8,275.
As for the main altcoins: etherium, ripple, litecoin, etc., they showed an average growth of 6-7%, following the bitcoin.
As for the forecast for the coming week, summarizing the opinions of a number of analysts, as well as forecasts made on the basis of a variety of methods of technical and graphical analysis, we can say the following:
EUR/USD. The next week will be filled with events, which at another time could initiate quite strong movements in the market. However, at the present moment, surprises should not be expected either from the data on the GDP of the Eurozone, or from the values of the consumer price index, which will be announced on Tuesday July 31.
If we look at other developments concerning the euro/dollar pair, one can note the decision of the US Federal Reserve on the interest rate and the Fed's subsequent comment on Wednesday, August 1, as well as the publication of data on the US labor market on Friday, August 3. But here, most likely, there will be only a small short-term increase in volatility.
As for the oscillators, their indications on D 1 were divided into almost equal parts - one third are for the growth of the pair, one third are for its fall and one third are for the sideways trend. But as for the experts, the overwhelming majority of them (70%) still tends to see the pair reduce to the lower boundary of the medium-term side channel 1.1505-1.1850. However, it is possible that the pair will stay within the two-week zone 1.1575-1.1750 for some time, and only then it will go down. It is this scenario that is drawn by the graphical analysis on D1.
This time only 30% of analysts voted for the growth of the pair to the upper border of the channel 1.1850;
The future of the British pound is not encouraging, even despite the possible increase by the Bank of England interest rate from 0.50% to 0.75%, which will be known on Thursday August 2. 65% of experts believe that the GBP/USD pair will continue its decline - first to the level of 1.3000-1.3070, and then to support 1.2955. The ultimate goal is the 2017 summer lows in the zone 1.2800.
An alternative point of view is represented by 35% of analysts who believe that the pair has reached the local bottom and will now return to the marks around 1.3200-1.3300. In their opinion, its rise during August to a height of 1.3450 is possible. 15% of oscillators side with the bulls as well, giving signals the pair is oversold;
USD/JPY. Here, the experts who support the strengthening of the dollar and the growth of the pair, at least, to the zone of 111.75-112.20. are preponderant (60%) The graphical analysis on H4 fully agrees with this.
The remaining 40% place their hopes to Tuesday, July 31. On this day, the Bank of Japan is likely to leave Interest rate unchanged at -0.1%, but the comments of the leadership of this regulator have a chance to support the yen. But this will happen only if there are at least hints of a change in monetary policy and an increase in the interest rate to positive values. In this case, the support is at levels 110.60, 110.30 and 109.75;
Cryptocurrencies. Traders, investors and miners have been looking forward to the bitcoin graph for the past few weeks. Since June 28, the rate of this currency has grown by 42%, and the total capitalization of the cryptomarket has exceeded 300 billion dollars. After the bitcoin reached the height of $8,500, there were quite a lot of chances that a $10,000 mark would be conquered. Moreover, many factors contribute to this. We list only a few of them:
- the first is the growth of political risks and, as a consequence, a decrease in the demand for "classical" assets and a decline in trading volumes in traditional markets. It is also possible to add instability in a number of countries, thanks to which crypto-currencies become a tool for saving the capital;
- the second factor is the emergence of new technological solutions for attracting large institutional investors at a number of crypto-exchanges;
- the third is more active recognition of cryptocurrencies at the state level, for example, in South Korea or in Venezuela. According to the statement of the president of this country, the Venezuelan currency bolivar will soon be tied to the national cryptocurrency Petro;
- the fourth one is the launch of a platform for the creation of crypto-exchanges;
- the fifth is statements of high state officials and other VIP-persons, like former Assistant to US President Steve Bannon, about their investments in bitcoin and other cryptocurrencies.
Experts believe that in case of growth of the pair BTC/USD above $10,000, there will be even more of those wishing to invest in bitcoin. As a result, there are more and more forecasts saying that the year-old rally may repeat, and bitcoin can rise well above $ 20,000 by the end of the year.
USD/CHF Daily Outlook
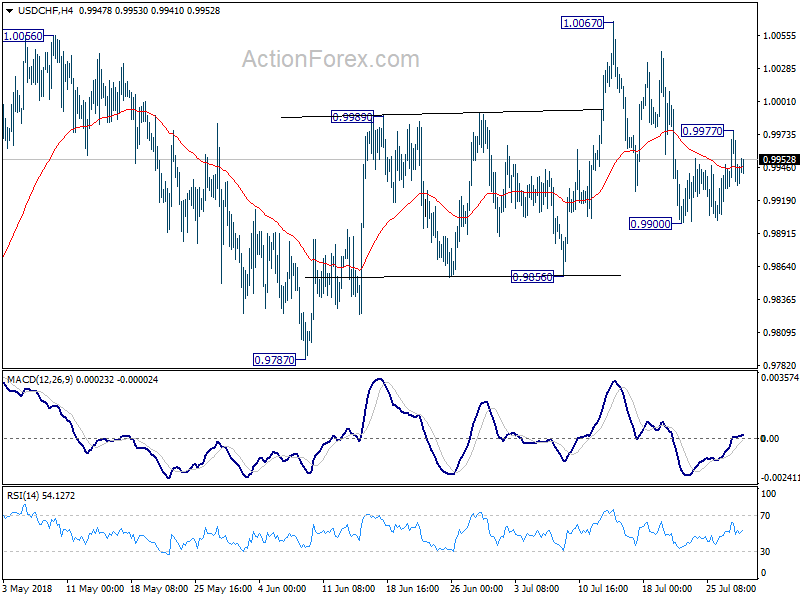
Daily Pivots: (S1) 0.9923; (P) 0.9951; (R1) 0.9974; More...
Intraday bias in USD/CHF remains neutral for the moment. We're slightly favoring the case that pull back from 1.0067 has completed already. On the upside, above 0.9977 minor resistance will extend the rebound from 0.9900 to retest 1.0067 high. Break will resume whole rally from 0.9186. However, on the downside, break of 0.9900 will target 0.9856 support instead.
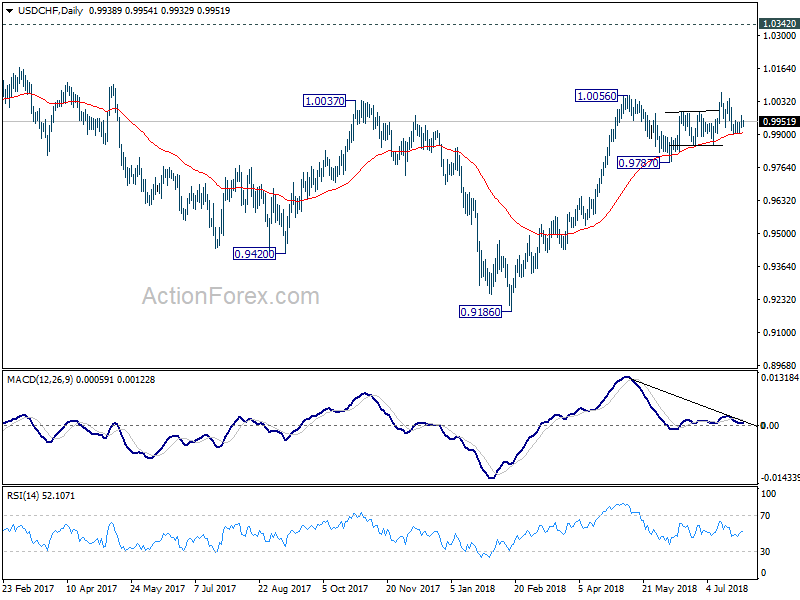
In the bigger picture, as long as 0.9787 support holds, we're favoring the bullish case. That is, rise from 0.9787 is resuming the whole up trend from 0.9186 and should target 1.0342 key resistance on resumption. However, break of 0.9787 will indicate medium term reversal and turn outlook bearish.
EUR/USD Holding Key Support Near 1.1620
Key Highlights
- The Euro tested a major resistance area near 1.1740-50 against the US Dollar and declined.
- There is a major bullish trend line in place with support at 1.1620 on the 4-hours chart of EUR/USD.
- The US Gross Domestic Product for Q2 2018 (Prelim) grew 4.1%, similar to the forecast.
- Today, the Euro Zone Economic Sentiment Indicator July 2018 will be released, which is forecasted to decline from 112.3 to 112.0.
EURUSD Technical Analysis
The Euro climbed higher this past week and broke the 1.1700 resistance against the US Dollar. However, the EUR/USD pair faced a strong resistance near 1.1740-50, resulting in a downside move.
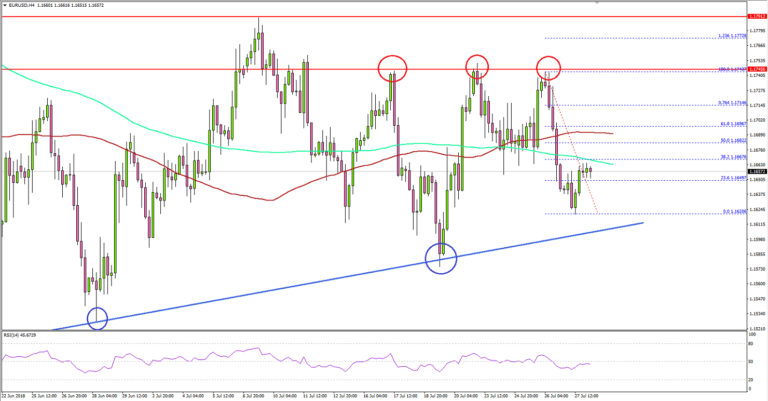
Looking at the 4-hours chart, it seems like the 1.1740-50 resistance is a crucial barrier for buyers. It acted as a resistance on many occasions and prevented an upside break towards 1.1800.
The dip was strong as the pair broke the 1.1700 support and settled below the 100 simple moving average (red, 4-hours). The pair traded as low as 1.1620 and is currently consolidating losses.
An initial resistance is near the 50% Fibonacci retracement level of the last decline from the 1.1743 high to 1.1620 low. Above this, the pair must clear the 1.1700 resistance and the 100 SMA to revisit the 1.1740 resistance.
Finally, a successful close above the 1.1740-50 resistance zone may well push the price towards 1.1800. On the downside, there a major bullish trend line in place with support at 1.1620 on the same chart. Should there be a break below this, EUR/USD could move into a bearish zone towards 1.1550.
Recently in the US, the Gross Domestic Product for Q2 2018 (Prelim) was released by the US Bureau of Economic Analysis. The market was looking for a rise of 4.1% in the GDP, more than the last +2.0%.
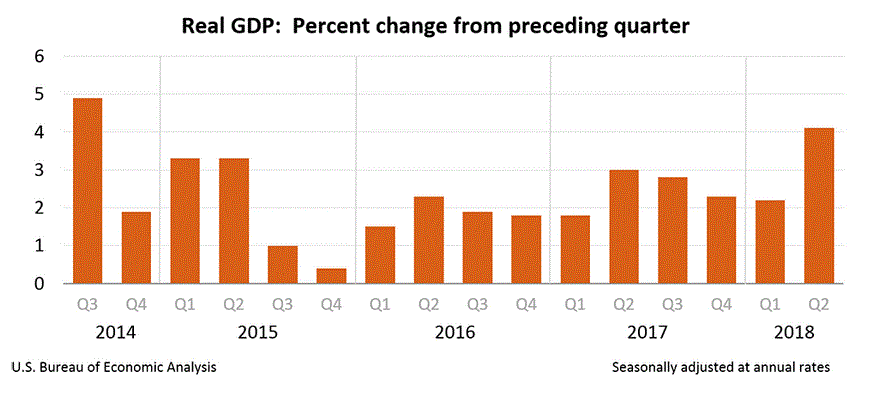
The actual result was similar to the forecast as the GDP grew 4.1% (according to the “advance” estimate), and the last reading was revised to 2.2%. The report added that:
The increase in real GDP in the second quarter reflected positive contributions from personal consumption expenditures (PCE), exports, nonresidential fixed investment, federal government spending, and state and local government spending that were partly offset by negative contributions from private inventory investment and residential fixed investment. Imports, which are a subtraction in the calculation of GDP, increased.
The US Dollar is currently trading with a positive bias, but pairs like are holding key supports, which could result in an upward move.
Economic Releases to Watch Today
- US Pending Home Sales for June 2018 (YoY) – Forecast -6.0%, versus -2.2% previous.
- German Consumer Price Index for July 2018 (YoY) (Prelim) – Forecast +2.1%, versus +2.1% previous.
- German Consumer Price Index for July 2018 (MoM) (Prelim) – Forecast +0.4%, versus +0.1% previous.
- Euro Zone Consumer Confidence July 2018 – Forecast -0.6, versus -0.6 previous.
- Euro Zone Services Sentiment July 2018 – Forecast 14.9, versus 14.4 previous.
- Euro Zone Economic Sentiment Indicator July 2018 – Forecast 112.0, versus 112.3 previous.
Market Morning Briefing: The FOMC Meet This Week Could Strengthen The Dollar Index
STOCKS
Dow (25451.06, -0.30%) saw a slight dip but this is temporary and seem to be part of the normal correction within the overall uptrend that may target 26000 or higher in the medium term.
Dax (12860.40, +0.40%) tested resistance near 12900 and could move sideways for a couple of sessions before again attempting levels near 13000 and higher. In the medium term, there is scope for an upside of 13100. Overall Dax looks bullish towards 13100 in the medium term with small corrections.
Nikkei (22584.47, -0.56%) is coming off from 22800 tested last week and while important resistance near 23000 holds, there is scope for Nikkei to come off towards 22400-22200 levels in the coming sessions. A break above 23000, if seen in the medium term, would trigger bullishness in the longer run and drag Dollar Yen to the upside.
Shanghai (2876.83, +0.11%) is trading below the resistance zone of 2900-2950 and while that holds, some sideways consolidation is possible. In the longer term, we may expect Shanghai to move up towards 2950 and beyond.
Nifty (11278.35, +0.99%) looks bullish while above 11200. Need to see if the index opens higher and continues to move up today also. While bullishness persists we may see a rise towards 11400 before a dip from there is seen.
COMMODITIES
Nymex WTI (68.82, +0.19%) has immediate support on the daily candles and while that holds, an immediate fall below 68 looks unlikely. A rise from 68 is possible this week, targeting higher levels near 71. Near term looks bullish above 68.
Brent (74.22, -0.09%) has been stable in the last 3-sessions and could move up towards 76 from where a short dip is possible.
Gold (1228.80, +0.47%) could spend some time in the 1210-1240 region before trying to break on either side. A maximum downside of 1200 is seen in the near term followed by a rise which is expected to start soon.
While above 2.70-2.75, Copper (2.7885, -0.48%) is likely to move up towards 2.90-2.95 in the coming sessions. A re-test of 2.70 is possible while below 2.95.
FOREX
Euro (1.1650): Inspite of record US GDP Q2 growth figures, Euro did not weaken much on Friday since the data could not surpass expectations. The BoJ and FOMC meets this week could possibly weaken the Euro if there is a hawkish tilt to both the Central Banks' policy statements. There is a chance that support at 1.16 could be broken this week and lower support near 1.150-1.145 (seen on daily line chart) - could be tested in 2 weeks time. The alternative scenario is that the Euro sees 1 more week of ranging between 1.1725-1.16 before deciding further direction.
Dollar Index (94.74): The FOMC meet this week could strengthen the Dollar Index as the overtones in the policy statement could be hawkish (rate hike not expected). If that happens, a rise towards 95.5 is likely. The 95.5-96.0 resistance zone is important and a breach above that is uncertain. If it happens, it could make the Index bullish for the next 1-2 months.
Dollar Yen (111.12): Dollar Yen is still trading near the trendline support at 111. Higher up, there is crucial resistance near 112.5 on weekly candles. Lower down, there are interim supports at 110.5 and 110.0. If the BoJ (in its meet over today-tomorrow) decides to bring in even slight tightening to its loose monetary policy (of which, there are some rumours), then it might lead to strength in the Yen and hence, a break below 110.
Euro Yen (129.47): Support near 129.4-129.2 on daily line and weekly line charts are holding for Euro Yen currently. However, we could see this support break in the next 2-3 sessions as the Euro could weaken while the Yen could strengthen. Below 129.4-129.2 there is crucial horizontal support on weekly line chart near 127 which could then be tested in 2 weeks time.
Pound (1.3099): Pound could be bearish towards 129 (channel support on daily candles in this week). A downtrend below 1.312-1.313 in this week would also make it break the 89 weeks MA, which could be a sign of further bearishness ahead.
Dollar Rupee (68.655): Dollar Rupee could range in the 68.50-69.10 zone in this week. Weakness in Yuan and Euro may impact Rupee strength negatively while a rising Nifty could be the lone source of Rupee strength.
INTEREST RATES
US 2nd Quarter GDP grew 4.1% which mostly met expectations (in some cases, was less than expected). Hence, inspite of being a record growth figure, it couldnt raise US yields much. US PCE growth in the 2nd quarter came in at 1.8% (less than the 2.5% growth in Q1) and might have also contributed to US yields seeing a slight decline.
The FOMC and BoJ meetings this week will be crucial for yields. Last week's surge in global bond yields was primarily due to rumours that the BoJ might be thinking of bringing in some tightening to its loose monetary policy. Any such indication in its policy tomorrow could lead to a further bond selloff, thereby raising US and Japanese yields. Moreover, the FOMC is expected to be hawkish (although a rate hike is not expected in this meet).
Japanese 10 year yield's (0.11%) breach of resistance on short-term chart near 0.09% could sustain if the BoJ indicates any tightening in tomorrow's policy statement.
US 10 year yield (2.96%), 30 Year (3.09%), 5 Year (2.84%), 2 Year (2.67%):
The US 10 year yield's 2.95%-3.00% resistance zone could become weaker if the BoJ tightens its policy this week. If that doesn't happen, we could again see a dip towards 2.90%.
EUR/USD Daily Outlook
Daily Pivots: (S1) 1.1631; (P) 1.1648 (R1) 1.1675; More.....
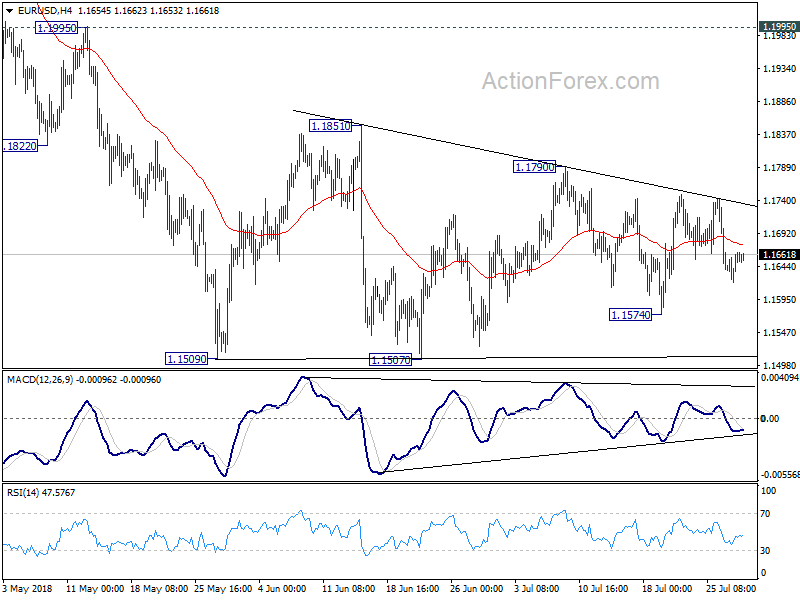
Intraday bias in EUR/USD remains neutral as sideway consolidation from 1.1509 is still in progress. In case of another recovery, upside should be limited by 1.1851 resistance to bring fall resumption eventually. On the downside, decisive break of 1.1507 low will resume larger down trend from 1.2555 through 50% retracement of 1.0339 to 1.2555 at 1.1447.
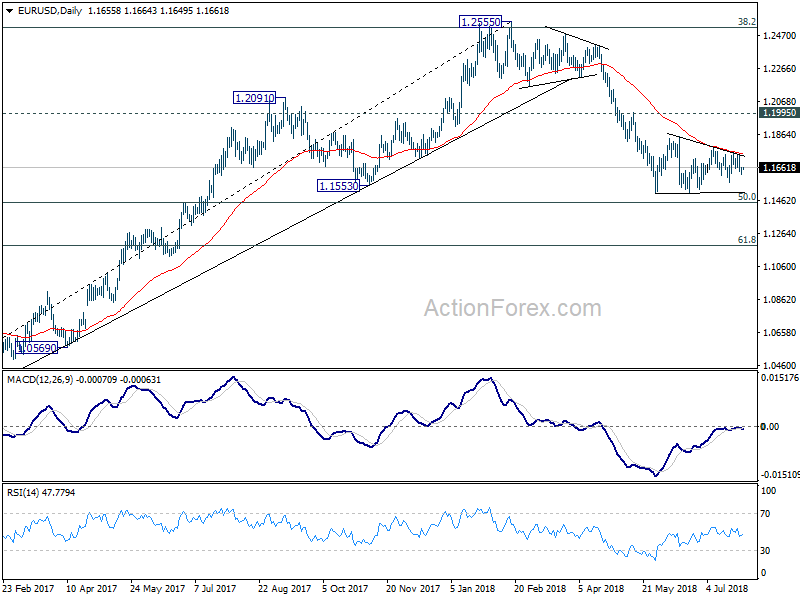
In the bigger picture, EUR/USD was rejected by 38.2% retracement of 1.6039 (2008 high) to 1.0339 (2017 low) at 1.2516. And, a medium term top was formed at 1.2555 already. Decline from there should extend further to 61.8% retracement of 1.0339 to 1.2555 at 1.1186 and below. For now, even in case of rebound, we won't consider the fall from 1.2555 as finished as long as 1.1995 resistance holds.
GBP/USD Daily Outlook
Daily Pivots: (S1) 1.3076; (P) 1.3110; (R1) 1.3139; More...
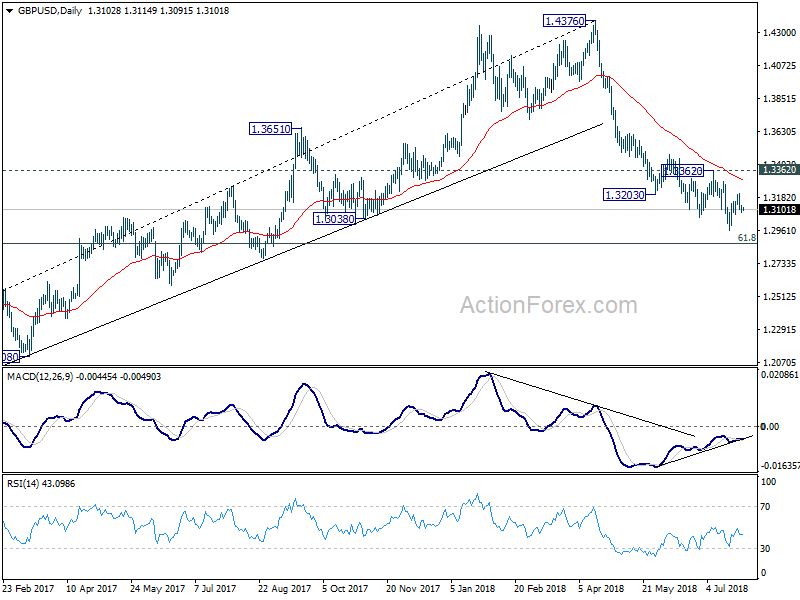
Intraday bias in GBP/USD remains neutral at this point. On the downside, break of 1.3070 minor support will indicate completion of rebound form 1.2956 and turns bias back to the downside for this low. Firm break there will resume larger decline from 1.4376 for 1.2874 fibonacci level next. On the upside, above 1.3212 will bring further recovery. But still, price action from 1.2956 are a corrective pattern. Upside should be limited by 1.3362 resistance to bring larger decline resumption eventually.
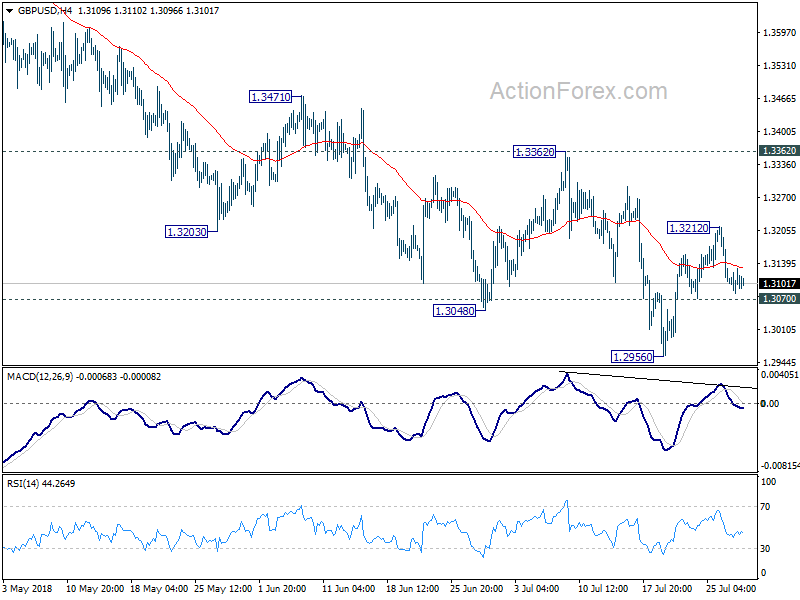
In the bigger picture, whole medium term rebound from 1.1946 (2016 low) should have completed at 1.4376 already, after rejection from 55 month EMA (now at 1.4179). Fall from 1.4376 should extend to 61.8% retracement of 1.1946 (2016 low) to 1.4376 at 1.2874 next. Decisive break of 1.2874 will raise the chance of long term down trend resumption through 1.1946 low. On the upside, break of 1.3362 resistance is needed to be the first indication of medium term bottoming. Otherwise, outlook will remain bearish even in case of strong rebound.