

Sample Category Title
EUR/CHF Weekly Outlook
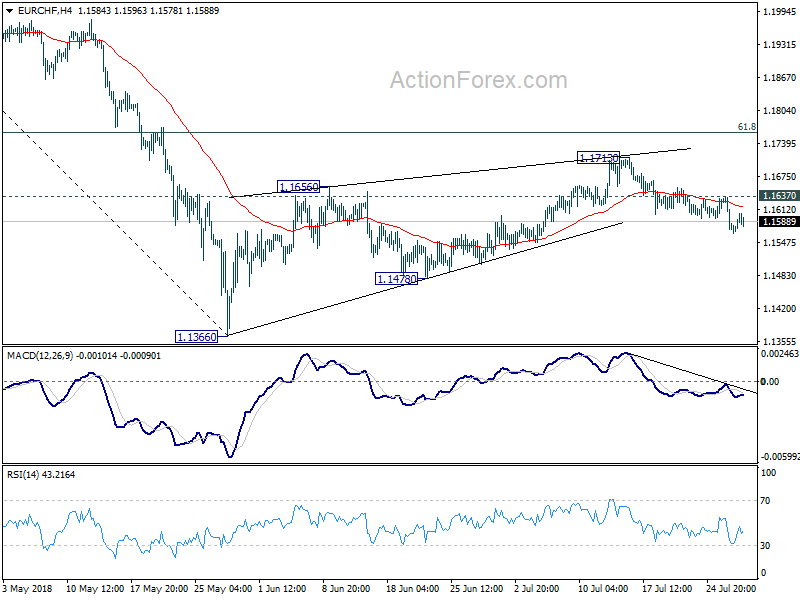
EUR/CHF gyrated lower last week as the decline from 1.1713 extended. Outlook remains unchanged that corrective rebound from 1.1366 should have completed with three waves up to 1.1713 already. Deeper fall is expected this week for 1.1478 support first. Break there will confirm our bearish view and target 1.1366 low and below. Nonetheless, on the upside, above 1.1637 minor resistance will turn bias back to the upside and could extend the rise from 1.1366. But even in that case, we'd expect strong resistance from 61.8% retracement of 1.2004 to 1.1366 at 1.1760 to bring near term reversal.
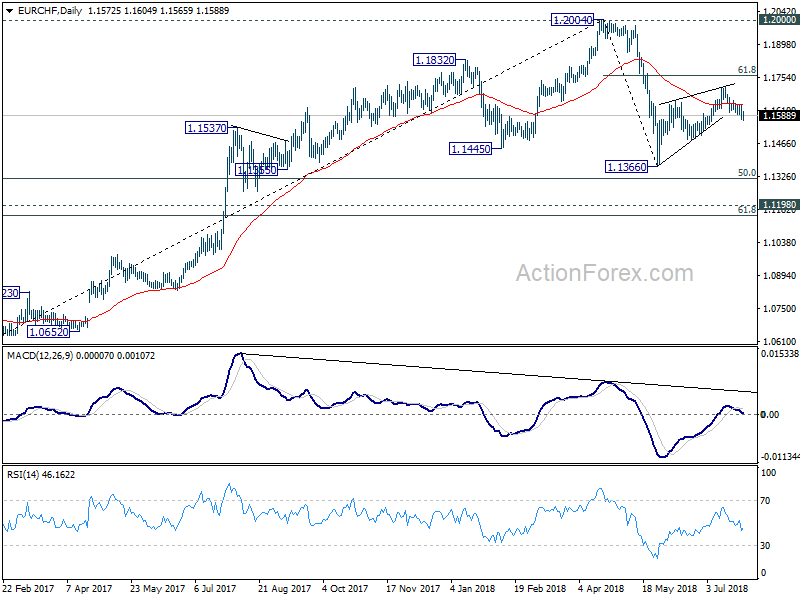
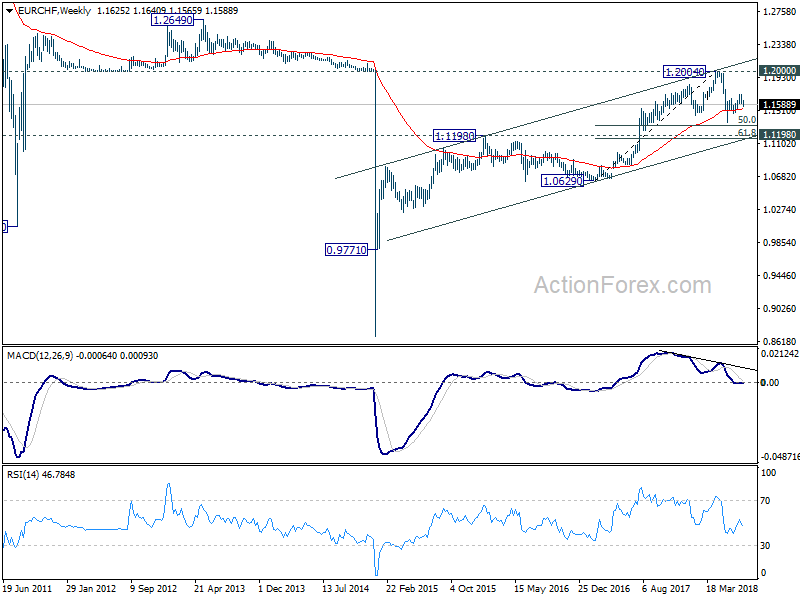
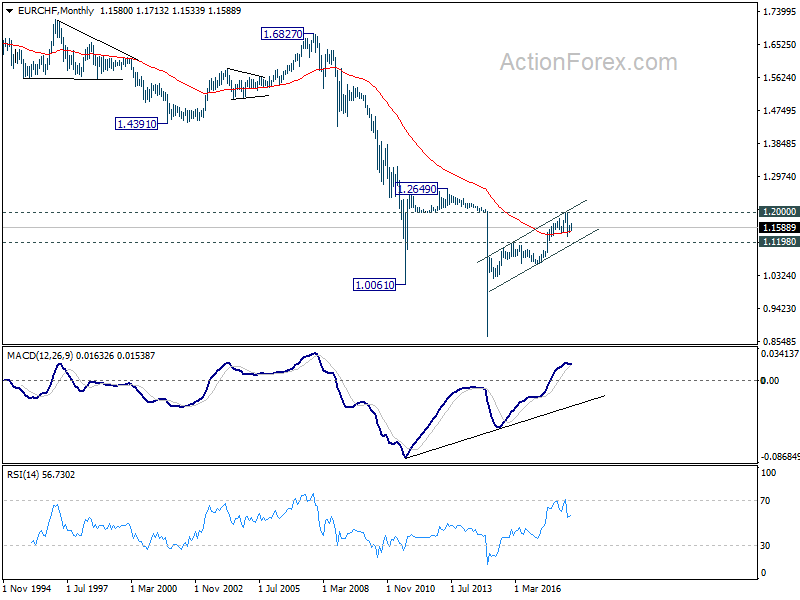
In the bigger picture, 1.2004 is seen as a medium term top with bearish divergence condition in daily and weekly MACD. 1.2000 is also an important resistance level. Hence, the corrective pattern from 1.2004 is expected to extend for a while before completion. We're not anticipating a break of 1.2004 in near term. Another decline cannot be ruled out yet. But in that case, strong support should be seen at 1.1198 (2016 high), 61.8% retracement of 1.0629 to 1.2004 at 1.1154 to contain downside.
CAD, JPY and USD Ended as the Strongest in a Week of Trade Talk and Surging Yields
EU-US trade talk and surge in yields in Japan and the US were the two major themes last week. But it was Canadian Dollar which quietly ended as the strongest one last week. US holding off car tariffs is definitely a positive for Canada and could clear the way for more BoC rate hikes. Meanwhile, news regarding NAFTA were also encourage as the three sides are aiming at having an agreement in principal in August. Yen ended as the second strongest one on surging JGB yield while Dollar ended as the third strongest.
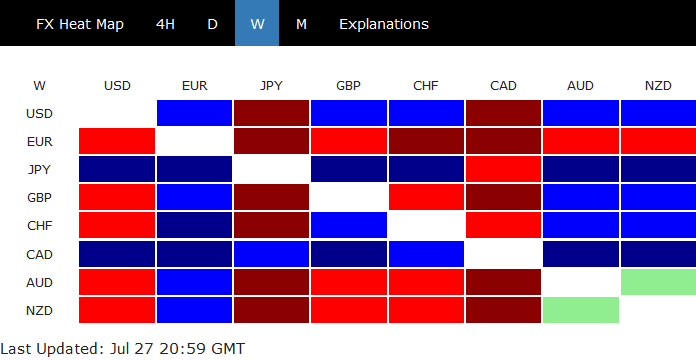
ECB meeting totally met market expectation by being a non-event. While trade tension might be eased, the results out of the EU-US agreements are to be seen. Also, at this stage, there is no material impact on ECB's policy path. The central bank will still keep its hands tight through next summer. Euro, thus, ended as the weakest one. Australian Dollar and New Zealand Dollar tied as the second and third weakest ones as movements elsewhere left them behind.
Euro shrugged, but European stock cheered Juncker's achievement on trade
The visit of European Commission President Jean-Claude Juncker to the US for trade talk with President Donald Trump was one of the two most important theme last week. Out of our expectations, Juncker achieved fruitful results, with a joint statement with Trump. For the short term, Trump made a major concession to cease fire on trade war with the EU. While the national security investigation on auto imports will continue, Trump has agreed to hold off further tariffs as negotiations continue. For the long term, both sides pledged to work towards "zero tariffs, zero non-tariff barriers, and zero subsidies on non-auto industrial goods". That should be positive to growth across the Atlantic ahead.
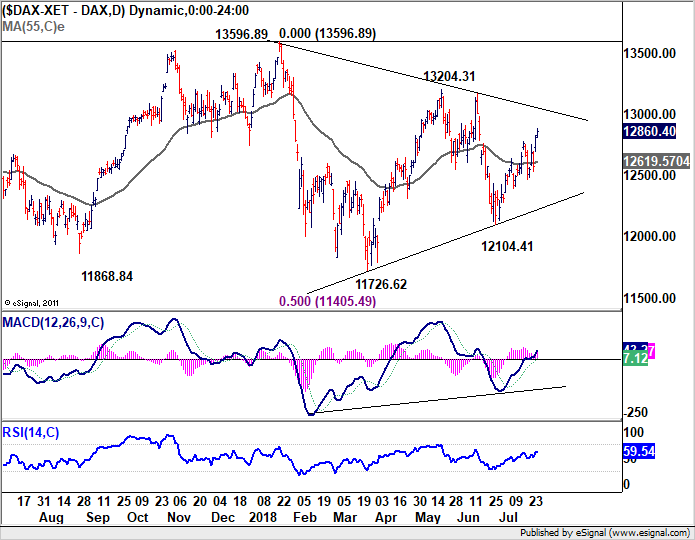
Euro's response to the EU-US trade deal was lukewarm. But it was well received by stock investors. In particular, the threats of auto tariffs to German car makers are, at least temporarily, eased. DAX closed the week up 2.38% or 298.98 pts at 12860.40. Technically, rebound from 12104.41 is in progress, with near term bias on the upside for 13000 handle. The real test for it is in the resistance zone between 13000/13204.31. For now, DAX is seen as bounded in consolidative trading in converging range. Break of 55 day EMA (now at 12619.57), will start another falling leg towards 12104.41 support. DAX could only breakout after there is sign of completing the negotiation with the US.
French President Emmanuel Macron was a rare high profile politician that questioned the EU-US trade deal. Just immediately after the announcement of the trade deal, Macron openly warned that he would not made any concession on agriculture with the US. He insisted that standards on food safety and environment must not be abandoned in talks. And he raised it to the level of "principle at the heart of the European sovereignty I am calling for." Later, Macron also said he opposed to negotiations for a comprehensive trade agreement with the US unless the issue of steel and aluminum tariffs is resolved. He said that "I have said from the beginning a good business discussion can only be held on the basis of equality, reciprocity and under no circumstances on threats". And, "I am not in favour of launching into a negotiation of a vast trade accord like TTIP because the context doesn't allow it."
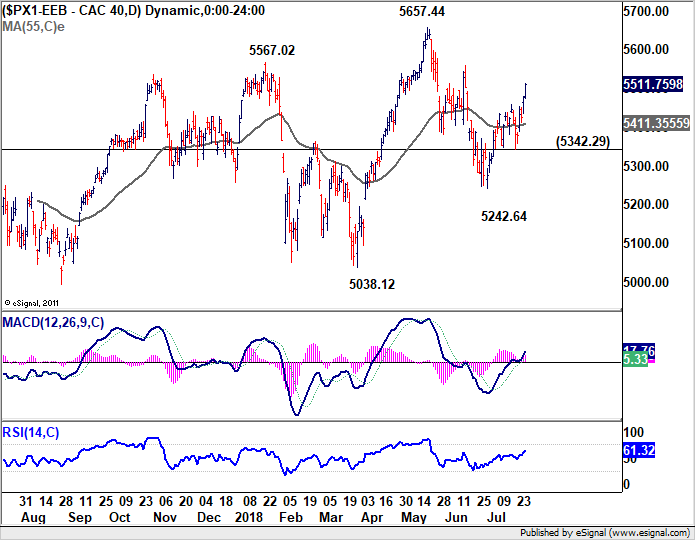
French investors, nevertheless, couldn't care less about Macron's comments. CAC 40 surged 2.10% or 113.44 pts to closed strongly at 5511.76. Near term outlook in CAC is now staying bullish as long as 5342.29 support holds. Rebound from 5242.64 is set to have a test on 5657.44 high. Break will resume the medium term up trend.
EU-US joining forces against China, SSE rebound lost momentum
Meanwhile, the EU-US trade deal is clearly a bad news for China. In the statement, both sides agreed to join forces against "unfair global trade practices". And specifically, the practices include "intellectual property theft, forced technology transfer, industrial subsidies, distortions created by state owned enterprises, and overcapacity." That's exactly talking about China. Now with the support from EU, it's getting even less likely for Trump to go back to negotiation table with China, unless the latter makes some tangible and sizeable concession. We'll more likely see the tension escalates on this side than not ahead.
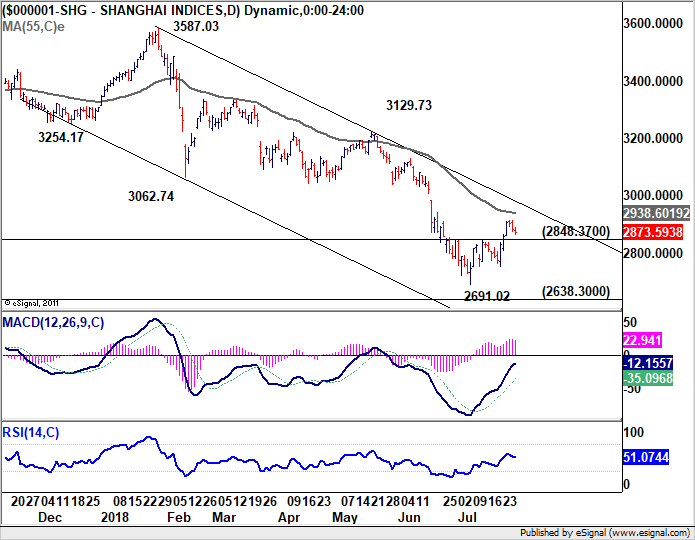
While the China Shanghai SSE extended the rebound from 2691.02 last week, it started to lose momentum after hitting 2915.29. For the near term, further rise is expected as long as 2848.37 resistance turned support holds. But first hurdle is at 55 day EMA (now at 2938.60). Second hurdle is at channel resistance at 2981. Third hurdle is at 3000 psychological level. The rebound is unlikely to last long.
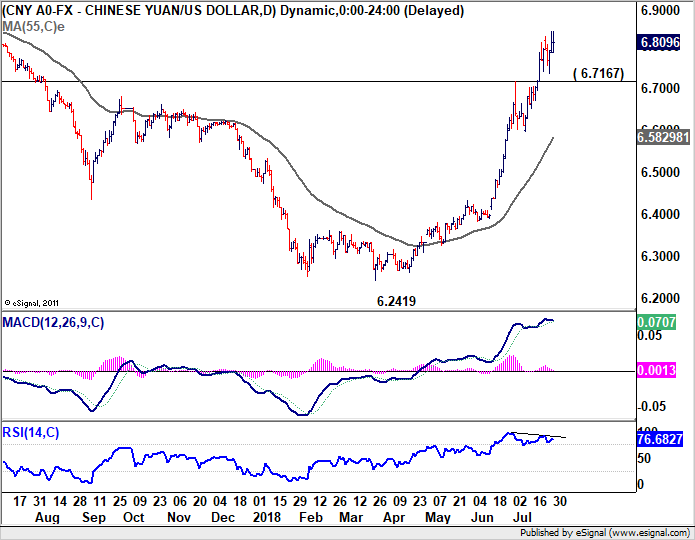
While the Chinese Yuan extended decline last week, momentum is seen diminishing. We'd like to emphasize again that for now, USD/CNY (on shore Yuan) at 6.8 is seen as a red line for government intervention, at least by the market participants in Asia. And it's a line that traders would hesitate to test. On the other hand, would the Chinese government want depreciation in the Yuan to offset the impact of US tariffs? Our view is, managed depreciation? Maybe. Free fall? Definitely not.
A free fall in the Yuan will inevitably trigger a collapse in the stock markets. Trade war and tariffs are only long term pain which could be eased by various measures. Stock market crash will be an immediate pain that could trigger social unrest. For the Chinese authoritarian government, the biggest threats are always from within. Anyway, technically, 6.7167 is a key near term support in USD/CNY and break will bring pull back to 55 day EMA (now at 6.5829) and below.
Yield surged at the long end, in Japan and US
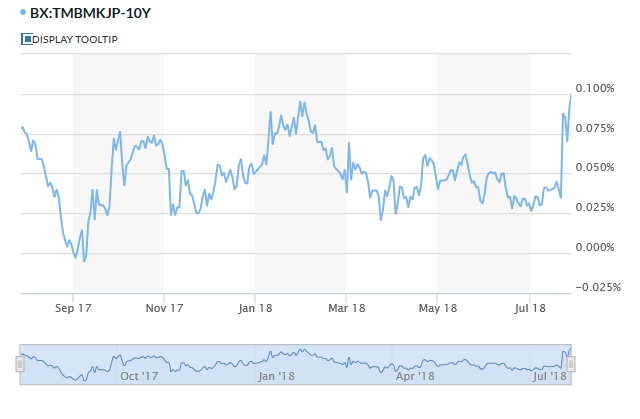
The second biggest development last week was the surge in Japanese yield. It's started by rumors that BoJ is considering to tweak the policy under the yield curve control framework. Under YCC, it's targeting 10 year JGB yield at 0%. And BoJ could lift the target to 0.1%. 10 year JGB yield closed the week up 0.065% at 0.10%. That came after hitting as high as 0.113, highest in more than a year. That's the primary reason in driving the Japanese Yen higher as the second strongest one last week.
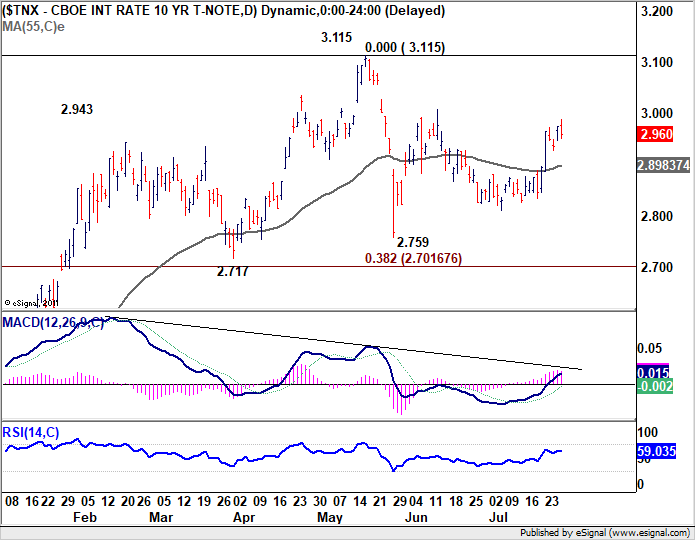
It's unsure which one started it all, US yield or Japanese yield, or it's just a parallel development in coincidence. US 10 year yield (TNX) hit as high as 2.988 before closing at 2.960. Despite solid Q2 GDP report, TNX seemed to find it difficult to break through 3.0 handle. Though, for the near term, further rise is expected as long as last week's low at 2.928 holds. Current rebound is still in favor to extend to retest 3.115 high.
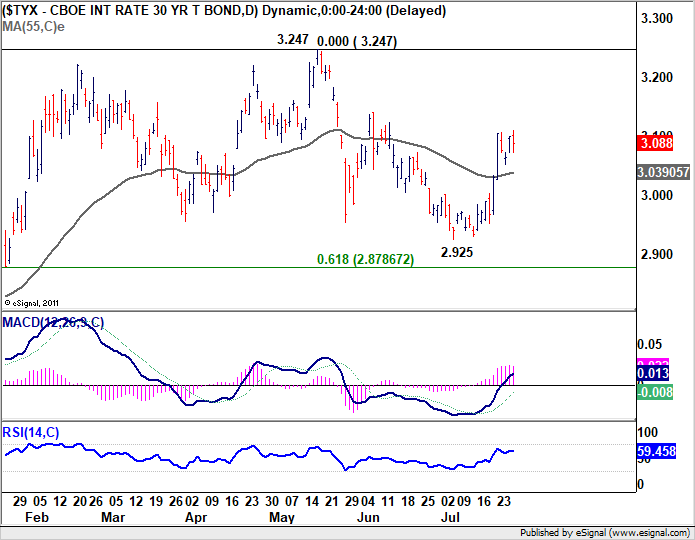
Similarly, 30 year yield (TYX) also lost momentum after hitting 3.110. Further rise will remain in favor as long as 3.053 support (last week's low) holds. Current rebound from 2.925 could extend to retest 3.247 high.
Dollar index extending the consolidation from 96.56
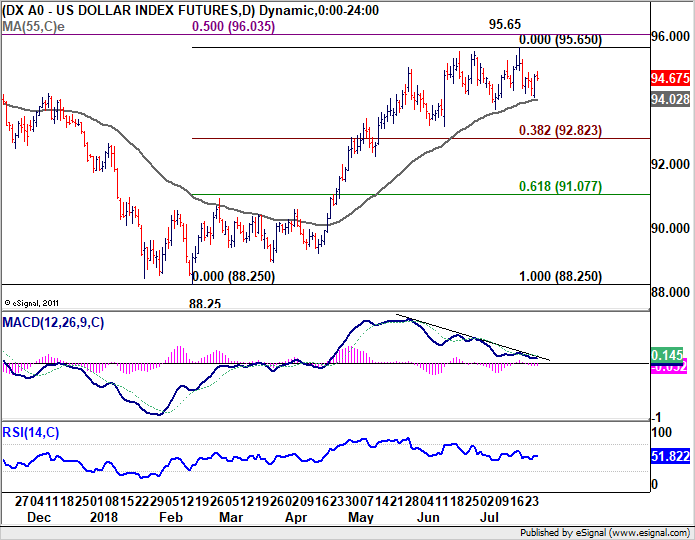
While Dollar ended as the third strongest one last week, it's merely a rebound inside recent near term consolidation. This could clearly be reflected in dollar index too. DXY is staying in the consolidation from 95.65 and more sideway trading would be seen, with risk of deeper pull back. But still, we're expecting strong support from 38.2% retracement of 88.25 to 95.65 at 92.82 to contain downside and bring rebound. Rise from 88.25 is expected to resume at a later stage
Such a busy week ahead with BoJ, FOMC, BoE, NFP and more
Looking ahead, there are more than enough events to keep traders busy.
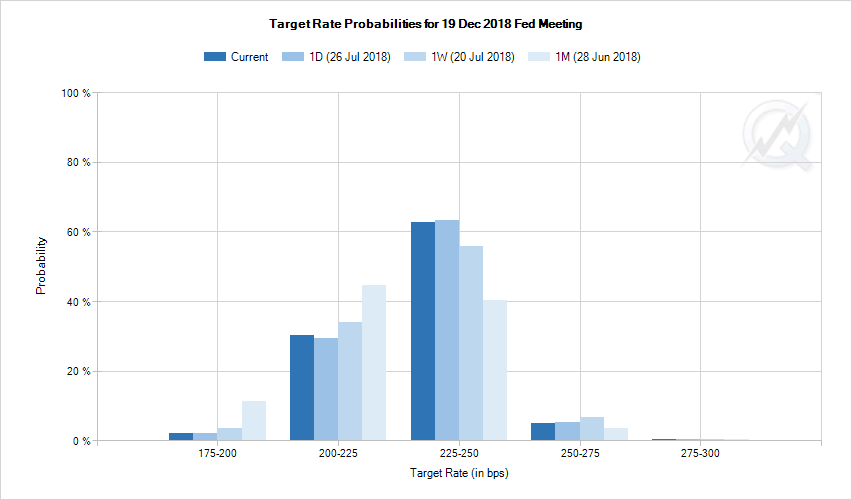
Fed is widely expected to keep federal funds rates unchanged at 1.75-2.00%. The central bank is on course for two more rate hikes this year. Fed fund futures' pricing also firmed up. For December meeting, they're pricing in more than 72% chance of a second hike to 2.25-2.50%. It's up from 57.2% a week ago and 43.9% a month ago. There will be other heavy weight events including ISM manufacturing and services, as well as non-farm payroll.
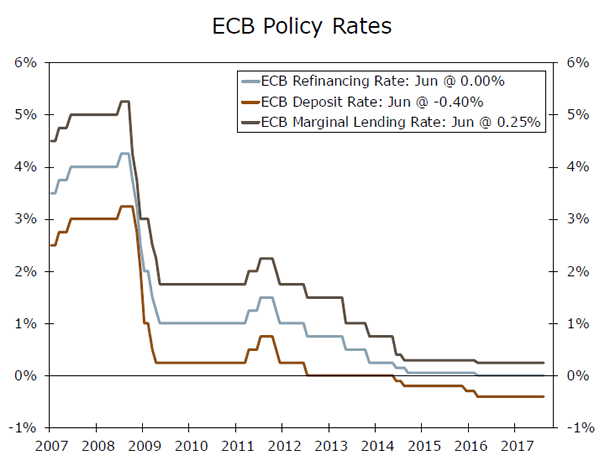
Eurozone will release Q2 GDP but the larger focus would be on whether CPI will stay at 2.0% in July, and whether core CPI will pick up. Nonetheless, ECB is clear with it policy path. Last week's meeting revealed nothing new as it will keep rates unchanged through the summer of 2019. There was no clarification of the meeting of "summer". A month of two or data is not going to have any impact on ECB's forward guidance.
BoE is widely expected to raise interest rate by 25bps to 0.75%. It's unlikely for the central bank to disappoint given such high expectations. The focus will be on the new voting as well as the new inflation report. UK will also release a fresh set of PMI data. The momentum in Q3 will be the crucial factor in determining when BoE would hike again.
BoJ meeting is highlight anticipated, yet it could disappoint most. It's clear that the discussion regarding tweaking the monetary policy is at a preliminary stage. There is little chance for BoJ to make any drastic announcement. Though, most meeting reactions in Yen and JGB yield should be closely watched.
China's economic data has been relatively resilient so far despite the threat of trade war. IMF also retained is projection of 6.6% growth in China this year, in its latest report. But the PMI data to be released this week will shed some lights on how confidence is affected by the rising trade tension with the US.
Down under, Australia trade balance and retail sales, New Zealand employment are also important.
Position trading - GBP/CHF short stopped at breakeven, to resell of break of 1.2971
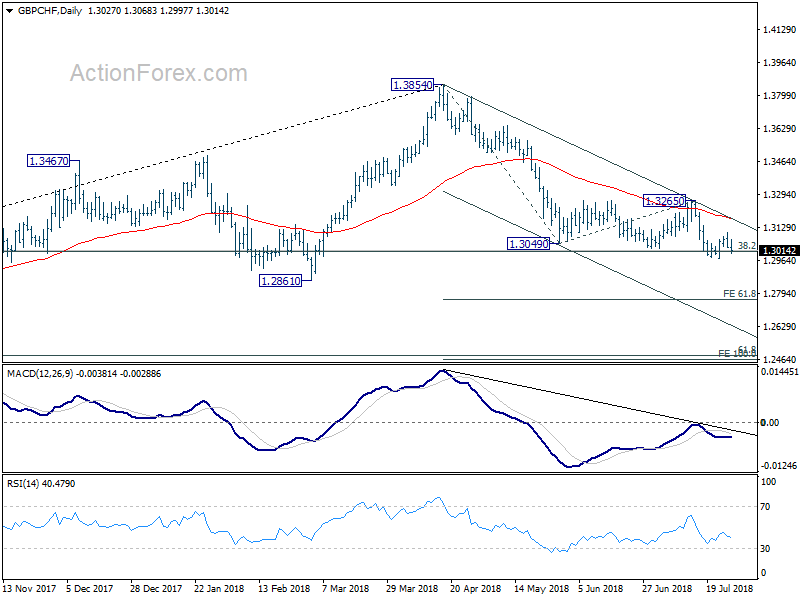
Our GBP/CHF short position (sold at 1.3060) was stopped out breakeven last week as the cross recovered to as high as 1.3102. Near term outlook in the cross remains bearish even though there is much hesitation in breaking through 38.2% retracement of 1.1638 to 1.3854 at 1.3007. We'll look at selling the cross again on break of 1.2971 (last week's low). We're expecting the fall from 1.3854 to extend to 61.8% projection of 1.3854 to 1.3049 from 1.3265 at 1.2768 as first target. And there is prospect of extending to 100% projection at 1.2460 in medium term.
USD/CAD Weekly Outlook
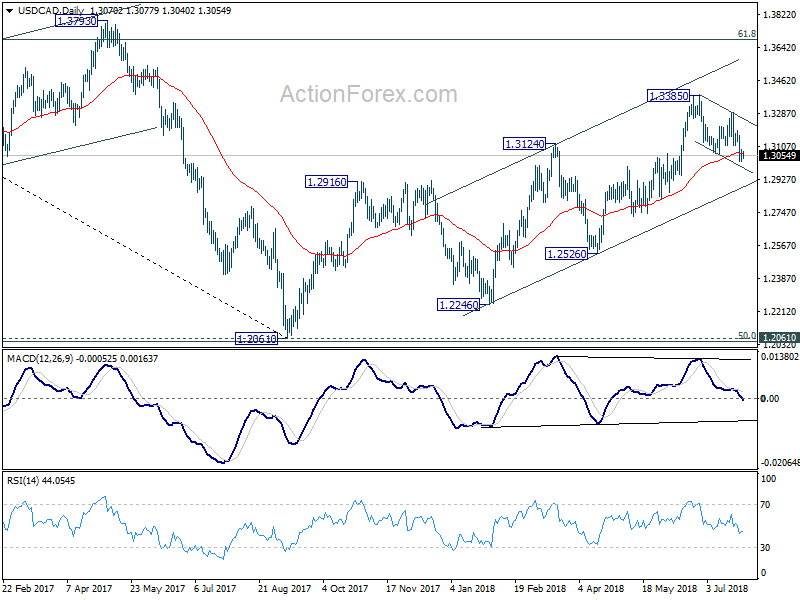
USD/CAD's corrective fall from 1.3385 resumed last week and hit as low as 1.3023 before forming a temporary low there. Initial bias is neutral this week first, for some sideway trading. With 1.3114 minor resistance intact, deeper decline is still expected. Break of 1.3023 will target 100% projection of 1.3385 to 1.3063 from 1.3289 at 1.2967 and possibly below. But still, we'd expect strong support from rising channel line (now at 1.2890) to contain downside and bring rebound. On the upside, above 1.3114 is the first sign of bottoming and will turn bias back to the upside for 1.3289 resistance. Overall, the larger rally from 1.2061 is expected to resume later.
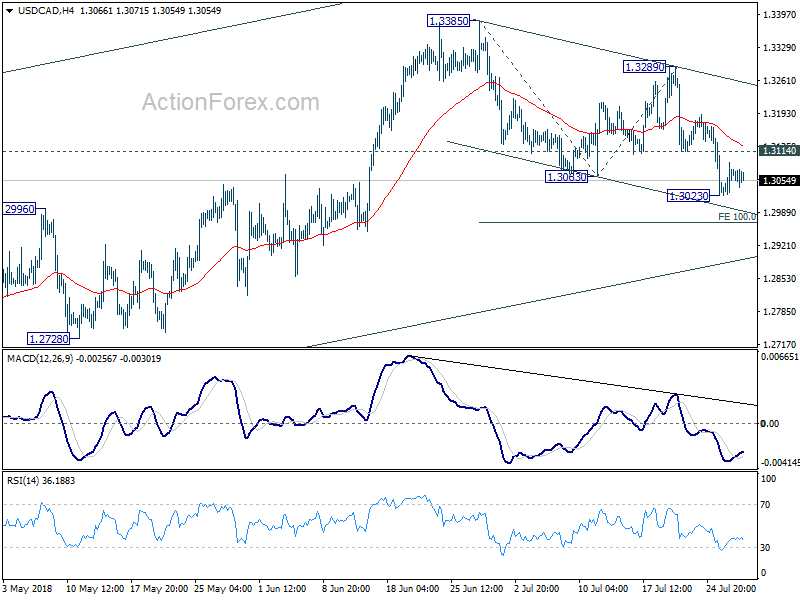
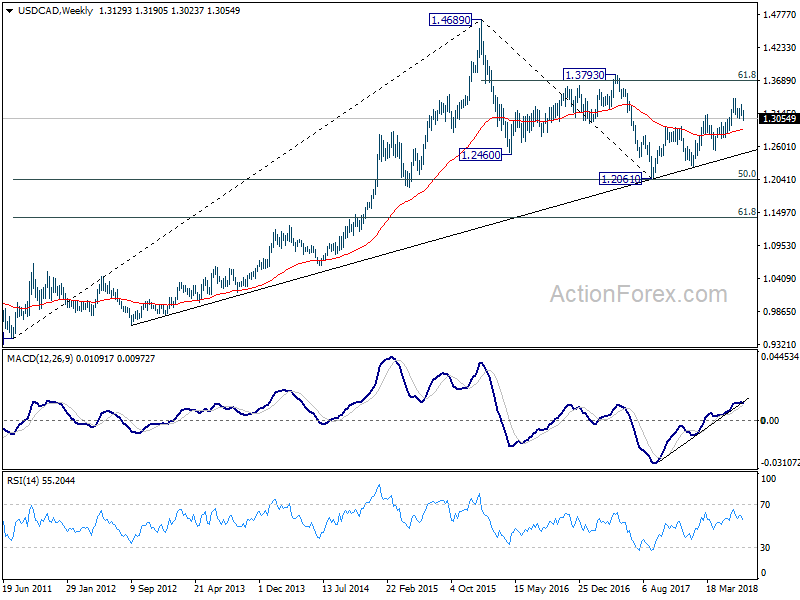
In the bigger picture, as long as channel support (now at 1.12890) holds, we're holding to the bullish view. That is, fall from 1.4689 (2015 high) has completed at 1.2061, ahead of 50% retracement of 0.9406 (2011 low) to 1.4689 (2015 high) at 1.2048. Further rally should be seen for 61.8% retracement of 1.4689 to 1.2061 at 1.3685 and above. However, sustained break of the channel support will argue that rise from 1.2061 has completed and will bring deeper fall to 1.2526 support to confirm.
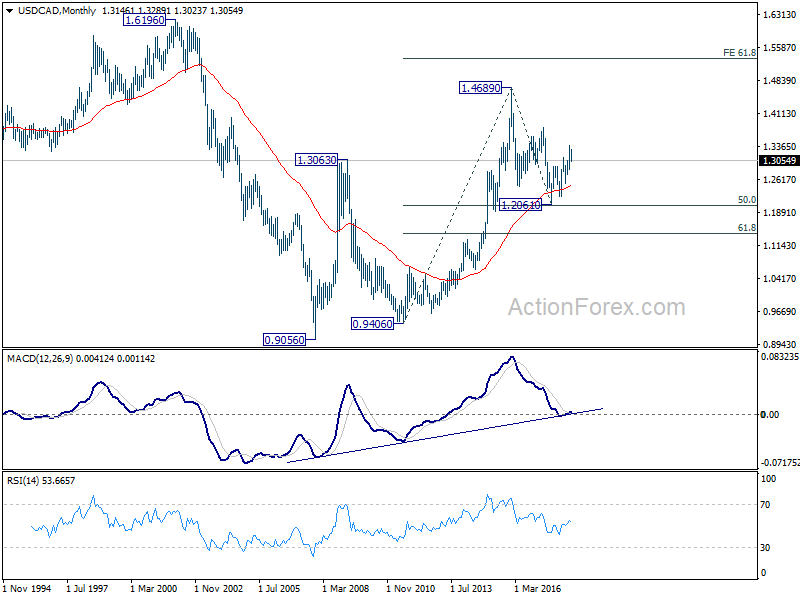
In the longer term picture, corrective fall from 1.4689 (2015 high) should have completed with three waves down to 1.2061, just ahead of 50% retracement of 0.9406 (2011 low) to 1.4689 (2015 high) at 1.2048. The development keeps long term up trend from 0.9406) and that from 0.9056 (2007 low) intact. It's early to tell, but there is now prospect of extending the long term up trend to 61.8% projection of 0.9406 to 1.4689 from 1.2061 at 1.5326 in medium to long term.
Summary 7/30 – 8/3
Monday, Jul 30, 2018
[php_everywhere instance="1"]
Tuesday, Jul 31, 2018
[php_everywhere instance="2"]
Wednesday, Aug 1 2018
[php_everywhere instance="3"]
Thursday, Aug 2, 2018
[php_everywhere instance="4"]
Friday, Aug 3, 2018
[php_everywhere instance="5"]
South Korea as Yardstick for Measuring Trade Tension
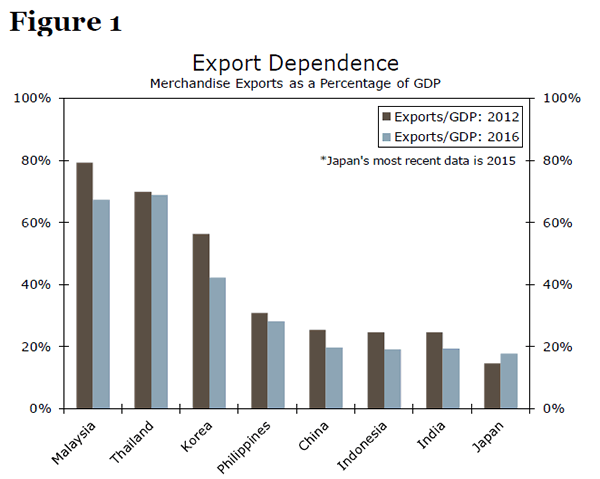
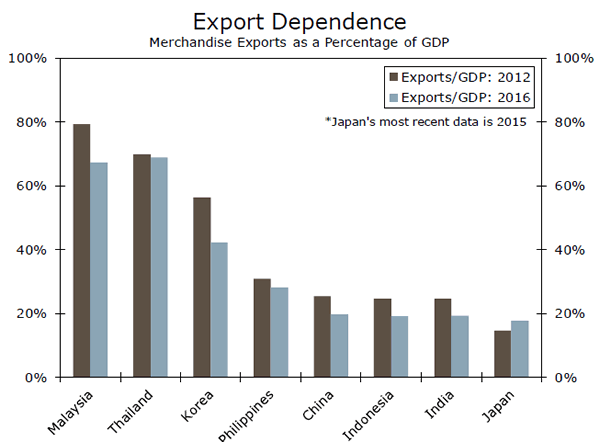
After a mixed second quarter GDP report in South Korea, that nation's central bank has to weigh rising pressure to normalize monetary policy against its vulnerability to global trade. In the early days of the coal industry, miners would bring a caged canary into the mine with them because, if the air were contaminated by methane or carbon monoxide, the bird would fall ill or die before levels became dangerous to the miners themselves. As worries mount about an incipient trade war, countries that are particularly reliant on exports can offer clues about the prospect for how trade is weighing on economic growth. One example of such a country is South Korea, where trade tensions are a major source of uncertainty as total exports as a share of GDP are more than 40 percent (Figure 1).
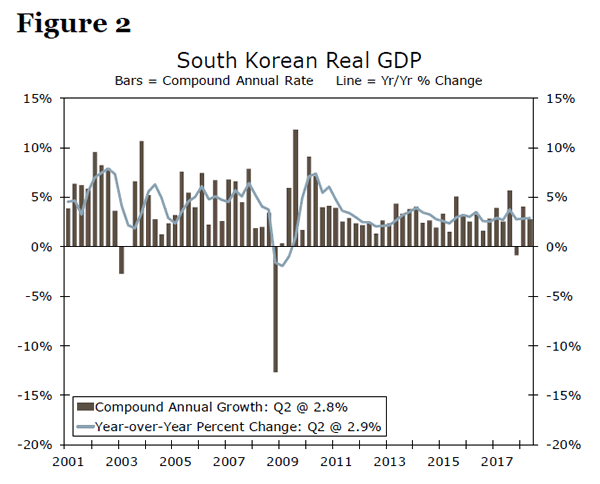
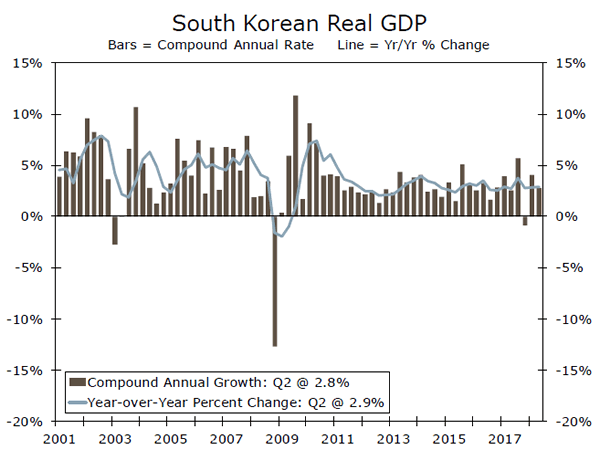
South Korea's economy grew at an annualized rate of 2.8 percent in the second quarter (Figure 2), which was a bit slower than the growth rate in the prior quarter. Despite slowing on a sequential basis, the year-over-year rate picked up slightly to 2.9 percent, and perhaps more to the point, net exports offered a bigger boost to the headline growth rate than any other category.
Before we declare the world safe from the perils of a slowdown in trade, it bears noting that the boost from net exports actually has more to do with slowing imports (down 10.0 percent at an annualized rate) than a surge in exports (which actually slowed substantially from the prior period and only grew at a 3.2 percent clip). For another data point, consider Singapore, an even more export-reliant economy, where growth slowed in the second quarter as well.
Other Areas of Growth and Outlook for Bank of Korea
Business investment slowed in South Korea in the second quarter after a strong Q1, but other than that all major categories were in expansion mode during the period. Consumer spending advanced at 1.7 percent annualized rate and inventories increased a bit more than they did in the first quarter, resulting in a slight boost to headline growth.
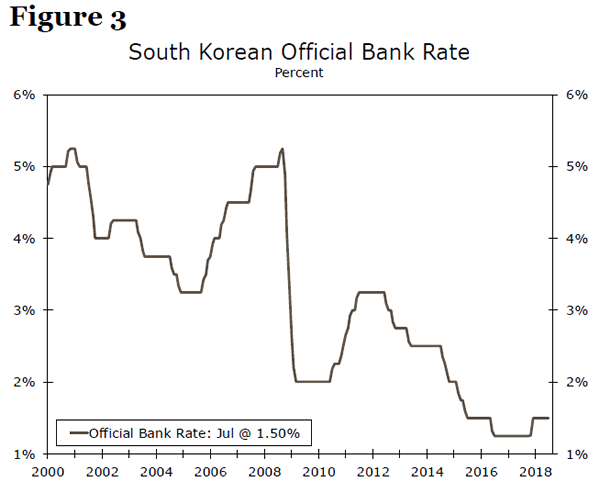
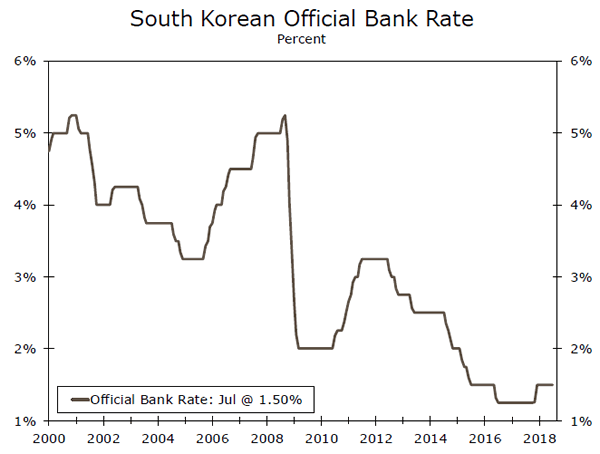
At its most recent policy meeting in July, the Bank of Korea (BoK) held its policy rate steady (Figure 3) and downgraded its 2018 growth projection to 2.9 percent from 3.0 percent previously, citing corporate earnings and trade tensions as causes for the adjustment. Our own forecast for full year 2018 GDP growth in Korea is 2.7 percent.
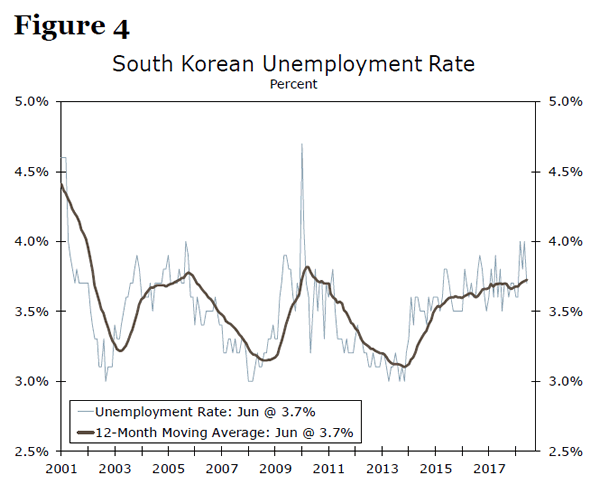
With inflation in check and unemployment still somewhat high for structural reasons (Figure 4), economic conditions are not yet completely supportive of less policy accommodation. But that did not prevent one policymaker from dissenting at the July meeting, an indication that there is at least some pressure to hike rates as many other central banks are on a path toward normalization.
Although our baseline expectation is that the BoK will not raise rates at its next meeting on August 31, there is a case to be made that a hike is in the offing. The sole dissent in July came from Lee Il-houng, who as it happens was a sole dissent in October of last year (also favoring a hike), before the BoK went ahead with a 25 basis point hike the following month. In our view, the worries about global trade offset the less-than-compelling case to raise rates. Should those tensions abate, the odds of a hike go up.
BoJ Unlikely to Deliver Fireworks for Now, Yen Bulls at Risk
The Bank of Japan (BoJ) will announce its monetary policy decision during the Asian trading session on Tuesday. The yen has gained lately on speculation the Bank may alter its policy in a more hawkish direction. That said, the BoJ still seems somewhat unlikely to adjust its policy for now, with core inflation remaining miles away from its target. This renders the yen vulnerable to a downside correction should Kuroda & Co disappoint those looking for a hawkish twist.
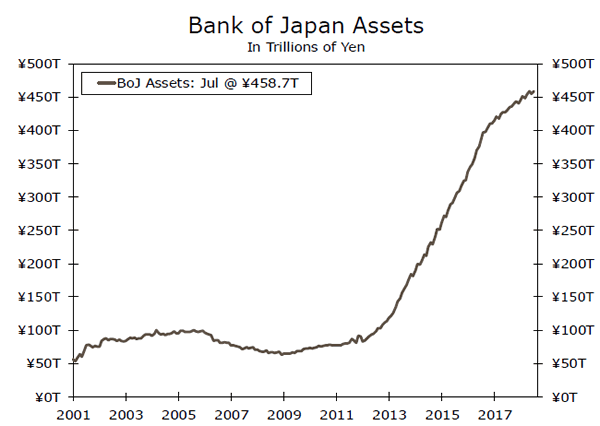
Back in September 2016, the BoJ introduced its so-called “QQE with yield curve control” framework. Under this regime, the Bank has committed to keeping the yield on longer-dated Japanese Government Bonds (JGB) fixed “around 0%”. In essence, the Bank has pledged to keep long-term interest rates very low in an effort to stimulate borrowing and investment. Every time that yields on 10-year JGBs have attempted to cross above the 0.10% mark, the BoJ steps into the market, buying as many bonds as needed to push yields back down.
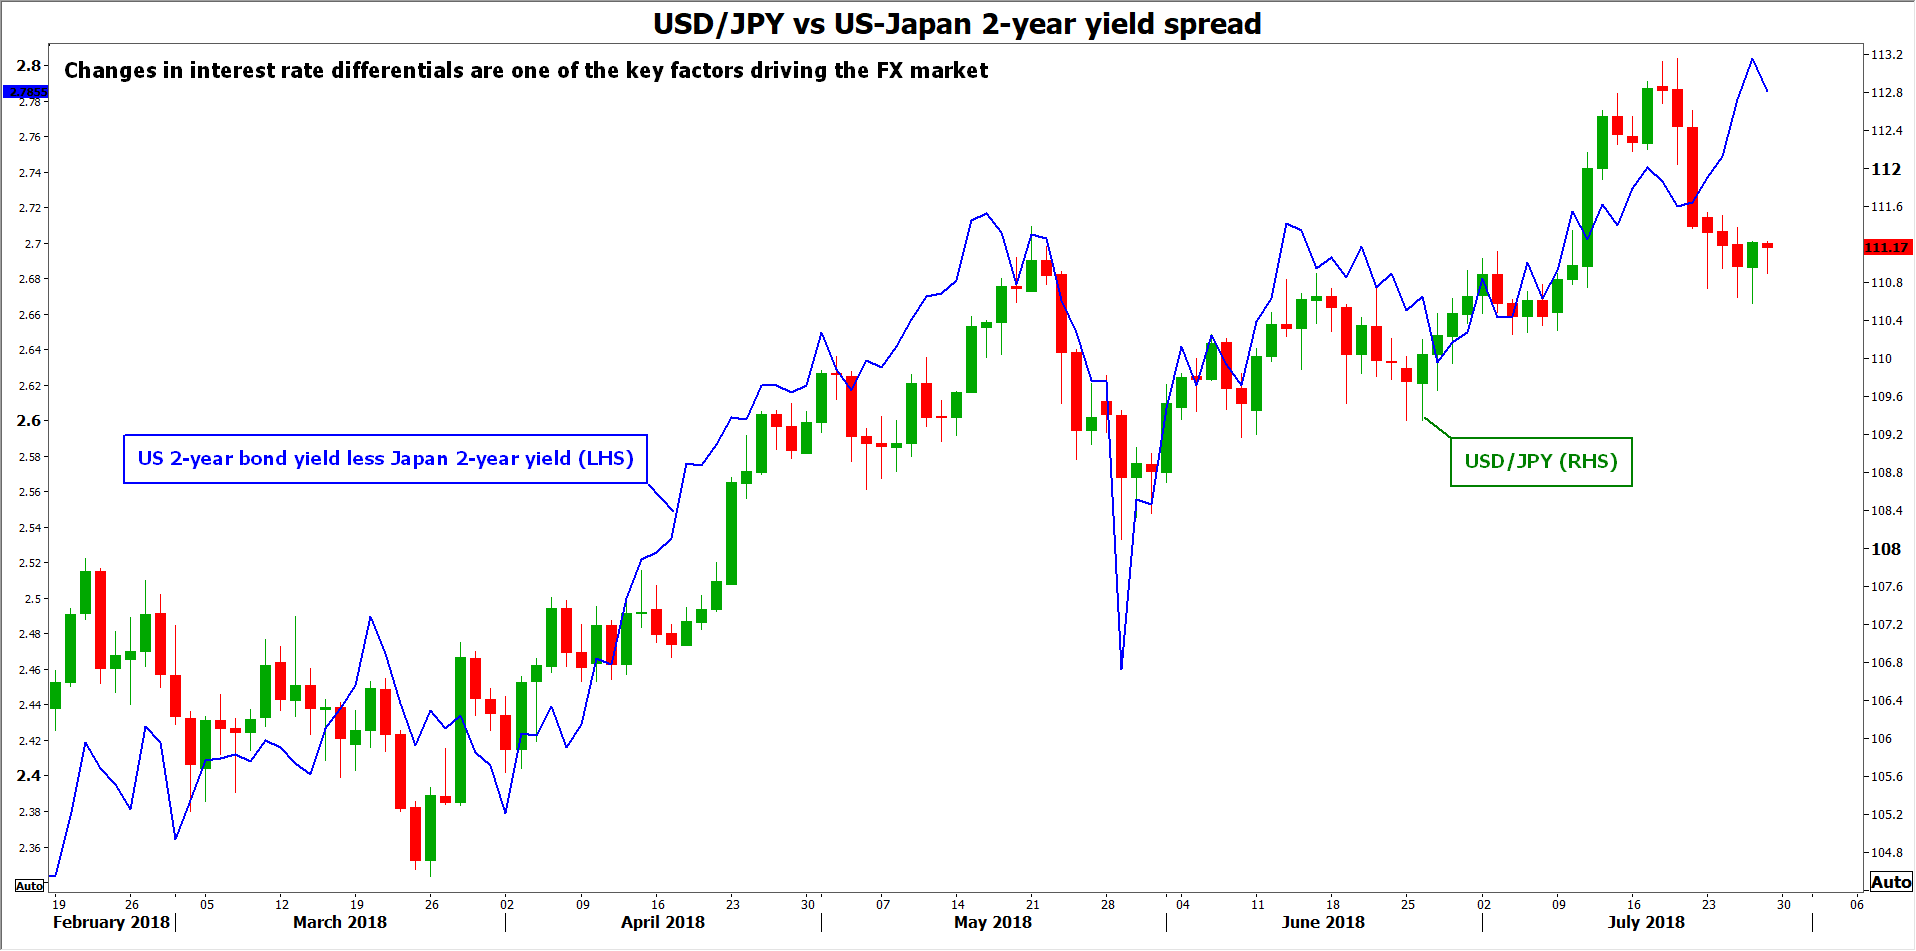
This is an extreme form of easing, which indirectly has helped to keep the yen weak against other currencies. Since the BoJ is keeping Japanese yields fixed around 0% while other central banks like the Fed are raising rates, interest rate differentials are widening between Japan and the rest of the world, which renders the yen less attractive relative to currencies like the dollar from a rates perspective.
Turning to next week’s meeting, recent media reports suggest the BoJ may tweak its ultra-loose framework in a more hawkish direction, perhaps by raising the implicit yield target “ceiling” a little. Although this would only be a baby step in the grand scheme of things, it would still likely be perceived as a harbinger of things to come, laying the groundwork for more similar steps in the future.
The key question is whether the BoJ will pull the trigger on such a change at this meeting. Markets certainly seem to have positioned for some hawkish twist, evident by the latest spike higher both in Japanese bond yields and the yen. Yet, one would be forgiven to remain skeptical. While it’s true that the Bank has reasons to adjust its policy – most notably to ease the pain on commercial banks whose profitability has taken a hit in this environment – the current economic landscape makes any hawkish change difficult to justify.
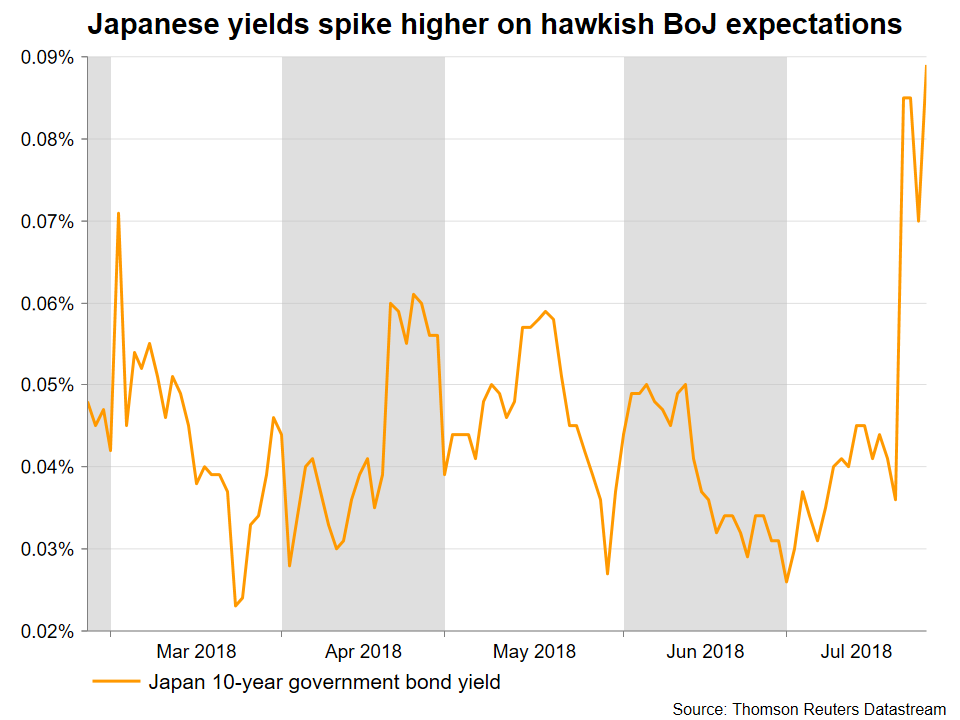
Inflationary pressures are still muted. The nation’s headline CPI rate has remained stuck below 1.0%, while the measure that excludes fresh food and energy items is currently at a mere 0.2% in yearly terms. Many suggest the Bank may even downgrade its inflation forecasts at this gathering, indirectly admitting it will probably take longer to hit its 2% inflation target. Yes, wages are showing some signs of life, but they are still far from healthy levels. Meanwhile, the economy contracted in Q1, and consumers appear unwilling to spend, with household spending falling by 3.9% y/y in May. On top of everything, the outlook for exports remains clouded amid ongoing trade tensions.
Not to mention that any move could trigger an outsized surge in the yen on expectations for further normalization, much like the euro’s rally in 2017, when speculation for ECB normalization surfaced. A stronger currency lowers the price of imported products and hence, weighs down on inflation – something the BoJ will surely be keen to avoid. It would also make Japanese exports abroad less competitive.
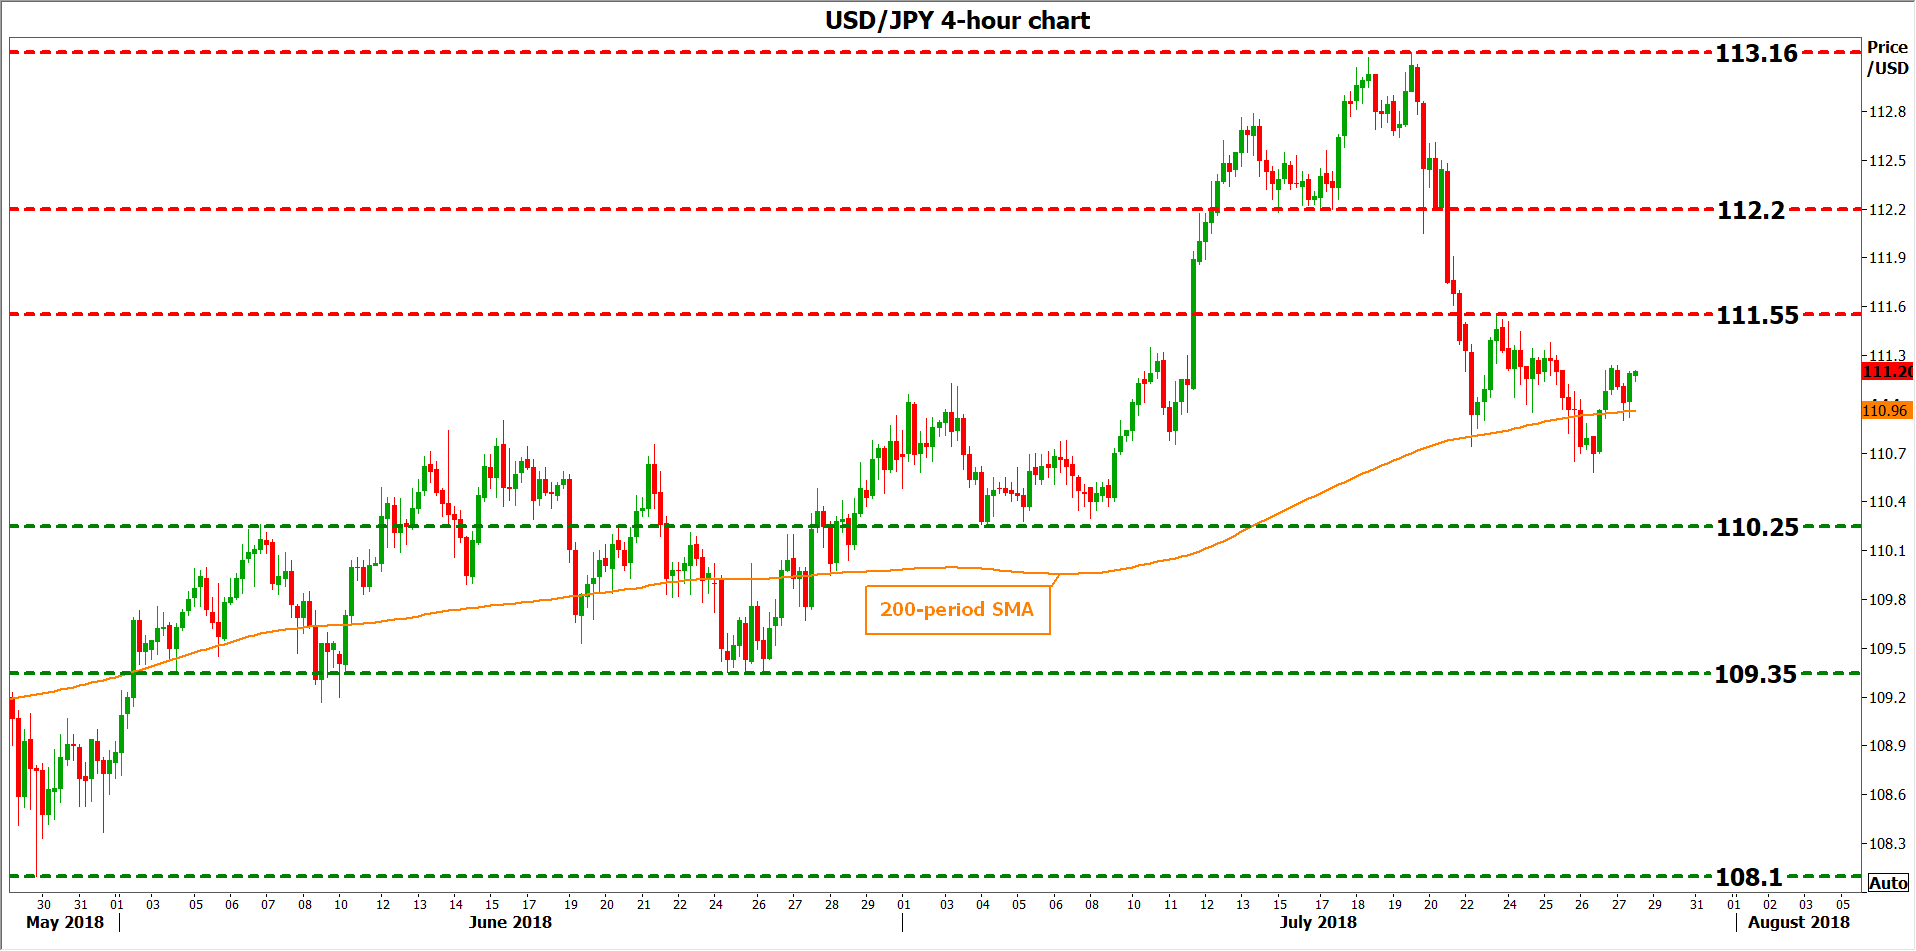
All in all, there seems to be little reason for the BoJ to rush into anything, for now. The economy is decent, but not strong, and taking a hawkish step whilst simultaneously lowering inflation forecasts would be almost unprecedented. Should the Bank disappoint those looking for an immediate move, the yen is likely to tumble as Japanese yields come back down. Taking a technical look at dollar/yen, advances could encounter immediate resistance near the 111.55 barrier, marked by the July 23 top. An upside break could open the way for 112.20, the inside swing low of July 16. Higher still, the seven-month high of 113.16 could come into play.
On the downside – and in case the Bank does raise its yield target – preliminary support to declines may come around 110.25, defined by the trough of July 4. A downside break could see scope for declines towards 109.35, this being the June 25 low, before the 108.10 territory comes into view, defined by the trough of May 29.
Weekly Economic and Financial Commentary: Growth Unshackled
U.S. Review
Upward and Onward
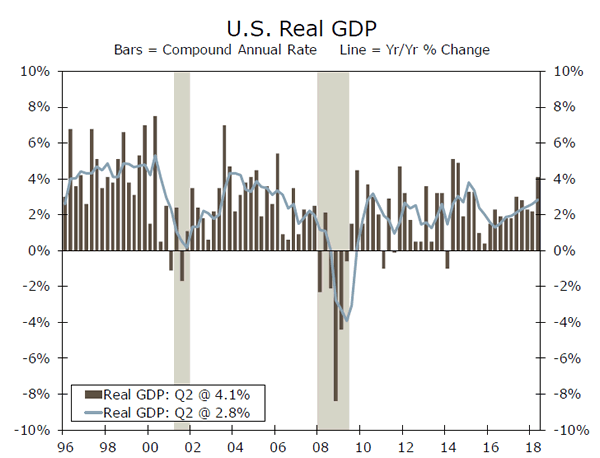
- Real GDP grew at a solid 4.1 percent pace during the second quarter and growth for the prior year was revised modestly higher. Real GDP is up 2.8 percent over the past year.
- The inflation data released with the GDP data show the GDP deflator rising at a 3.0 percent pace in the second quarter and climbing 2.4 percent over the past year.
- Durable goods orders came in slightly below expectations, as defense orders fell following two very strong months. Orders for commercial aircraft rose, however, and nondefense capital goods orders ended the second quarter on a strong note.
Growth Unshackled
Real GDP grew at a 4.1 percent pace during the second quarter and first quarter growth was also slightly stronger than first reported. The stronger GDP figures do not come as much of a surprise. The consensus forecast had been around 4 percent for the past few weeks and our forecast was an even higher 4.7 percent.
This past quarter's GDP data were even more difficult to predict than usual. The second quarter data include benchmark revisions, which incorporate new methodologies and data sources. The base year was also moved from 2009 to 2012. The net result was fairly tame, however. Real GDP growth has averaged a 2.3 percent pace from the end of 2012 to the first quarter of 2018, the same as had been reported previously. The mix of growth was a little better, with business fixed investment rising at a slightly faster pace and consumer spending growing slightly less. The trade deficit, however, looks a little worse.
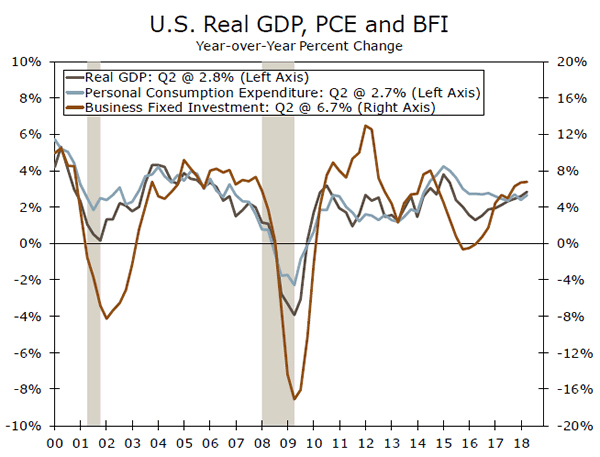
The critical question following the stronger second quarter figures is how sustainable is the improvement. While we doubt we will see another 4 percent quarterly gain in real GDP growth anytime soon, the economy is no longer shackled by a late-1980s' tax system and burdensome regulations. The net result is an investment-led expansion. Real business fixed investment rose at a 9.4 percent annual rate during the first half of the year, while consumer spending grew at just a 2.2 percent pace. The strength in business fixed investment should provide the economy more resilience, by boosting productivity growth, reducing inflationary pressures and increasing the economy's long-run potential growth rate.
The GDP deflator rose at a 3.0 percent pace during the second quarter and is up 2.4 percent year to year. Nominal GDP grew at a 7.4 percent pace and is up 5.4 percent over the past year. Real GDP measures the volume of goods and services produced in the economy, while nominal GDP measures the revenues generated across the economy. The strength in top line revenues is a big reason why private sector job growth has ramped up as much as it has in recent months and why it will likely continue to run at or above the high side of expectations going forward.
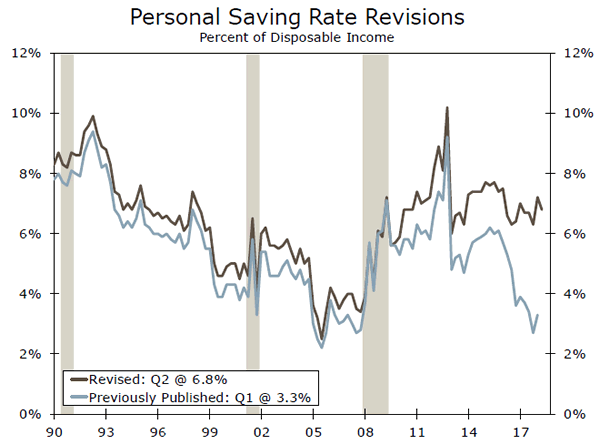
One other note from the revised GDP data is that the mix between corporate earnings and personal income is now slightly more weighted towards consumers. Moreover, the saving rate was revised significantly higher from 3.4 percent in 2017 to 6.7 percent. The saving rate averaged a slightly higher 7.0 percent during the first half of this year, reflecting tax reform.
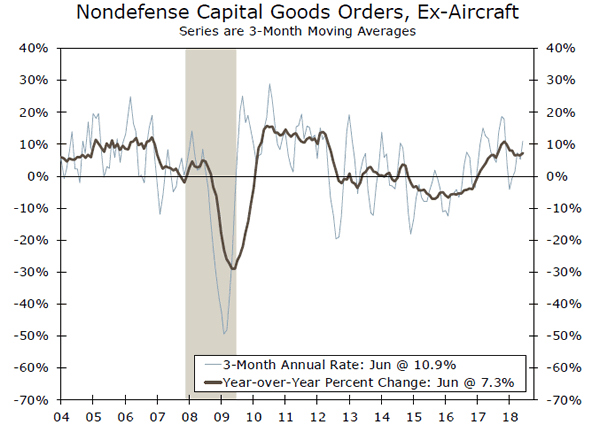
Durable goods orders ended the second quarter on a strong note. While the headline number came in below expectations, the underlying data were strong. Overall new orders rose 1.0 percent in June. That gain, however, was held back by an 11.6 percent drop in defense orders, which followed gains of 16.7 percent in May and 9.0 percent in April. Orders for commercial aircraft and motor vehicles both rose. Orders for nondefense capital goods, excluding aircraft, which lead the business fixed investment component of real GDP and rose 0.6 percent in June and at a 10.9 percent pace during the second quarter.
U.S. Outlook
Construction Spending • Wednesday
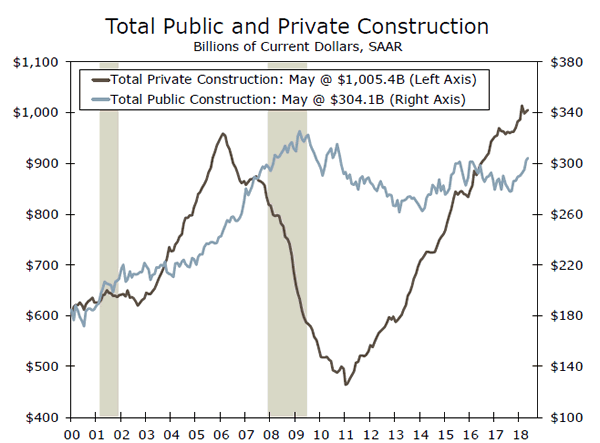
Construction spending rose 0.4 percent in May, below expectations. Nonetheless, construction outlays were up a solid 4.3 percent yearto- date. So far in 2018, the residential component has led growth. We expect residential construction to continue on an upward path, as new home construction rises to meet unmet housing demand. However, high construction costs and labor shortages remain a challenge, and are preventing some projects from moving forward.
Public construction spending rose 0.7 percent in May, above the 0.3 percent private-sector gain. This development is notable given prior weakness. On a nominal dollar basis, public outlays are only just back above their level in early 2016. However, average spending over the past three months is up a healthy 5.1 percent year-over-year. Public-sector revenue growth has strengthened in recent quarters, which is helping to support construction spending.
Previous: 0.4% Wells Fargo: 0.3% Consensus: 0.3% (Month-over-Month)
ISM Manufacturing • Wednesday
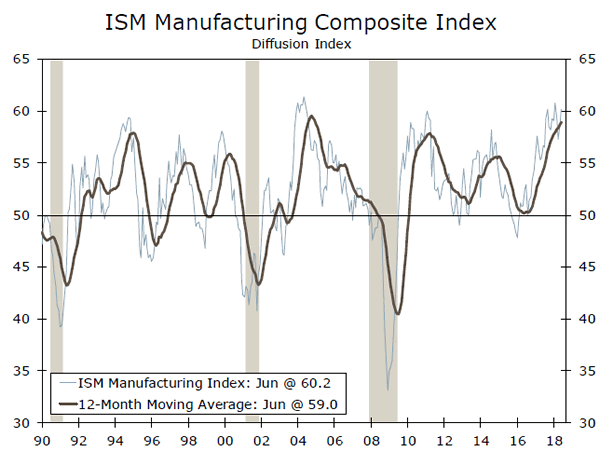
The ISM manufacturing index came in at a solid 60.2 in June, up from 58.7 in May. Both the production and employment components were strong. The ISM has strengthened considerable since 2016, at the same time as industrial production growth has recovered from an energy-led decline in 2015-2016. While gains in the ISM have significantly outpaced production growth in terms of magnitude, the two series are still generally moving together directionally, and both support a positive outlook for the manufacturing sector.
We are looking to the ISM for information about changes in input costs and how these are impacting manufacturing supply chains. In addition to the headline index and component break-outs, the ISM release includes qualitative observations from survey respondents. We will be reading the comment section of the June report for more color on the effect of labor shortages and tariffs on manufacturers, and for early indications of wage and inflation pressure.
Previous: 60.2 Wells Fargo: 59.0 Consensus: 59.2
Employment • Friday
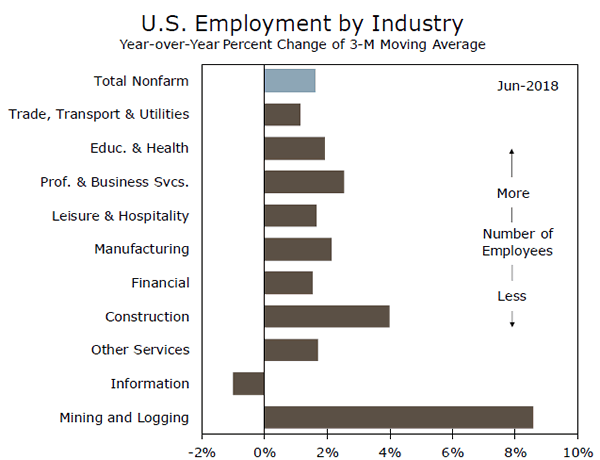
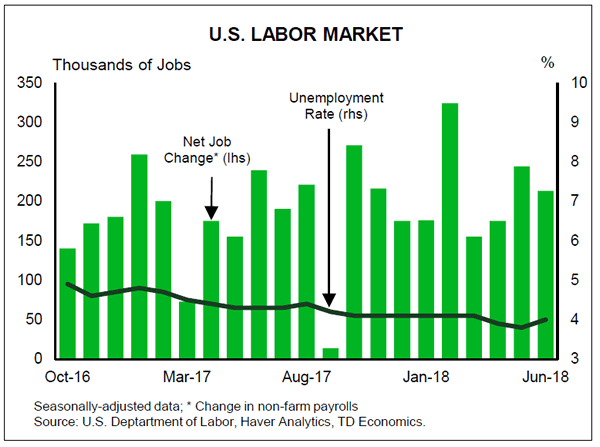
Payrolls increased 213,000 in June, just above the three-month average of 211,000. The diffusion index rose to 65.5 for private industries, indicating broad-based growth across sectors of the economy. Strong employment gains along with growth in aggregate hours worked (2.1 change, year over year, in June) is consistent with continued growth in personal income and consumption.
The unemployment rate ticked up slightly to 4.0 percent in May, as just over 600,000 workers joined the labor force. This pushed the participation rate up to 62.9 percent and ended a three-month slide in the participation rate for prime-age workers. Looking ahead, whether the current rate of employment gains can be sustained longterm depends on how many more workers on the sidelines can be convinced to join the labor force. Employers are facing increasing difficulty in filling open positions, which could put limits on the volume of hiring.
Previous: 213,000 Wells Fargo: 195,000 Consensus: 185,000
Global Review
Can I Put You On Hold?
- Amid a perceived thaw in international trade tensions this week, the European Central Bank (ECB) left most of the wording of its press release unchanged with no adjustment to forward guidance. The ECB will end its quantitative easing program at the end of the year, and will keep rates on hold through the summer of 2019.
- After a mixed second quarter GDP report in South Korea, that nation's central bank has to weigh rising pressure to normalize monetary policy against its vulnerability to global trade.
South Korea as Yardstick for Measuring Trade Tension
In the early days of the coal industry, miners would bring a caged canary into the mine with them because, if the air were contaminated by methane or carbon monoxide, the bird would fall ill or die before levels became dangerous to the miners themselves.
As worries mount about an incipient trade war, countries that are particularly reliant on exports can offer clues about the prospect for how trade is weighing on economic growth. One example of such a country is South Korea, where trade tensions are a major source of uncertainty as total exports as a share of GDP are more than 40 percent.
South Korea's economy grew at an annualized rate of 2.8 percent in the second quarter, which was a bit slower than the growth rate in the prior quarter. Despite slowing on a sequential basis, the year-over-year rate picked up slightly to 2.9 percent, and perhaps more to the point, net exports offered a bigger boost to the headline growth rate than any other category.
Before we declare the world safe from the perils of a slowdown in trade, it bears noting that the boost from net exports actually has more to do with slowing imports (down 10.0 percent at an annualized rate) than a surge in exports (which actually slowed substantially from the prior period and only grew at a 3.2 percent clip). For another data point, consider Singapore, an even more export-reliant economy, where growth slowed in the second quarter as well.
Other Areas of Growth and Outlook for Bank of Korea
Business investment slowed in South Korea in the second quarter after a strong Q1, but other than that all major categories were in expansion mode during the period.
Consumer spending advanced at 1.7 percent annualized rate and inventories increased a bit more than they did in the first quarter, resulting in a slight boost to headline growth.
At its most recent policy meeting in July, the Bank of Korea held its policy rate steady and downgraded its 2018 growth projection to 2.9 percent from 3.0 percent previously, citing corporate earnings and trade tensions as causes for the adjustment. Our own forecast for full year 2018 GDP growth in Korea is 2.7 percent.
With inflation in check and unemployment still somewhat high for structural reasons, economic conditions are not yet completely supportive of less policy accommodation. But that did not prevent one policymaker from dissenting at the July meeting, an indication that there is at least some pressure to hike rates as many other central banks are on a path toward normalization.
Although our baseline expectation is that the BoK will not raise rates at its next meeting on August 31, there is a case to be made that a hike is in the offing. The sole dissent in July came from Lee Il-houng, who as it happens was a sole dissent in October of last year (also favoring a hike), before the BoK went ahead with a 25 basis point hike the following month. In our view, the worries about global trade offset the less-than-compelling case to raise rates. Should those tensions abate, the odds of a hike go up.
Global Outlook
Bank of Japan Policy Meeting • Tuesday
Recent policy meetings at the Bank of Japan (BoJ) have been more or less uneventful because very few market participants have looked for the BoJ to change policy. However, there is a high degree of attention on the upcoming policy meeting. Japanese bond yields shot higher this week on speculation that the BoJ Policy Board may make changes to its current policy of "yield curve control," in which the BoJ buys bonds in an effort to keep the yield on the 10-year Japanese government bond "around 0 percent." Although we think it is premature for the BoJ to make a policy shift at this time, we will be watching the outcome of the meeting closely.
The BoJ policy meeting should be the highlight of the week, but it will occur in the midst of the usual end-of-month barrage of monthly Japanese economic data including June readings on retail sales, industrial production, unemployment and housing starts.
Previous: -0.10% Wells Fargo: -0.10% Consensus: -0.10% (Policy Rate)
Eurozone GDP • Tuesday
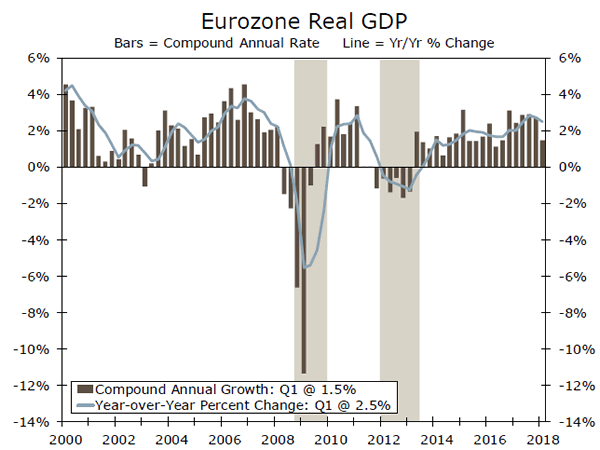
The Eurozone enjoyed its strongest annual average growth rate in ten years in 2017. However, GDP growth slipped in Q1-2018 and the consensus forecast anticipates that growth remained relatively lackluster in Q2. Should we be worried? Probably not. Most indicators suggest that the expansion in the Eurozone remains intact. However, the economy is simply not growing as strongly as it was last year. The GDP data will offer some more detailed insights into the current state of the macro-economy in the euro area.
Also of interest next week will be the "flash" estimates of overall CPI inflation and core inflation in July. The overall rate of CPI inflation in the Eurozone is currently running at the ECB's target of "below, but close to, 2 percent." However, the core rate of inflation is only 0.9 percent at present. Until the core rate of inflation rises on a sustained basis, the ECB likely will be hesitant to remove policy accommodation.
Previous: 0.4% Consensus: 0.5% (Not Annualized)
Bank of England Policy Meeting • Thursday
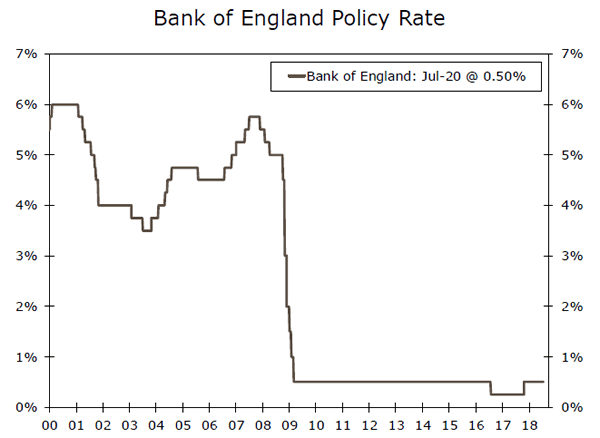
The Monetary Policy Committee (MPC) at the Bank of England (BoE) holds a regularly scheduled policy meeting on Thursday, and we look for the MPC to raise its main policy rate from 0.50 percent to 0.75 percent. Some recent soft economic data and lower-thanexpected inflation readings have some market participants questioning whether the MPC will actually pull the trigger. However, the MPC has publicly stated that rates eventually need to rise from their historic lows. In our view, the outlook for the economy is sanguine enough to encourage at least two MPC members to join the three other members who voted for a rate hike at the last policy meeting in June.
There are data releases scheduled for the money supply, house prices and consumer confidence, but the BoE policy meeting should be the highlight of the week in British financial markets. Previous: 0.50% Wells Fargo: 0.75% Consensus: 0.75%
Point of View
Interest Rate Watch
A Case of Mistaken Identity
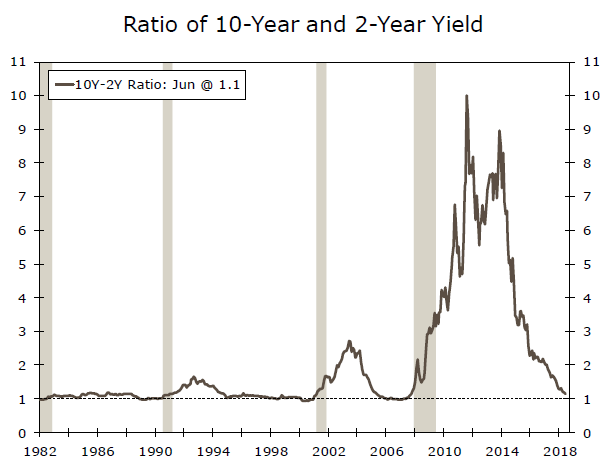
A recent article cited that the Federal Reserve was taking a risky path to ignore the trend toward an inverted yield curve (top graph) since the same pattern preceded the 2007 recession.
However, we know that the appearance of a flatter/inverted yield curve in the present economy misrepresents the economic reality of the Treasury market yesterday.
Appearances are Deceiving
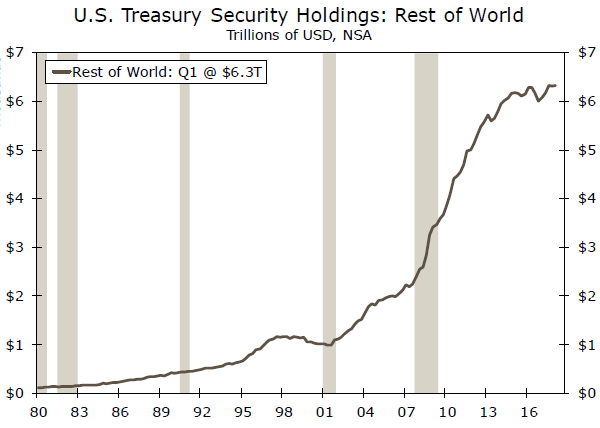
While the mathematics of the yield curve maybe obvious, the economic background is quite different. First and foremost is that global demand for U.S. Treasury debt has ballooned beyond the free market atmosphere of pre-2007. Central banks around the world hold more Treasury debt and private institutions demand Treasury debt as Tier 1 capital. As illustrated in the middle graph, the ramp up in the global holdings of Treasury debt since the Great Recession signals that the fundamentals that shape the yield curve have shifted. Moreover, much of the buying, such as the Fed's, represents a non-market pricing demand for U.S. Treasury debt.
As central banks and private banks demand Treasury debt for policy and regulatory reasons, the market signal from the yield curve becomes distorted.
Win-Win on the Treasury Bet
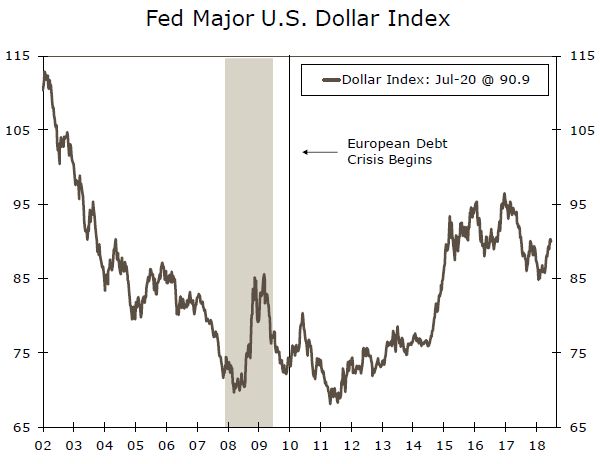
Foreign investors in the U.S. Treasury market have also benefitted in recent years from the appreciation of the dollar (bottom graph). Foreign investors have sought Treasuries as a safe-haven given the problems of the Euro. They have also increased demand for the dollar.
Interactions between financial markets have been a central focus of our interest rate watch essays. The relationship is not always (in fact seldom is) linear but must be respected by investors. Moreover, both rates and the dollar have feedback effects on the economy. These interactions are essential to assess in any interest rate forecast. Over the last five years, we have registered betterthan- consensus forecasts for the ten-year Treasury rate, no doubt in part to our assessment of these interactions.
Credit Market Insights
Beige Book: Growth in Loan Demand
The Federal Reserve's most recent Beige Book reported moderate or modest economic growth across the twelve districts, and credit conditions appear to be broadly stable throughout the economy. There were moderate increases in overall loan demand, and districts such as New York and Kansas City highlighted increased demand for mortgages. Other districts also mentioned a modest rise in the number of mortgages, but raised concern over the low inventory of homes for sale restraining further growth. New homes completed in inventory are currently at historic lows, so although demand for mortgages is increasing, the recent decline in mortgage applications suggests supply has yet to meet demand.
Rising mortgage demand comes as overall household debt is also increasing, up 3.8 percent year-over-year in Q1. The mortgage delinquency rate, however, continues to trend lower, and at 1.2 percent in Q1 is the lowest rate since Q3-2006. The Beige Book also confirms that delinquency rates declined slightly or were largely unchanged. Rising incomes and a solid overall economic landscape have likely positioned most borrowers to better manage housing debt. Mortgage debt as a percent of income has also declined, in sync with the trend of lower delinquency rates.
Although some districts noted rising interest rates as a possible risk to consumers meeting loan payments in the second half of the year, the Beige Book still depicts a solid overall credit market.
Topic of the Week
Trade Tensions with the E.U. Soften this Week
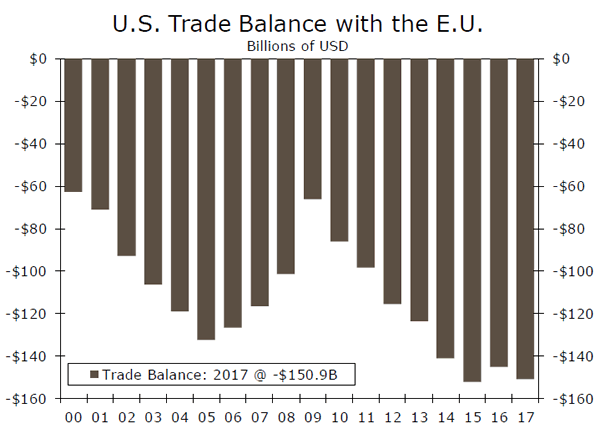
Earlier this week, President Trump and European Commission President Juncker reached a tentative trade deal in which the U.S. and European Union (E.U.) would work toward removing trade barriers and avoid implementing further tariffs on each other's exports. Trade tensions had risen significantly since early March, when the Trump administration announced tariffs on imports of steel and aluminum for most trading partners. Tensions escalated further in early June when President Trump announced the possibility of tariffs on E.U. auto exports to the U.S., in further response to a widening global trade deficit, in this case with the E.U. (top chart).
Tit-for-tat retaliation since that time has totaled up to more than $50 billion in additional tariffs on U.S. exports, with the E.U. specifically retaliating with tariffs on $2.3 billion of U.S. goods implemented on June 22. While developments this week suggest that a trade war has been avoided for now, we take this opportunity to examine the implications of a possible breakdown in trade negotiations between the U.S. and E.U.
Although talks this week support the removal of trade barriers, the steel and aluminum tariffs that took effect on July 1 still remain in place. In 2017, the U.S. imported roughly $1.3 billion and $6 billion, respectively, in aluminum and steel products from the E.U. In a $17 trillion-sized economy, the current tariffs are not that extensive in size. The proposed auto tariffs would represent a small share for Europe, as E.U. auto exports to the U.S. were only roughly $50 billion in 2017.
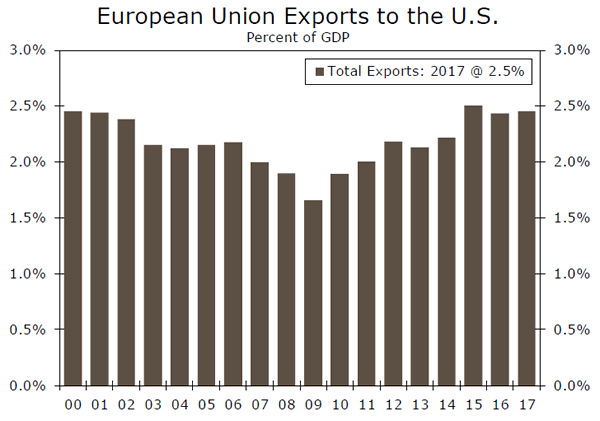
In our view, even if trade tensions deteriorated markedly and a full-blown trade war did appear on the horizon, the impact on the overall E.U. economy would probably not be catastrophic. In 2017, total E.U. exports to the U.S. totaled roughly 2.5 percent of GDP, a relatively small number (bottom chart). A full-blown trade war would need to involve tariffs on a wider variety of goods to have a more meaningful effect. For now, trade watchers can take a deep breath.
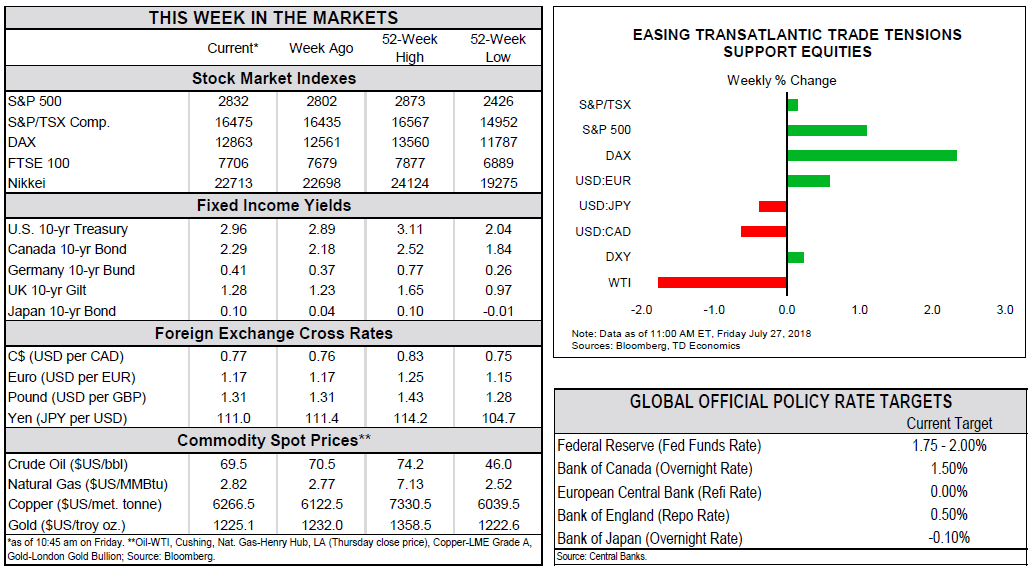
The Weekly Bottom Line: Terrific 4% Growth Pace Unlikely To Last
U.S. Highlights
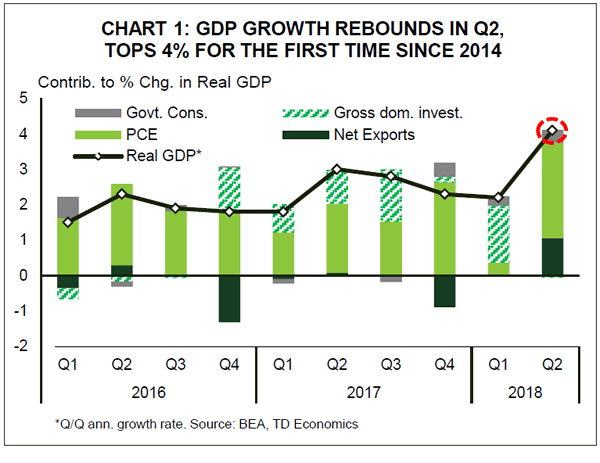
- U.S. economic growth topped 4% in Q2 for the first time since 2014. Consumer spending bounced back and resumed its leader status, but non-residential investment (+7.3%) and net exports also provided a helping hand.
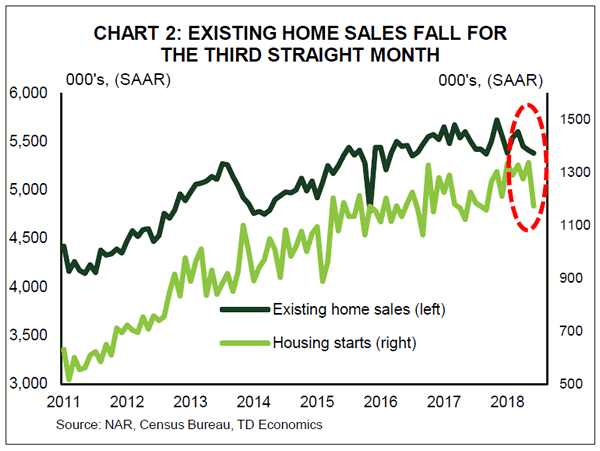
- Residential investment remained a soft spot, falling 1.1% in the quarter. Housing data out this week added to the downbeat narrative, with existing home sales extending their losing streak to three months.
- The U.S. and EU struck a truce on trade as they vowed to work together toward zero tariffs on industrial goods. This was welcomed by markets, but trade policy uncertainty and the downside risk that it poses is far from gone.
Canadian Highlights
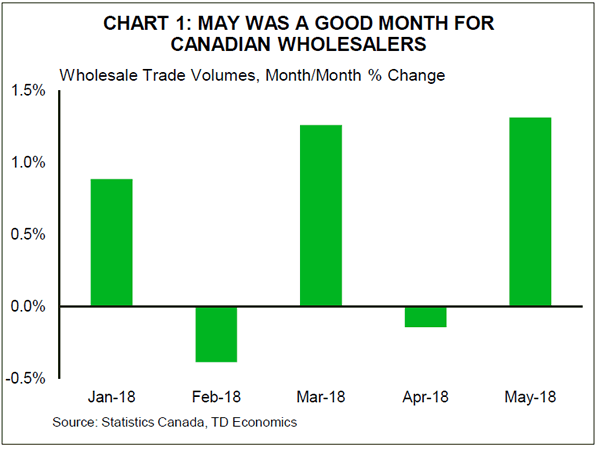
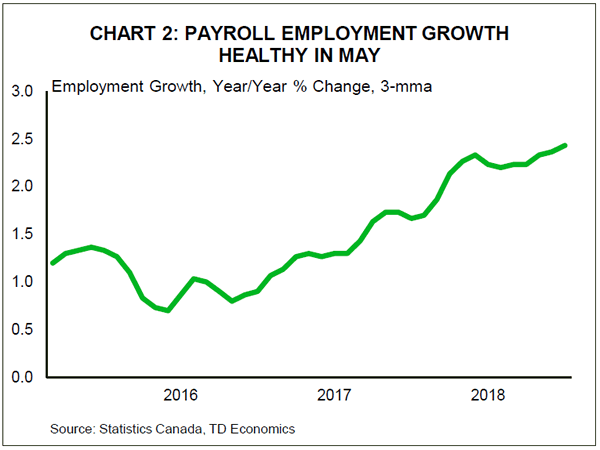
- Wholesale volumes grew at a brisk 1% pace in May while payroll employment expanded by a healthy 41k. These data points serve to reinforce our view that the economy is on track for near 3% growth in the second quarter.
- The agreement between President Trump and the EU to work on resolving their trade dispute helped to ease fears about looming import levies on Canada's auto sector. Trump also expressed some optimism around a NAFTA deal, which if reached sooner rather than later, would remove a significant source of uncertainty for Canadian businesses.
- In an interview, Minister Morneau indicated that addressing competitiveness challenges will be a key theme in the fall fiscal update, with the Minister likely to focus on lowering the cost of new investment for businesses.
U.S. - "Terrific" 4% Growth Pace Unlikely To Last
This morning's GDP report was highly anticipated given that it would confirm if the American economy had indeed shaken off the winter blues. Consensus forecast 4.2% (annualized) growth for the second quarter and the headline print did not disappoint, coming in just shy of that. This release included comprehensive revisions, such as new benchmark data and improvements which aimed to mitigate residual seasonality. As a result, growth in the majority of first quarters over the past decade was bumped up 0.4 ppts on average. Indeed, growth at the start of this year was nudged up 0.2 pp to 2.2%, which made a 4.1% rebound in Q2 even more remarkable.
The details of the report were largely positive, with some exceptions. Consumer spending bounced back and resumed its status as lead driver (Chart 1). But non-residential investment (+7.3%) and net exports also provided a helping hand. The latter contributed a full point to growth, driven by a 9.3% rise in exports. Part of this strength reflected a temporary spike in soybean and core shipments to beat out the imposition of tariffs from China – evidence that tariffs have already acted to distort economic activity. As the one-time factors are expected to reverse, the strong performance last quarter is unlikely to be repeated this year. But, growth is still expected to remain solid at near 3% in the second half of 2018.
One sore spot in today's GDP report was residential investment, which fell 1.1% – the second consecutive decline. Housing data out this week affirmed the downbeat narrative. Existing home sales fell 0.6% (m/m) in June, extending the losing streak to three months, despite a slight increase in inventories. The drop joined last week's tumble in housing starts (Chart 2), and a pullback in volatile new homes sales rounded off the sour data for June.
The housing market is likely to continue to face headwinds on both the supply and demand side ahead. A tightening labor market and rising incomes should continue to buoy buyer interest despite rising prices and higher interest rates. But, bigger challenges on the supply side, such as rising material costs and labor shortages, point to no quick turnaround for inventories. With supply likely to remain a limiting factor, gains in housing activity are anticipated to be gradual. This trend is likely to slow the recovery in the homeownership rate which rose to 64.3% in Q2, up 1.4 pp from its 2016 trough.
On the trade front, tensions between the U.S. and the EU simmered down this week as they agreed to work together toward zero tariffs on industrial goods. In addition, both parties agreed to refrain from imposing further tariffs, while the EU would increase the purchase of U.S. soybeans and LNG. The truce is certainly a step in the right direction and was welcomed by markets. But, we caution against reading too much into this. Contentious issues, such as food and environmental standards, suggest that tensions are likely to make a comeback. What's more, the ceasefire with the EU gives the U.S. more scope to focus its trade efforts on China, which could ramp up tensions with the Asian giant.
Canada - NAFTA, Competitiveness Issues Back in Focus
It was a relatively light week on the economic data calendar, with a few secondary releases providing a last look at activity ahead of next week's GDP release for May. Wholesale volumes advanced at a brisk 1% pace during the month (Chart 1), thereby erasing April's modest drop.
Canada's other labour market survey (known as the SEPH) was released and also brought a dose of good news. This indicator is somewhat lagged and not as closely followed by financial markets as its more timely LFS counterpart, although it still provides important detail on the state of Canadian labour markets.
According to the SEPH, job growth was strong in May (Chart 2), with payrolls expanding by a healthy 41k – about double the long-term average. This compares favourably to the LFS, which reported an 8k job gain (once agricultural and self-employment is stripped out to make the two surveys more comparable). Hourly earnings also posted a solid gain during the month.
Ultimately, the flow of data released this week reinforced our forecast that GDP likely grew at robust 0.4% m/m in May, placing the economy well on track for 3% growth in the second quarter. However, it likely did little to move the needle for the Bank of Canada, who also expect near 3% growth.
In addition to the recent signs of economic vigour, the Canadian dollar and bond yields were bid higher on an improved tone from the U.S. administration around trade policy. The trade agreement struck by President Trump and the EU at mid-week, which suspended the threat of auto tariffs on the EU, eased fears about looming import levies on Canada's auto sector. Further, President Trump also expressed some optimism around a NAFTA deal, albeit with Mexico before Canada, though Canadian and Mexican dealmakers still appear to favour a three-way pact. All told, the renewed push ahead on trade talks offers some hope that an agreement could be reached sooner rather than later, which would remove a major source of uncertainty for Canadian businesses.
Another risk to Canada's medium-term outlook stems from its eroded competitive position versus the U.S. in the wake of the latter's sweeping tax reforms enacted late last year. To that end, in an interview this week Finance Minister Morneau gave a preview of the upcoming federal fiscal update set to be released late in 2018.
In his interview, Morneau noted that competitiveness challenges were a key theme shaping the budget update while other areas of focus include the NAFTA renegotiation and the government's recently purchased Trans Mountain pipeline. On the competitiveness front, the Minister indicated that he was more focused on "lowering the cost of new investment", as opposed to broad-based cuts in the corporate rate. This likely reflects the government's desire to keep the cost down of any forthcoming package. Based on this signaling, a move to match the US to full expensing of capital equipment is in play.
U.S.: Upcoming Key Economic Releases
U.S. Employment - July
Release Date: August 3, 2018
Previous: 213k, unemployment rate 4.0%
TD Forecast: 175k, unemployment rate 3.9%
Consensus: 185k, unemployment rate 3.9%
We expect payrolls to slow to 175k as surveys signal a pullback below 200k. We expect the unemployment rate to slip to 3.9% as a jump in unemployed workers corrects, and look for a benign 0.2% rise in wages, keeping the y/y pace at 2.7%. Earlier in the week Q2 ECI will be eyed and we expect a 0.7% rise, pushing y/y growth only marginally higher to 2.8%.
Canada: Upcoming Key Economic Releases
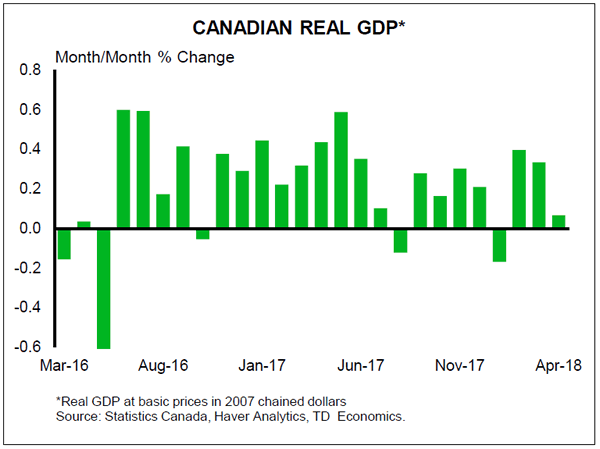
Canadian Real GDP - May
Release Date: July 31, 2018
Previous: 0.1% m/m
TD Forecast: 0.4% m/m
Consensus: 0.3% m/m
TD looks for industry-level GDP to rise by 0.4% m/m in May on the heels of a broad pickup in activity data. Goods output will benefit from energy and a rebound in manufacturing sales while utilities will act as a headwind on a return to seasonal temperatures after cold weather saw a sharp rise in electricity output for April. Residential construction is also expected to weigh modestly on growth, though a surge in June housing starts suggests a rebound is right around the corner. On the service side we look for a broad advance in output, with retail sales and food services benefitting from the return to normal weather. This would leave Q2 growth tracking near a 3% pace, slightly above Bank of Canada projections.
Canadian International Trade - June
Release Date: August 3, 2018
Previous: -$2.77bn
TD Forecast: -$2.40bn
Consensus: -$2.20bn
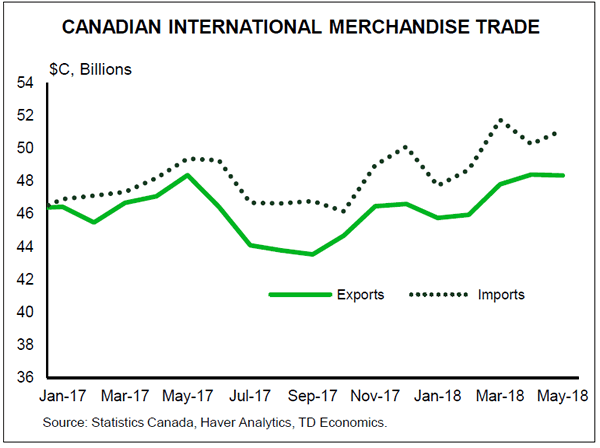
TD looks for the trade deficit to narrow to $2.4bn in June, with both exports and imports higher on the month. A rebound in motor vehicles will drive export growth though metals will provide a partial offset due to the recently introduced steel and aluminum tariffs, which affect roughly $1.5bn in exports per month. Energy exports will also be affected by another shutdown in the oil sands, though this will have a larger impact in July. On the other side of the ledger, imports should benefit from a rebound in retail activity and auto production, after disruptions at a major parts supplier weighed on the latter in May.
Dollar Mixed Ahead of Busy Week in the Market
The US dollar is mixed on Friday against major pairs. The US economy grew at a 4.1 percent pace on the second quarter according to the first estimate. The number came in right on the forecast which had no positive effect for the USD, but it did validate the U.S. Federal Reserve decision to keep a tighter monetary policy with two more rate hikes in the horizon this year. The week from July 30 to August 3 will be full to the brim featuring monetary policy announcements from the Bank of Japan (BOJ) the Fed, the Bank of England (BoE) and the release of jobs data in the United States.
- US Fed forecasted to stand pat on Wednesday
- Bank of England (BoE) expected to hike by 25 bps
- US could have added close to 200,000 jobs in July
EUR Falls on Dovish ECB and Political Tension
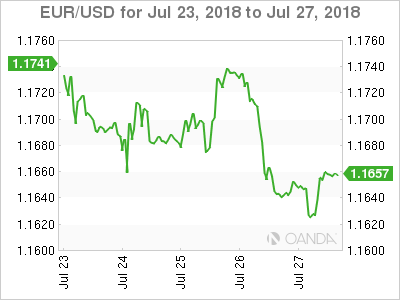
The EUR/USD lost 0.51 percent in the past five days. The single currency is trading at 1.1659 after the European Central Bank (ECB) did not provide any additional information at the end of its monetary policy meeting in July. The statement was almost a word for word recreation of the June document offering no insights for investors on when the central bank is willing to start lifting rates. The growing gap between US interest rates and European rates and an impressive growth rate in the second quarter in America gave the edge to the US dollar.
US President Trump said on Friday that the US will beat the current pace of growth going forward. The strong fundamental data will be vital for Republicans as they face midterm elections in the fall. Politics in Europe continue to add uncertainty as Italy’s Five Star founder once again is seeking a referendum on euro membership.
The U.S. Federal Reserve is not expected to announce any changes on Wednesday when it wrap up its August meeting. The next rate move is expected in September, which a more than 90 percent probability of a hike if inflation and growth continue in their current trends.
Loonie Rises on NAFTA Optimism
The USD/CAD lost 0.64 percent in the last week. The currency pair is trading at 1.3058 in a week that saw trade war concerns ease. The NAFTA and EU-US trade conversation both had positive sound bites this week. Incoming Mexican President was eager for a quick NAFTA renegotiation and he was echoed by the Trump administration. Canada and Mexico made sure to be clear that a trilateral negotiation is needed as the US has been pushing for two bilateral sit downs.
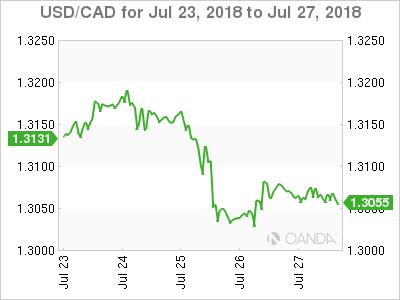
The loonie reached its higher level in six weeks on Wednesday amidst rising oil prices despite multiple evidence of ample supply. Disruptions in Saudi Arabia and the ongoing uncertainty with Iranian crude continue to push prices higher.
The main Canadian economic events during the week will be the release of the monthly GDP report on Tuesday and the Trade balance on Friday.
Yen Higher Ahead of Bank of Japan
The USD/JPY lost 0.43 percent in the last five trading sessions. The currency pair is trading at 110.95 ahead of the July 31 Bank of Japan (BOJ) policy meeting. The central bank has remained on the sidelines for most of the year and its most active contribution was to remove inflation targeting in April. The BOJ has in place an easing monetary policy that includes bond buying to keep 10 year bond yields under control.
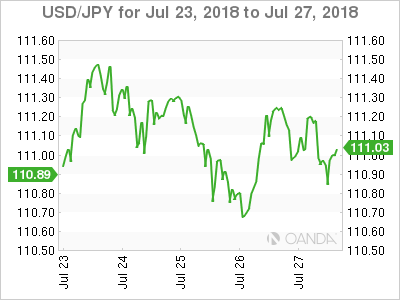
There is a possibility that the BoJ will change the extreme form of its QE program on Tuesday, but it remains small given the lack of strong economic indicators out of Japan. Inflation continues to struggle and the economy contracted in the first quarter of 2018 so at this point it remains unlikely that the Bank of Japan would join the group of central banks who are scaling back their quantitive easing efforts.
GBP Awaiting BoE Rate Hike
The GBP/USD lost 0.08 percent during the week. The currency pair is trading at 1.3116 amid political tension due to Brexit with three consecutive weekly losses. The Brexit deal that was presented to the EU, a hard fought battle for Prime Minister Theresa May and for which hard core Brexiteers resigned, was knocked back by EU Brexit negotiator Michel Barnier. Key elements were rejected outright, even both parties still cling to an October deal.
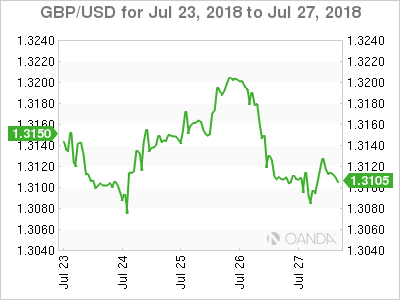
The GBP lost despite heavy anticipation of a rate hike by the Bank of England (BoE) on super Thursday. The market is pricing in a 81 percent probability of a 25 basis points rate lift to 0.75 percent. Last meeting there were three dissenters that opposed holding rates. Despite a higher interest rate the comments from Bank of England Governor Mark Carney will be in focus as he could add a dovish tone as political uncertainty will surely make the job of protecting the UK economy harder.
Market events to watch this week:
Tuesday, July 31
- 10:00am USD CB Consumer Confidence
Wednesday, August1
- 4:30am GBP Manufacturing PMI
- 8:15am USD ADP Non-Farm Employment Change
- 10:00am USD ISM Manufacturing PMI
- 10:30am USD Crude Oil Inventories
- 2:00pm USD FOMC Statement
- 2:00pmUSD Federal Funds Rate
Thursday, August2
- 4:30am GBP Construction PMI
- 7:00am GBP BOE Inflation Report
- 7:00am GBP MPC Official Bank Rate Votes
- 7:00am GBP Monetary Policy Summary
- 7:00am GBP Official Bank Rate
- 7:30am GBP BOE Gov Carney Speaks
Friday, August3
- 4:30am GBP Services PMI
- 8:30am USD Average Hourly Earnings m/m
- 8:30am USD Non-Farm Employment Change
- 8:30am USD Unemployment Rate
- 10:00am USD ISM Non-Manufacturing PMI
*All times EDT
Australia & New Zealand Weekly: Falling Electricity Prices is a Game Changer for Australian Inflation
Week beginning 30 July 2018
- Falling electricity prices is a game changer for Australian inflation.
- Australia: dwelling approvals, trade balance, retail sales, private credit, CoreLogic home value index.
- NZ: employment, wages, building consents, business confidence.
- China: NBS and Caixin PMIs.
- Europe: CPI, employment, GDP.
- US: FOMC policy decision, payrolls, PCE inflation, ISM surveys.
- Central banks: BOJ, BOE and RBI policy decisions.
- Key economic & financial forecasts.
Information contained in this report current as at 27 July 2018.
Falling Electricity Prices is a Game Changer for Australian Inflation
The June Quarter CPI printed 0.4%qtr compared to Westpac's forecast for 0.4%. The market median was 0.5%. Given that at 2 decimal places the rise in the CPI was 0.36%qtr it's clearly a soft update. The annual rate was lifted on base effects to 2.1%yr compared to 1.9% in 2018 Q1 and 2017 Q4 and 1.8%yr in Q3.
The core measures, which are seasonally adjusted and exclude extreme moves, rose much as expected (0.46%qtr vs our 0.50%qtr forecast). In the quarter, the trimmed mean gained 0.52% while the weighted median lifted 0.49%. Including revisions, the annual pace of the average of the core measures was 1.9%yr a moderation from the 2.0%yr pace in the previous three quarters.
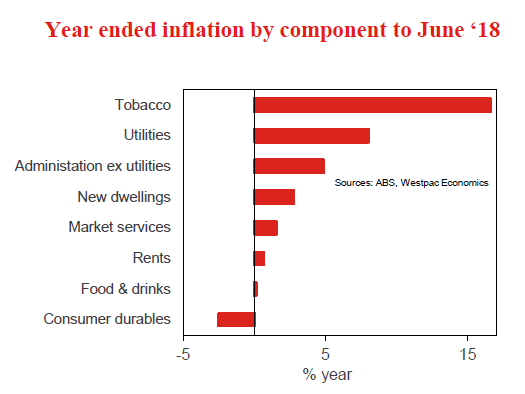
The ABS analysis also confirmed the negative seasonality in the June quarter CPI with the seasonally adjusted estimate rising 0.5%qtr vs the 0.4%qtr headline print. It is curious then that the market had a 0.5% qtr median forecast for both the headline and core inflation. Unless there was something extreme in the distribution of price changes, then all else held equal, you would expect that the forecast for core inflation should be higher than your estimate of the headline inflation given that the components are seasonally adjusted before trimming. The fact that the market median headline estimate was equal to the core estimate suggests to us many analysts are making educated guesses for their forecasts and not completing bottom up component forecasts, then trimming the results, as Westpac does.
The six month annualised pace of core inflation is now 2.0%yr from 2.0%yr in Q1, and 1.7%yr in Q4 2017. For a broader core inflation measure, more in line with some international measures, market sector goods and services excluding volatile items rose 0.4%qtr holding the annual pace flat at 1.1%yr.
Key non-tradeable prices, particularly for housing, health and education, are restraining inflation, while energy prices have become an outright deflationary force. Outside of these factors however, there is no real evidence of a broadening in price disinflation/ deflation. For a more in depth review of the June Quarter CPI please refer to our bulletin Aust 2018 Q2 CPI: Waiting for Godot has a record run at the ABS.
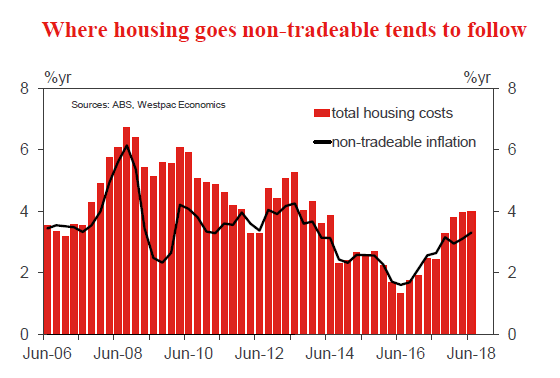
Our interest is focused on housing costs, as where housing costs go, so too does non-traded inflation. Housing costs were close to our expectations rising 0.2% vs. 0.1% expected. However, the mix was very interesting with rents flat (0.2% expected), dwelling purchases rose 0.8% (vs. 0.5% expected) while the fall in utilities was greater than anticipated (–1.2% vs –0.9% expected). For utilities there was an expected fall in electricity bills (–1.3%qtr) and an even larger fall in gas & other household fuels (–2.2%qtr).
For rents, outside of the 0.8%qtr increase in Hobart, all other capital cities reported very soft or falling rents. Sydney and Melbourne reported gains of 0.3%qtr and 0.2%qtr respectively while rents fell –0.2%qtr in Brisbane and –1.8%qtr in Perth. Adelaide rents rose 0.4%qtr. Going forward it does appear there are downside risks to the very modest gains in rents we have in our inflation profile.
More significant to our inflation profile has been the shift in household energy bills. Up until this year, rising wholesale electricity and gas prices were driving household utilities costs higher. Then last year a policy shift by the Queensland Government and an unexpected surge in renewable power generation saw a collapse in wholesale electricity prices. Also the Federal Government's intervention in the gas market last year to ensure more gas for domestic use helped to ease price pressures.
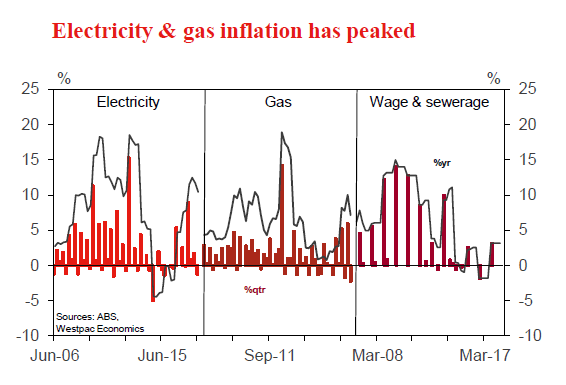
This is a game changer. Until recently we had expected that rising electricity prices would remain a meaningful inflationary pulse at least through 2018 and possibly into 2019. The recent fall in wholesale prices, which is likely to continue with the ongoing investment in renewables, plus Federal Government pressure via the release of a recent ACCC report into the National Electricity Market (ACCC releases blueprint to reduce electricity prices) we expect electricity prices to fall through 2018 and the first half of 2019. We have been conservative with the estimated decline and suggest the risks to our electricity inflation forecasts lie more to the downside than the upside.
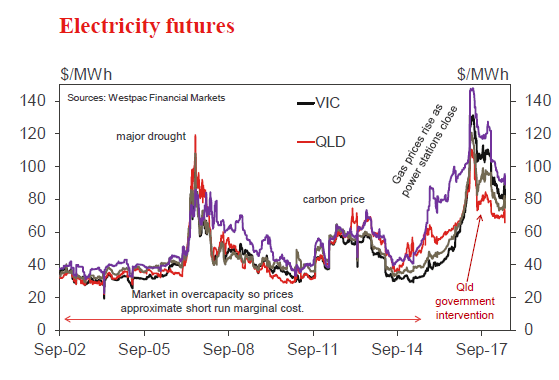
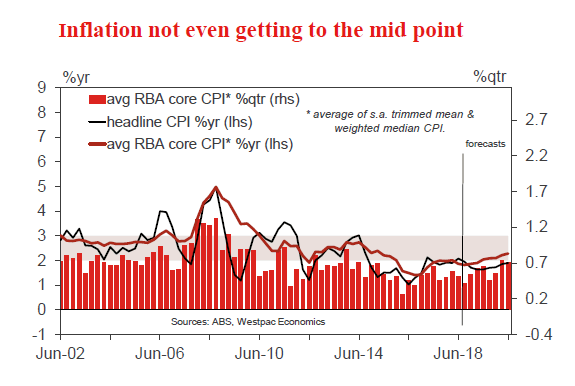
The resulting impact of these changes is that we now forecast headline inflation to remain below 2.0%yr out to the end of 2019 (our forecast is for 1.7%yr at end 2019). That is correct; not only do we not expect inflation to return to the mid point of the target band but we don't expect it to get back into the band.
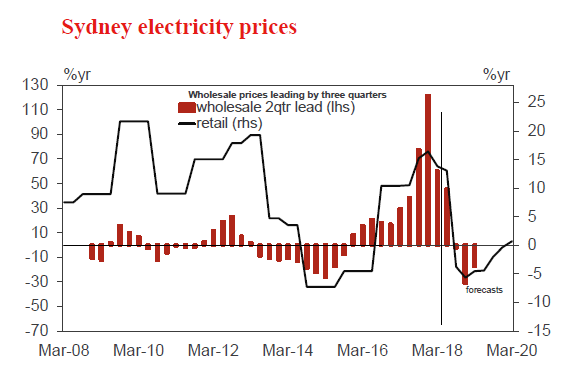
But it is important to note that falling electricity prices are a key factor for dampening headline inflation. As to core inflation, we see it holding close to the bottom of the RBA's target band through this period (2.1%yr at end 2019). As such, we think it is too early to start debating the risk of a rate cut by the RBA. RBA Governor Lowe has stated that in an environment of sound employment growth it was not in the interest of the welfare of the nation to lower interest rates further, as given such low embedded inflation, this may not generate the inflationary pulse via wages but rather just boost credit growth and further lift asset prices. (see RBA Governor, Philip Lowe, at the ECB Forum on Central Banking). The June Quarter CPI, and the revisions to our inflation forecasts are consistent with an RBA on hold out to the end of 2019.
Outside of utilities the other area where downside pressure appears to be significant was the smaller than expected seasonal re-pricing for household contents & services (0.3% vs 0.8% expected). It does appear that the competitive pressure to hold down prices in this sector continues so we are watching this space carefully. Our forecasts incorporate some pass through from a weaker AUD through the next two years. Any lack of such pass through presents a downside risk to both our headline and core inflation forecasts.
The week that was
Here and abroad, inflation was a key focus this week. In addition, for a change trade tensions eased as initial talks between the US and Europe were held. That said, the tense stand-off between the US and China remains.
For Australia, the June quarter CPI kept to a familiar theme as the headline series disappointed the market's expectation for a seventh consecutive quarter. Headline and core inflation were both benign in the quarter at 0.4% and 0.5% respectively, with the weaker result for headline inflation coming as a result of June being a seasonally weak quarter (the core measures are seasonally adjusted and so abstract from this volatility). The annual rates also remain wedded to the bottom of the target band, at 2.1%yr and 1.9%yr respectively for headline and core inflation.
As it stands, the balance of risks imply that inflation is likely to hold around this pace through the remainder of 2018 and 2019. Key non-tradeable prices, particularly for housing, health and education, are restraining inflation, while energy prices have become an outright deflationary force. Outside of these factors however, there is no real evidence of a broadening in price disinflation/ deflation. As a result, inflation will not act as a catalyst to change the stance of policy.
While focused on Australia, it is also worth highlighting the recent release of the July Westpac Red Book, our in-depth assessment of the consumer. Key in this edition is the emerging tension between consumers' increasingly positive view of the economy and still-circumspect attitudes towards family finances.
The surprise passing of the Government's personal tax measures has clearly bolstered sentiment, albeit more so towards the broader economy than individuals' finances. Arguably this speaks to cost of living pressures remaining front of mind, as well as angst that wealth is being eroded by house price declines, particularly in Sydney and Melbourne. To the current modest pace of consumption growth and the throttling back of residential investment, negative wealth effects and tighter lending standards are clear risks.
For the global economy, it was a relatively quiet week, with only two key events: a meeting between US President Trump and EC Commission President Juncker on trade; and the ECB's July policy meeting.
For the market, the trade meeting achieved what was hoped: an easing of trade tensions through an agreement to discuss reducing trade barriers between the two global super powers. It will be some time before talks occur and detail is released; but for the moment, market sentiment will rest on a surer footing as long as a further escalation of tensions between the US and China does not eventuate. With this backdrop, the ECB met for their July meeting.
The guidance provided on policy was the same as at the June meeting. Notably, rates remaining on hold "through the summer" was confirmed to mean that the first rate hike would not be seen until after summer's end. Ergo, the stance of policy in Europe will be unchanged until at least September or October 2019, with the exception of the end of asset purchases at December 2018 (which is already priced into markets).
To see a rate hike cycle start at that time, economic growth needs to remain broad based such that wage and income growth accelerates further, and inflation develops a robust foundation. From less than 1.0%yr at June 2018, core inflation has a long road to travel to be near (but below) 2.0%yr on a sustained basis as the ECB intend. Worth noting from the Q&A was: the ECB's comfort with the Euro's depreciation in 2018, which is seen as the result of the US' outperformance on growth and policy; and yet another call for fiscal reform from President Draghi. The latter is certainly necessary if activity and job growth is to remain above trend in coming years.
Chart of the week: Australia CPI forecast errors
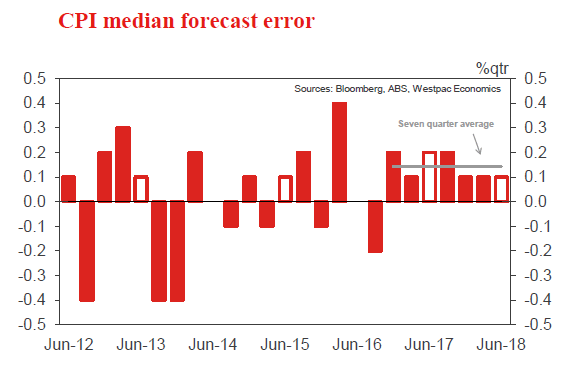
The June Quarter CPI printed 0.4%qtr compared to Westpac's forecast for 0.4% and the market median of 0.5%.
We have now seen seven consecutive quarters where forecasters over-estimated the CPI print. The average error since the December quarter 2016 is +0.14ppt. Core inflation came in as expected and, as a group, analysts are broadly getting the core inflation pulse corrected (average error 0.02ppt over seven quarters) but continue to underestimate the disinflationary pulse hitting certain sectors leading to greater than usual discounting (or less than usual post sales repricing) in those sectors.
New Zealand: week ahead & data wrap
Over the past week we've seen more evidence that the economy slowed in the first half of the year. Notably, net migration has continued to slow and there are signs that firms are aren't importing capital equipment at the same pace they were earlier in the year. Soft growth in recent months is also likely to mean that after a string of stronger reports, the labour market took a breather in the June quarter.
This week we had further confirmation that the economy shifted down a gear in the first half of the year. One thing we had been expecting was a lull in business investment on the back of policy uncertainty and weak business confidence over recent months. This view was supported by recent surveys where businesses reported that they intended to invest less over the coming months. However, until this week, we had little hard evidence of an actual decline in investment. This week's merchandise trade data may be one of the first signs. The pace of capital equipment imports slowed in June, consistent with our forecasts of a temporary lull in business investment in the second half of the year. We expect to see further cooling in capital equipment imports evident in trade data in the coming months.
Another key element of the slowdown is lower net migration. June net migration data was again consistent with this view. Monthly net migration slowed further, taking annual net migration to its lowest point since November 2015. While this is still a historically high level, annual net migration has fallen from a peak of 72,500 to just below 65,000 now.
Much of the recent easing in net migration has been driven by changing trans-Tasman flows. The relative attractiveness of the Australian labour market has improved on the back of strong employment growth and a falling unemployment rate. We expect the relative attractiveness of labour market conditions to continue to move in Australia's favour over the coming years. This is likely to lead to a growing number of New Zealanders once again heading to Australia to seek their fortunes across the ditch.
That said, local labour market conditions are currently uncertain. Presently, labour market conditions are very firm with the unemployment rate at a 9 year low and widespread angst amongst firms about the difficulty of finding workers. However, we expect the slowdown in broader economic conditions to ultimately impact on demand for labour – albeit with a lag. These competing tensions are likely to be evident in the suite of labour market data for the June quarter released next week.
On balance we expect the unemployment rate to hold steady at 4.4%. While labour market data can be notoriously choppy from quarter to quarter, the unemployment rate tends to be the most reliable measure of what's truly going on. What's more, some of the detail in next week's release could be a little surprising for financial markets. Most notably we're forecasting negative employment growth for the quarter. Much of this reflects our allowance for a distorted seasonal pattern in the survey rather than a genuine difference of opinion with other forecasters expecting positive employment growth. Nevertheless, such a seemingly weak result would likely generate some commentary and a reaction in financial markets. We emphasise focusing on the unemployment rate as the most reliable measure.
With inflation firmly back on the radar for both markets and the Reserve Bank in recent weeks, there will also be interest in how the various wage measures are evolving. To date there has been little evidence that the tightening labour market has led to a pickup in wage pressures. And our forecasts assume that this remains the case in the June quarter. Although we expect a 0.5% quarterly lift in the Labour Cost Index (LCI) (a step up from the string of 0.4% increases) the lift is mostly due to this year's larger than usual minimum wage hike and last year's aged care workers' pay equity settlement. The LCI tends to evolve very slowly, so any deviation from our forecast – in either direction – would be noteworthy. Importantly, we don't expect wage pressure will be contained indefinitely. Rising inflation expectations combined with a low unemployment rate and policy changes that have swung the dial in favour of employees in wage negotiations should see wage inflation eventually start to drift higher next year.
With the Reserve Bank's dual employment and inflation mandate now firmly in place, next week's labour market data will also form an important part of the deliberations ahead of the Monetary Policy Statement released on the 9th of August.
For the record, we think it's extremely unlikely that any surprises in the labour market data will be enough to shift the Bank from its on hold "for some time to come" stance. While inflation pressures are rising, most notably with non-tradable inflation printing above the RBNZ's forecasts in Q2, and measures of core inflation edging higher, rising inflation pressures are being largely offset by slower growth. GDP grew 0.4% in the March quarter, well short of the RBNZ's 0.7% forecast while their 0.8% forecast for Q2 also looks too optimistic to us.
Given these broadly offsetting developments, the RBNZ is unlikely to be hurried into action any time soon. We maintain our view that it will be the final quarter of 2019 before the RBNZ raises the OCR.
Data Previews
Aus Jun dwelling approvals
- Jul 31, Last: –3.2%, WBC f/c: flat
- Mkt f/c: 1.0%, Range: -3.0% to 4.0%
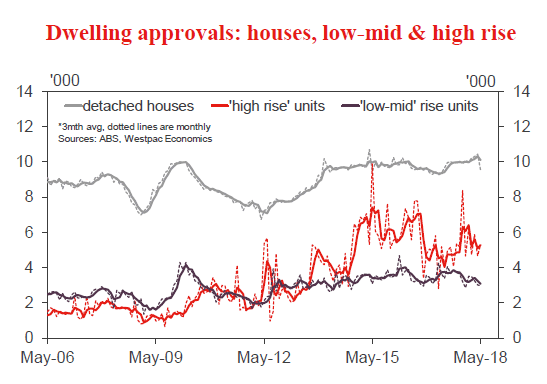
Dwelling approvals fell 3.2% in May with a surprisingly sharp 8.6% fall in private detached houses partially offset by a 4.3% rise in units. With some wild swings in some of the state detail, we advise caution in interpreting the latest figures. In particular, a sharp fall in Qld may prove to be noise or a temporary pull-back. More generally, key parts of Westpac's forecast for a further weakening in high rise construction have yet to come through.
The June update should resolve some of these questions. While the May drop looks overdone, construction-related housing finance approvals continue to point to a clear downtrend in non-high rise approvals. Meanwhile site purchases have for some time been pointing to a further sharp leg lower for high rise approvals. On balance we expect total approvals to hold flat in June even with some give back on the May weakness in houses. Risks abound including potential upward revisions to previous estimates.
Aus Jun private credit
- Jul 31, Last: 0.2%, WBC f/c: 0.3%
- Mkt f/c: 0.3%, Range: 0.3% to 0.4%
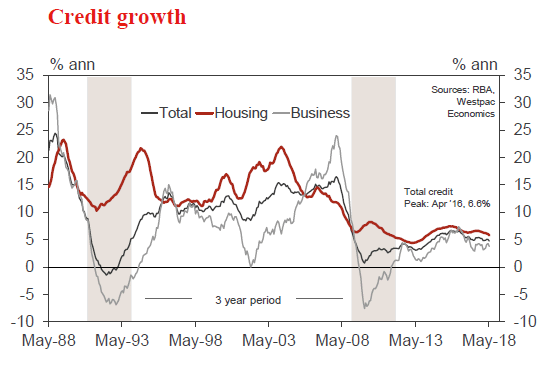
Private sector credit growth is modest and slowing as housing cools. In May, credit grew by only 0.2% and annual growth slipped to 4.8%, down from 5.4% last September. For June, we anticipate a rise of 0.3% and annual growth of 4.5%, the slowest pace since early 2014.
Housing credit, at this late stage of the cycle, is slowing as tighter lending conditions see new lending decline. In May, housing credit growth was 0.37%mth, 5.8%yr. The 3 month annualised pace has eased to 5.1% and is set to move lower.
Business credit, 3.8% above the level of a year ago, is volatile around a modest uptrend as businesses increase investment in the real economy. For May, it was a weak update, a -0.2%, after a 1.2% jump over the previous two months. We anticipate a small rise in June - but volatility means there is a degree of uncertainty around this figure.
Personal credit continues to contract, -1.3% over the year.
Aus Jul CoreLogic home value index
- Aug 1, Last: –0.3%, WBC f/c: –0.5%
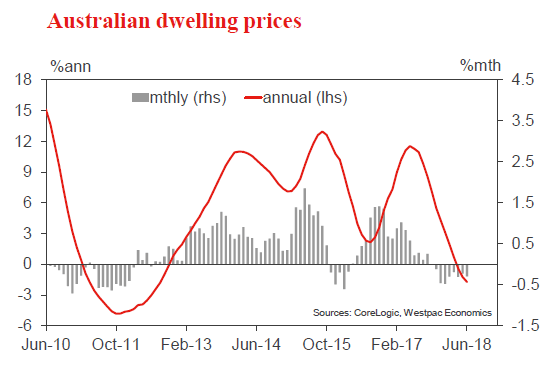
Australia's housing market continues to correct. Prices dipped 0.3% in June marking the ninth successive monthly decline. Prices nationally are down 2.2% from their Sep peak.
The correction remains both relatively shallow and narrowlybased, concentrated in the previously strong Sydney and Melbourne markets. These two markets have now seen no net gain in prices since late 2016 and mid-2017 respectively. The Perth market remains stuck in its long running correction as well.
The daily index suggests price slippage quickened again in July with a 0.5% decline that will mean prices are down –2.5%yr nationally. Auction clearance rates weakened notably through May-June-July, pointing to an additional drag from tightening loan criteria and longer approval processing times.
Aus Jun trade balance, AUDbn
- Aug 2, Last: 0.8, WBC f/c: 1.1
- Mkt f/c: 0.9, Range: 0.2 to 1.6
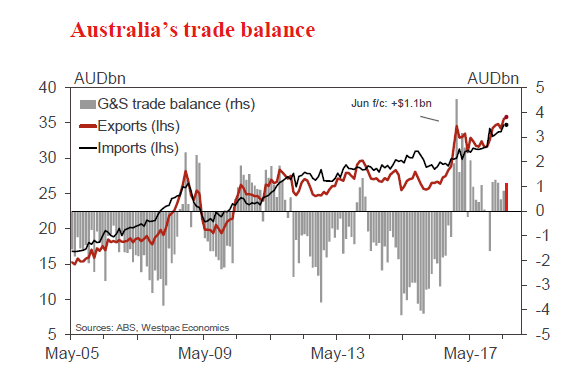
Australia's monthly trade account has been in surplus so far in 2018. For June, we anticipate another trade surplus, widening a little to $1.1bn, up from $0.8bn in May.
The import bill is expected to be broadly unchanged, with a lift in volumes potentially offset by a modest pull-back in fuel prices (following sharp rises of late).
Export earnings are expected to expand by 0.8%, $0.3bn, boosted by a lift in coal volumes and higher coal prices. Fuels (including LNG) and metal ores (including iron ore) are expected to be little changed with modest gains in volumes offset by lower prices.
The average monthly trade surplus for Q2 would be $0.8bn (subject to revisions), narrowing from $1.2bn for Q1. This modest deterioration likely reflects the impact of a decline in the terms of trade, down an estimated -1½%.
Aus Jun retail trade
- Aug 3, Last: 0.4%, WBC f/c: 0.3%
- Mkt f/c: 0.3%, Range: 0.1% to 0.7%
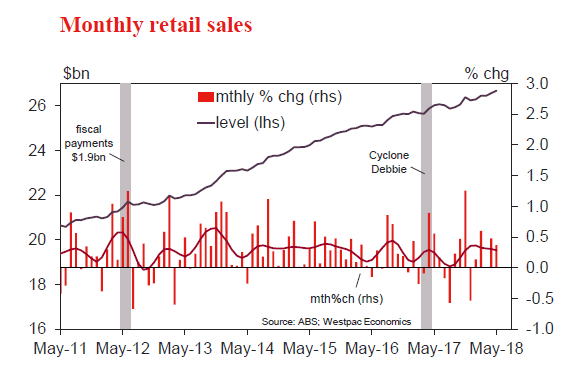
Retailers reported a slightly better than expected, though still modest, 0.4% lift in sales in May. A rebound in clothing and department stores drove the gain with weak conditions across other categories. Some of the rebound is likely weather-related after abnormally warm conditions weighed on clothing sales in the early part of winter. Retail ex clothing and department stores was flat in the month.
Indicators suggest retailers continued to see mixed conditions in June. Consumer sentiment lifted following the tax cuts announced in the May Budget but key spendingrelated components remained soft. Private business surveys were mixed, retail responses to the NAB survey softening but the AiG survey showing an improvement. On balance, we expect May to show a 0.3% gain. Note that price discounting pressures are easing a touch and may ease further with GST changes on July 1 that mean low value imported goods will now be taxed.
Aus Q2 real retail sales
- Aug 3, Last: 0.2%, WBC f/c: 0.8%
- Mkt f/c: 0.8%, Range: 0.4% to 1.0%
Q1 was a weak quarter for consumers with real retail sales rising just 0.2%. The main surprise was around retail prices which rose 0.4%, accounting for most of the nominal gain in sales over the quarter. The price lift was mainly driven by food with price deflation continuing across non food categories. Notably the detail showed weaker quarter to quarter volumes across almost all non-food categories as well.
The disappointing Q1 result follows a choppy run, the previous four quarters showing gains of 0.2%, 1.4%, 0.2% and 0.8%. Some of this may be due to shifts in the timing of sales, particularly around the Christmas-New Year period.
The Q2 update is likely to show a rebound. Nominal sales are on track to be up 1.0% vs 0.6% in Q1. The Q2 CPI detail suggests retail prices rose about 0.2% in the quarter – this time with weakness in food offsetting firmer non-food prices. While uncertain, the mix points to a 0.8% rise in real sales.
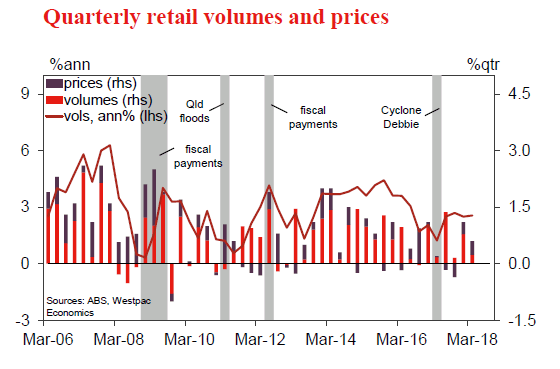
NZ Jun residential building consents
- Jul 31, Last: +7.1%, WBC f/c: -12%
Residential consent issuance surged higher in May, rising by 7.1%. That took consent numbers to their highest level since 2004. In part, this pickup was due to some 'lumpy' changes, including a roughly 25% increase in the usually stable standalone homes category in Auckland last month. More importantly, there has been a sizeable trend increase in medium density consents in Auckland, supported by regulatory changes.
Consent numbers in most other regions remain firm, though issuance in Canterbury is gradually easing back.
With some 'lumpy' issuance in recent months, we expect to see a sizeable pullback in overall consent numbers in June. However, the level of issuance is still expected to remain elevated, supported by continued high numbers of consents for medium density homes in Auckland.
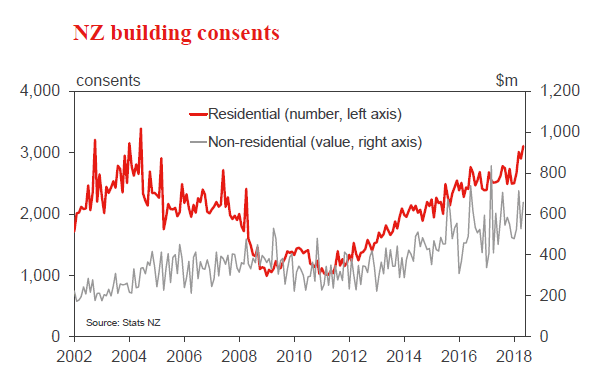
NZ Jun ANZ business confidence
- Jul 31, Last: -39
Business confidence weakened further in June and firms' expectations of their own activity fell to its lowest level since November 2017.
The fall in business confidence was relatively widespread. However, there was some improvement in confidence in the agricultural sector in June following the Government's announcement of its intention to attempt eradication of Mycoplasma bovis and a strong opening payout forecast from Fonterra. Since then dairy prices have fallen sharply which may dent confidence.
Inflation expectations edged higher in June and could go further in the coming months on the back of rising petrol prices and higher headline inflation.
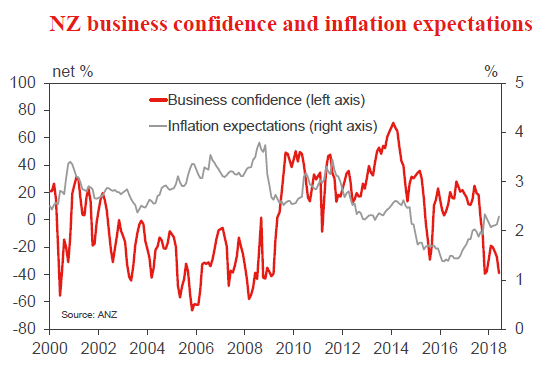
NZ Q2 Household Labour Force Survey
- Aug 1 Employment, Last: +0.6%, WBC f/c: -0.3%, Mkt f/c: +0.4%
- Aug 1 Unemployment Last: 4.5%, WBC f/c: 4.4%, Mkt f/c: 4.4%
New Zealand's labour market has tightened over recent years. But slowing economic growth is likely to put a dampener on the pace of improvement.
We expect the unemployment rate to hold steady at 4.4% in the June quarter, ending a five-quarter run of declines. This is in line with the Reserve Bank's forecast and other market forecasts.
Where we differ is in our forecast of a drop in employment for the quarter. That largely reflects our allowance for a distorted seasonal pattern in the survey. Nevertheless, such a seemingly weak result would likely generate some reaction in the market. We recommend focusing on the unemployment rate as the most reliable measure of labour market trends.
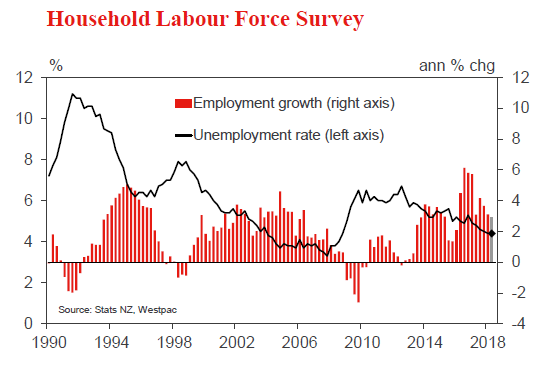
NZ Q2 Labour Cost Index
- Aug 1, Private sector Last: 0.4%, WBC f/c: 0.5%, Mkt f/c: 0.6%
The Labour Cost Index is a very slow-moving measure of wage growth. Recent years have seen a string of 0.4% quarterly gains, aside from the aged-care workers' pay equity settlement in Q3 last year.
We expect a slightly larger 0.5% increase for the June quarter. The main factor is the 4.8% minimum wage hike this year, compared to average increases of 3.4% in the last few years. That aside, we don't expect to see widespread evidence of a pickup in wage growth yet.
In contrast, the Quarterly Employment Survey (QES) measure of average hourly earnings has accelerated in the last year, and we expect a further pickup this time. But this measure slowed sharply a year ago, and it's not clear whether this rebound will be sustained
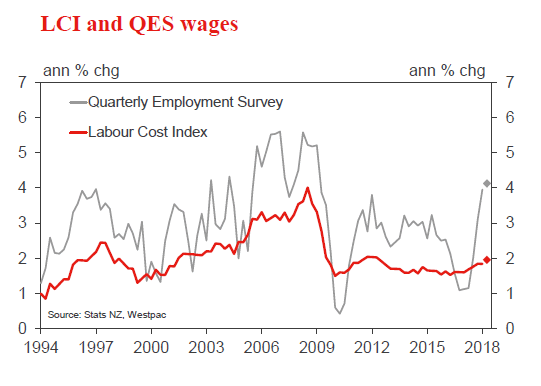
UK Bank of England Bank Rate
- Aug 2, Last: 0.5%, WBC f/c: 0.5%, Mkt f/c: 0.75%
The Bank of England's August decision is looking finely balanced. The BOE has previously signalled a gradual modest tightening will be required over the next few years. And since their previous decision, we've seen the unemployment rate remain low and a number of indicators have pointed to a firming in growth through the middle part of the year.
However, the pace of growth remains muted. In addition, inflation has been easing back, with the core rate now down to 1.9%. On top of those factors, the political backdrop remains rocky, with Brexit casting a long shadow over the economy's longer-term outlook.
Given the lingering downside risks, we expect that the Bank of England will keep the Bank Rate on hold at its August meeting, and that they will maintain a gradual tightening bias.
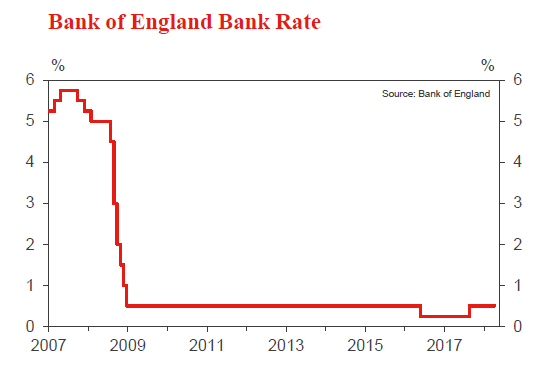
US FOMC Aug policy meeting
- Aug 1, Last: 1.875%, WBC f/c: 1.875%
The recent run of data has been with confidence and the FOMC. While they are very unlikely to upset the apple cart by accelerating the pace of fed fund rate hikes, the view put forward for the economy after the Aug 1 meeting will be very constructive.
Evident in recent communications has been strong confidence in the labour market and hence household consumption. Meanwhile in the business sector, though recent trade tensions have fostered risks, broadly the Committee continues to believe that investment will add to growth through this year and next.
Also apparent is that Chair Powell and the rest of the FOMC are not (yet) concerned about what the yield curve may be signalling, or financial conditions more broadly. The latter will bite, but not until mid-2019 after four more hikes.
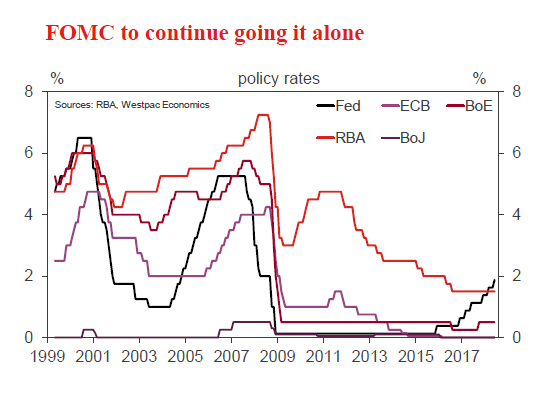
US Jul employment report
- Aug 3 Employment change, Last: 213k, WBC f/c: 180k
- Aug 3 Unemployment rate, Last: 4.0%, WBC f/c: 3.9%
The US labour market has continued to exceed expectations in 2018. Employment growth continues to run well ahead of the pace needed to hold the unemployment rate constant. And, as a result, all measures of labour market slack have continued to move lower, past historically low levels.
Come July, we look for another strong result, albeit a little more modest than those seen of late. A 180k gain would still see the average pace of 2018-to-date remain above that of 2017, and would further build the case for stronger wage gains.
On that point, it is worth noting that the June data for personal income and the employment cost index on 31 July will precede the July employment report. Both are worthy of close attention.
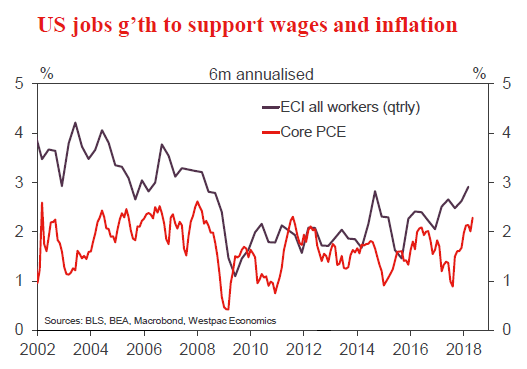
Week Ahead – BoJ, Fed, BoE Policy Decisions Awaited; Eurozone GDP and US Jobs Report also in Focus
It’s going to be a big week for central banks as the Federal Reserve, the Bank of Japan and the Bank of England hold policy meetings in the next seven days. Economic data will also be at the forefront with plenty of major releases, including the US jobs report and the first look at Eurozone growth in the second quarter. However, as has been the case in recent weeks, the underlying market sentiment may be determined by US trade policy as frictions with China persist.
Another tweak from the Bank of Japan?
The yen got a bit of lift earlier this week on reports that the Bank of Japan will be debating making changes to its massive stimulus program at its July 30-31 policy meeting. Following the ECB’s decision in June to end its bond purchases by the year end, the BoJ remains the only major central bank that has yet to pull the plug on quantitative easing and there’s long been speculation when it would do so. However, investors may have gotten ahead of themselves in longing the yen this week. The most likely scenario is that the BoJ will merely announce some modifications to its program in order to make it more sustainable given that, with inflation still well below target, it is no position to exit it anytime soon. Reports suggest one such tweak will be changing the composition of its exchange-traded funds (ETF) purchases, which may not impact the yen much if the BoJ doesn’t alter any other part of its program.
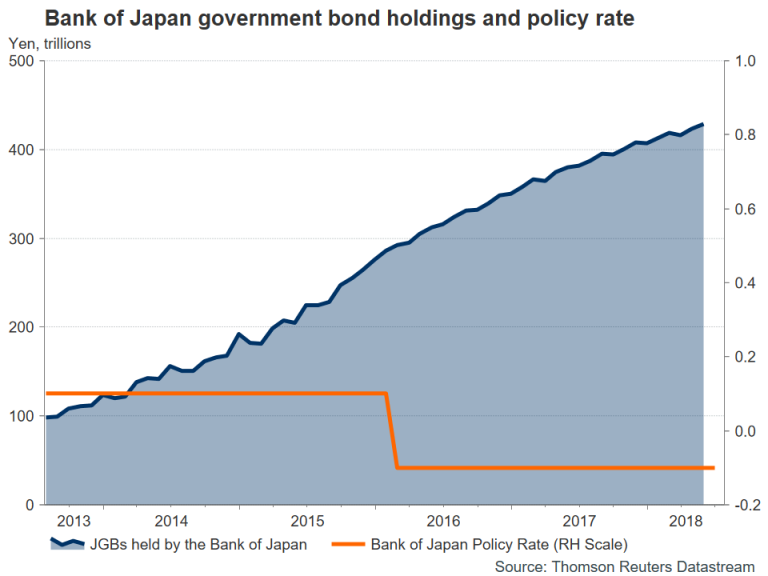
Apart from the BoJ meeting, there will also be some key releases to sift through out of Japan. June data on retail sales, the unemployment rate and preliminary industrial output are all due on Tuesday.
Aussie and kiwi look to data for direction
Recent indicators out of Australia have been on the strong side, while in New Zealand, they’ve been mostly softer. However, ongoing trade uncertainty has confined the Australian and New Zealand dollars to a range versus the greenback over the past month as the US dollar itself has been lacking clear direction.
The aussie should see some reaction to June data next week and could get a lift if they underscore the broadly improving economic backdrop in Australia. Traders should keep an eye on Tuesday’s building approvals, Thursday’s trade figures and retail sales numbers on Friday. Also of significance for the aussie will be PMI data out of China as the Australian currency is considered to be a good liquid proxy for China’s economy. The official manufacturing and non-manufacturing PMIs are both due on Tuesday and will be followed by the private Caixin manufacturing and services PMIs on Wednesday and Friday respectively. Over in New Zealand, the quarterly employment report due on Wednesday will be monitored for clues as to whether economic growth picked up in the second quarter.
Loonie hoping to extend gains
Sticking with commodity-linked currencies, the Canadian dollar will be seeking to stretch its gains beyond the 6-week high of C$1.3020 per US dollar it touched this week. Higher oil prices and some optimism regarding the NAFTA renegotiations were the main drivers of loonie strength, doing what a Bank of Canada rate hike was unable to acheive earlier in the month. A strong set of figures next week could boost the odds of another BoC rate hike later this year. In particular, the monthly GDP numbers for May will be watched on Tuesday. Also due the same day are June producer prices, while on Friday, trade figures for the same month will attract interest.
Eurozone growth and inflation in the spotlight
Investors will get the first glimpse of second quarter GDP growth for the euro area next week, along with some other notable releases from the bloc, starting with the European Commission’s economic sentiment gauge on Monday. The index, which tracks activity across various sectors of the Eurozone economy, is expected to continue sliding downwards, falling to 112.0 in July. On Tuesday, the flash reading of July inflation will be eyed together with the preliminary estimate of second quarter growth. The annual rate of Eurozone CPI is forecast to hold steady at 2.0% in July. But the core rate, while moving higher, is expected to stand at half the headline rate at 1.0%, underscoring the need for the ECB to maintain plenty of monetary accommodation.
Euro traders, though, will be paying more attention to the GDP data for signs of a rebound in the region’s growth rate. Analysts, however, are not anticipating an acceleration just yet, with growth for the quarter ending in June projected to remain unchanged at 0.4% quarter-on-quarter. Other data from the Eurozone will include the unemployment rate for June on Tuesday, the final PMI prints for July on Wednesday and Friday, June producer prices on Thursday and retail sales on Friday (also for June).
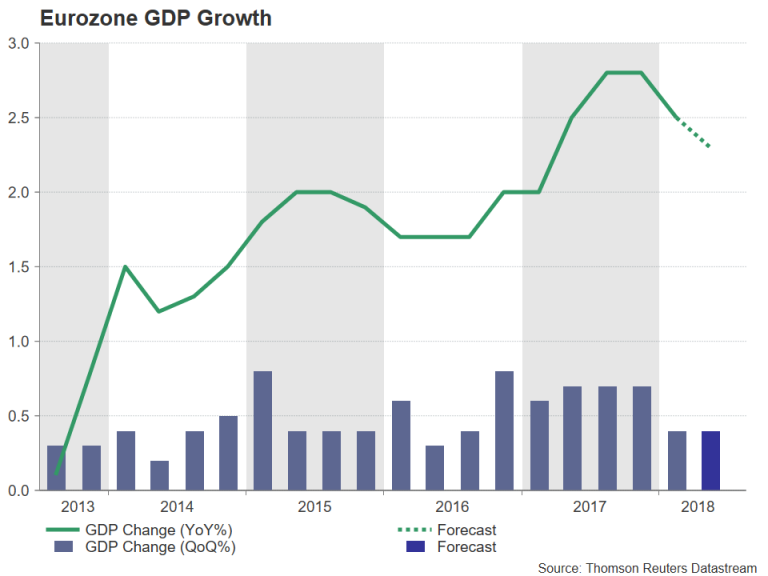
Bank of England to raise rates
Amid all the political uncertainty in the UK related to Brexit, the Bank of England is expected to press ahead with a rate hike on Thursday when it concludes its two-day monetary policy meeting. After a planned rate increase in May was derailed by unexpectedly weak growth in the first quarter, the Bank is keen to proceed with very gradual tightening. Policymakers are worried that there is limited slack available in the UK economy and this could prevent inflation falling to the Bank’s target of 2%. However, some analysts believe a bigger reason for the BoE to raise rates at a time when both growth and wage pressures are subdued is to create some room to cut rates in the event of the UK crashing out of the EU without a deal.
The pound hasn’t benefited substantially from rising expectations of an August rate hike, as Brexit woes have weighed on the currency and its response to the Bank’s decision will probably depend on the MPC vote. A tight vote of 5-4 in favour of a 25bps rate increase could see sterling sliding as it would signal a low likelihood of a follow-up hike. However, a hawkish vote with seven or more MPC members voting for higher rates could trigger a pound rally.
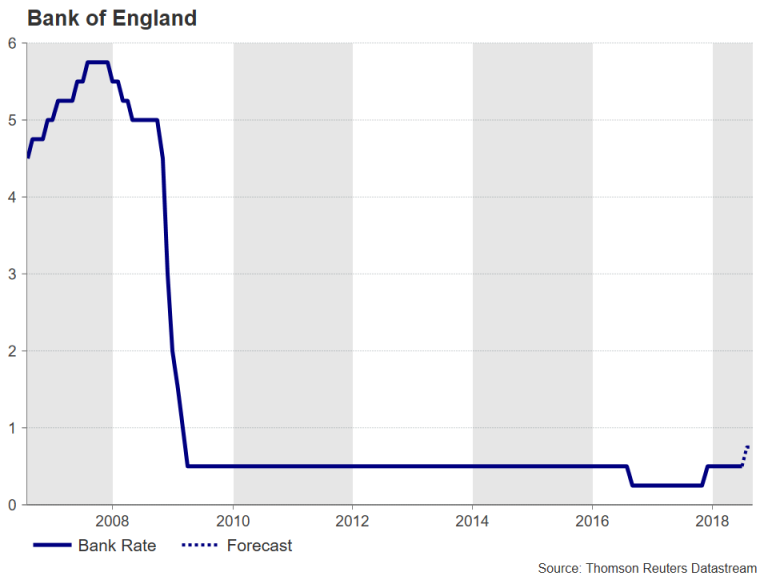
Sterling watchers will also be looking at June PMI numbers out of the UK next week. The IHS Markit/CIPS manufacturing PMI for July is up first on Wednesday and will be followed by the construction PMI on Thursday and the services PMI on Friday.
Fed to hold rates but US data to reinforce view of more hikes to come
It’s going to be a very busy week for dollar traders with the US calendar looking packed and a policy meeting by the Federal Reserve coming up as well. But with the FOMC meeting on July 31-August 1 not considered to be a ‘live’ one as there will be no press conference and no quarterly economic projections, it’s expected to be a non-event with no change in policy anticipated. The focal point instead will be on data, with PCE inflation, the ISM PMIs and the nonfarm payrolls report being the main highlights.
Starting the week are pending home sales for June. Recent figures suggest the US housing market is slowing and there could be a further indication of this on Monday. On Tuesday, the personal consumption expenditures (PCE) report will provide the latest update on personal income, consumption and the Fed’s preferred inflation gauge, the core PCE price index. Both personal income and consumption are forecast to grow by 0.4% month-on-month in June, underlining the strong momentum in the second quarter. The core PCE index hit 2% for the first time in six years in May and is forecast to stay at that level in June. Also due on Tuesday are the closely-watched surveys the Chicago PMI and the consumer confidence index. The ISM manufacturing PMI will be the most important release on Wednesday. The index is expected to ease only marginally in July from 60.2 to 59.8 as US manufacturers continue to enjoy strong demand. Thursday will be quieter with just June factory orders likely to draw some attention. But things should heat up on Friday as the July jobs report, the ISM non-manufacturing PMI and June trade numbers are published.
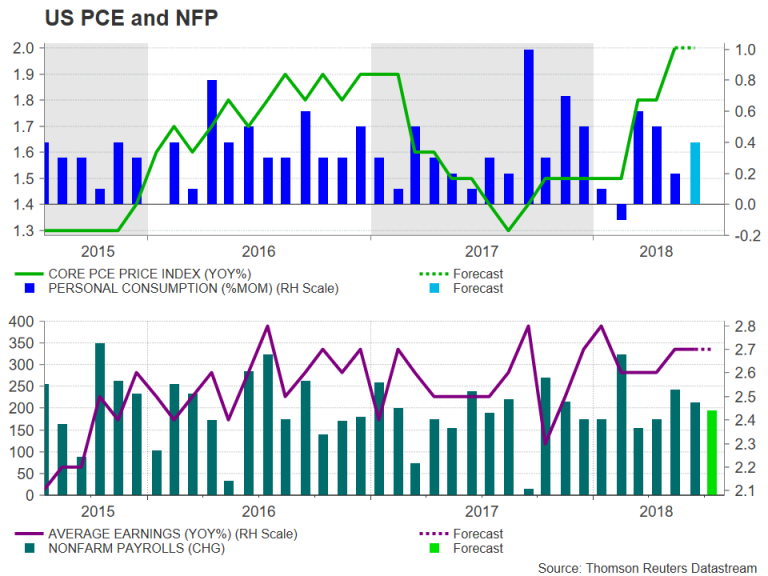
The pace of American jobs growth is expected to slow in July, with nonfarm payrolls rising by 195k, down from 213k in the prior month. The unemployment rate is forecast to dip slightly from 4.0% to 3.9%, but average hourly earnings are expected to remain steady at 2.7% year-on-year, with no sign yet of an acceleration in wage pressures.
The dollar and US Treasury yields stand to gain from a possible combination of a strong core PCE and wage growth readings. However, softer or an uninspiring set of figures would pressure the greenback, especially against the yen.