Sample Category Title
US GDP: Growth Favors Drift up in Market and Fed Funds Rates
GDP grew 4.1 percent, with gains in consumer spending, business investment and government spending—the classic C+I+G of demand. Year-over-year PCE grew 2.2 percent—enough to sustain higher interest rates.
Real Final Sales: Benchmark to Domestic Strength
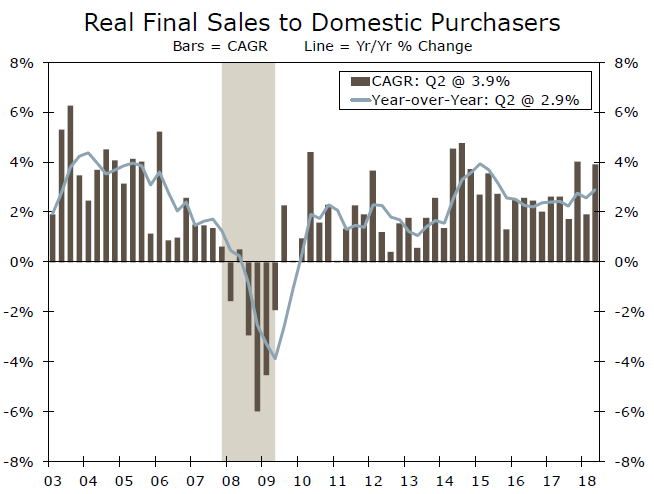
Despite the headline GDP number, we focus on real final sales as a measure of sustainable economic growth over time. As illustrated in the top graph, this benchmark came in at a 2.9 percent year-over-over gain. This will support the outlook for 3 percent-plus growth in 2018 and continued Fed policy to raise the funds rate in September.
Real consumer spending rebounded, as expected, at a 4.0 percent pace, with gains in durable and nondurable goods as well as services. Helping the consumer is a healthy labor market, rising disposable income due to tax cuts, improved consumer confidence and the wealth effect of higher home and equity prices. Ahead, rising inflation will limit real income gains, and higher interest rates may already be impacting housing markets.
Government spending also contributed to growth, up 2.1 percent in Q2 with gains in both federal and state/local sectors. Overall, consumer spending, residential investment and government spending all are on a sustainable path to contribute to growth in the second half of this year.
On the downside, residential construction fell 1.1 percent in Q2 after a first quarter decline of 3.4 percent. This remains disappointing relative to many expectations at the start of the year.
Business Investment: Growth Today, Productivity Tomorrow?
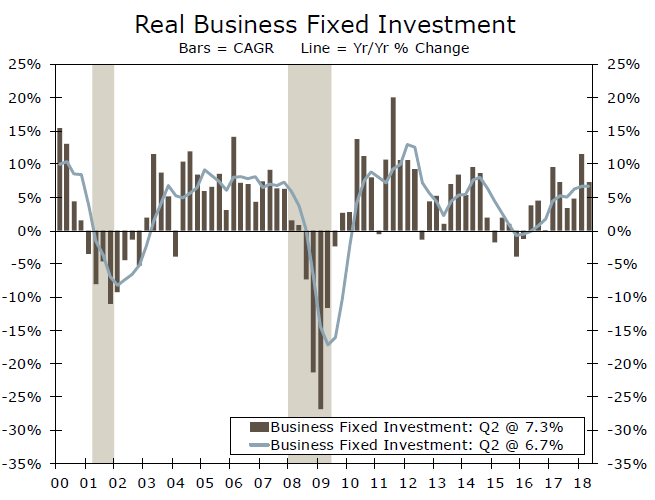
Business fixed investment rose 5.4 percent in the quarter, reflecting core capital goods shipments at a slightly slower pace than the first quarter. Structures, equipment and intellectual property all contributed to the gain. Structures have benefited from higher global oil prices.
Looking forward, the issue remains how much the gains in business equipment spending and intellectual property will add to productivity so as to sustain 3 percent-plus growth for 2018 and 2019. The jury is still out.
Inflation: Upward Drift
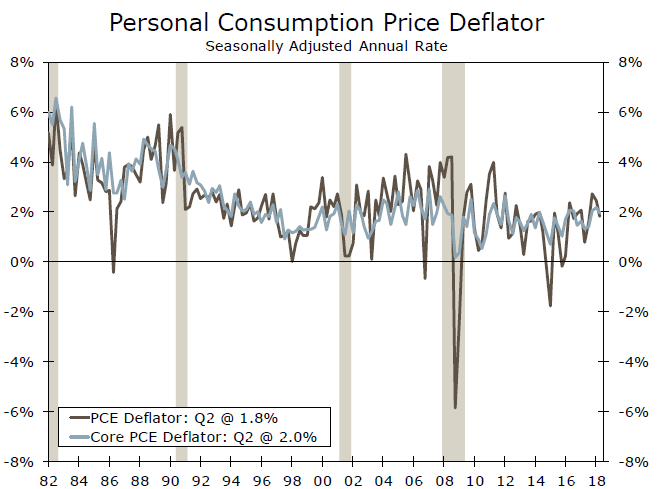
With the year-over-year change in the personal consumption expenditures (PCE) deflator (2.2 percent) as well as the core PCE deflator (1.9 percent) up relative to the past four quarters, the case remains for the Fed to raise the benchmark funds rate. Service prices rose 2.5 percent in Q1.
For the broader economy, residential prices were up 7.5 percent in Q1, hinting that affordability may be an issue for the weaker-than-expected pace of gains in the housing market.
Therefore, there is a developing theme that we will monitor. Higher interest rates appear to have an impact on the housing market. Meanwhile, the Fed is likely to follow the inflation numbers and raise rates in September while also reducing its balance sheet. We will watch for other signals where higher rates make a difference and hint at the possibility that the Fed will alter the path of rates implied in its dot plot.
Sunset Market Commentary
Markets
Today’s European bond trading was confined to narrow ranges, largely ignoring disappointing French Q2 GDP data (0.2% QoQ 1.7% YoY vs. 0.3% and 1.9% expected). European bonds held on to yesterday’s modest gains following the ECB. At the time of writing, German bund yields are close to unchanged as are most intra EMU-spreads. Greece outperforms (-3bps). Markets showed more interest in US data however. US Q2 GDP growth increased 4.1% QoQ (annualized). While markets expected a 4.2% rise, Q1 growth was revised upwardly. Amongst the contributors were strong(er than anticipated) personal consumption (2.69%), business investment (0.94%) and net exports (1.06%). Inventories were a drag (-1.0%). Price data came in mixed as Q2 core PCE disappointed somewhat (2.0% vs. 2.2% expected). The US yield curve bull flattened after the release with yield changes varying from -3 bps (10-yr) to -1 bp (2-yr). The more muted response at the short end of the curve suggests markets so far do not profoundly question the two additional hikes in 2018 as implied by the Fed’s dot plot.
This morning, EUR/USD continued trading with a negative bias, extending yesterday’s slide. Investors apparently didn’t want to be positioned short-USD going into the US Q2 GDP release. Even so, the EUR/USD decline maybe also included some underlying euro weakness. Yesterday’s relatively soft ECB guidance and disappointing Q2 French GDP growth were potential euro negatives, too. EUR/USD traded in the 1.1625 area going into the GDP release. The US Q2 GDP growth indeed printed strong at 4.1% Q/Qa. The release was close to expectations, but the composition of the report was strong. Price indicators were mixed. The reaction the dollar was modest, in line with interest rate markets. The USD currency even envisaged a small buy-the-rumour, sell-the-fact reaction. The pair trades currently in the 1.1650 area. USD/JPY is also losing modest ground after the release (US equities don’t profit). The pair is again trading in well-know-territory in the 111 area. To summarize: US GDP Q2 GDP growth was strong as expected. However, the FX market was already positioned for a strong report, causing a modest reaction.
Trading in sterling was mainly driven by technical considerations. Cable declined slightly this morning as the dollar rallied ahead of the Q2 GDP US GDP release. In this move sterling even outperformed the euro. The pair recovered however, now trading above opening levels. Press articles/market headlines elaborated in extenso on the EU rejecting PM May’s proposal on the future trade relationship between the EU and the UK. However, the direct impact on sterling trading remained limited with EUR/GBP changing hands in the 0.8885 area.
News Headlines
The ECB Survey of Professional Forecasters (July) indicates that eurozone inflation could accelerate faster than earlier thought, with headline inflation seen at 1.7% this year and in 2019 and 2020. The figures for 2018 and 2019 were upwardly revised from 1.5% and 1.6% respectively three months ago, supporting the ECB’s decision to start policy normalization. The forecast for 2020 was left unchanged.
For the first time since the Brexit referendum, British voters favoring a new referendum on the final terms of any Brexit deal are now in majority, a YouGov poll showed . In the event of a referendum on Britain’s EU membership, the view of most voters on leave/remain has not changed. They are also increasingly unhappy with PM May.
Swedish retail sales unexpectedly decreased in June (-1.8% m/m). A stabile number was expected after already a disappointing result in May (-0.1% m/m). Earlier this week, May unemployment rose 6.3% from 6.1%. The Swedish Crown suffered after the release. EUR/SEK rose about 0.5%. The pair is changing hands in the 9.30 area.
Strong Domestic and Foreign Demand Drove GDP Growth to 4.1% in the Second Quarter
The U.S. economy grew at a 4.1% annualized pace in the second quarter, largely in line with consensus expectation (4.2%) and our June forecast of 4.3% growth. A strong expansion in consumer spending, business investment and exports helped drive growth in the quarter.
Real personal consumer spending rose 4% in the quarter after rising just 0.5% in the first quarter (downwardly revised from 0.9% previously). Consumption strength was broadly based across goods and services.
Business investment rose 7.3%, which was stronger than anticipated. A robust increase in structures investment (+13.3%) for the second consecutive quarter helped, as did a firm expansion in intellectual property (+8.2%). Investment in mining exploration, shafts and wells (which includes the shale oil industry) was up 97% annualized, as drilling activity boomed in response to higher oil prices. Equipment investment growth slowed to 3.9% from the 9.4% average pace over the previous five quarters.
In addition to business investment, fiscal stimulus was also evident in a 3.5% gain in federal government expenditure in the quarter.
Residential investment declined 1.1% in the quarter, the second consecutive quarter of decline.
Net trade contributed a full percentage point to growth in the quarter, driven by a 9.3% rise in exports and a paltry 0.5% increase in imports. Part of this strength reflected a temporary spike in soybean and core shipments to beat out the imposition of tariffs from China. This factor alone added about 1 percentage point to growth in the quarter.
At the same time, with much of the agriculture shipments coming out of stockpiles, a decline in inventory investment shaved roughly an equal amount (about 1 percentage point) off growth in the quarter.
In addition to the usual update of benchmark data, the annual comprehensive revisions this time around included a rebasing of real GDP to 2012 prices, and changes to seasonal adjustment methodology in order to mitigate residual seasonality. Overall, these changes left annual average growth largely unaffected over the past five years, but the changes to the seasonal adjustment methodology altered quarterly growth profiles by up to a full percentage point.
Key Implications
As expected, the U.S. economy recorded tremendous growth in the second quarter. After such a strong performance, what comes next? Tax cuts and fiscal stimulus spending should continue to broadly support economic activity in the second half of the year. But, trade policy uncertainty has undoubtedly dented business confidence domestically and abroad, possibly leading businesses to delay further investment. As evidenced by the strong export numbers for agricultural commodities earlier in the quarter, tariffs have already acted to distort economic activity. Looking ahead, growth should remain near a 3.0% annualized pace in the second half of the year, but an escalation in trade tensions could push that estimate down.
Given the backward looking nature of the data, today's report is unlikely to persuade the Fed to alter its plans to gradually normalize monetary policy. We anticipate that the Fed will raise rates twice more this year, bringing the upper end of the target range to 2.5% in December.
Japanese Yen Gains Ground on Strong Inflation Report
The Japanese yen has posted slight gains in the Friday session. In the North American session, USD/JPY is trading at 111.00, down 0.23% on the day. On the release front, Tokyo Core CPI edged higher in July, posting a gain of 0.8%. This beat the forecast of 0.7%. In the U.S, Advance GDP gained 4.1% in the second quarter, just shy of the estimate of 4.2%. This marked the strongest quarter of economic growth since 2014. Later in the day the U.S releases Consumer Sentiment, which is forecast to drop to 97.1 points.
It’s been a quiet week for the yen and the trend has continued in Friday trade. There was good news on the inflation front, as Tokyo Core CPI improved to 0.8%, its strongest gain in four months. Earlier, in the week, Services Producer Price Index improved for a third straight month, jumping to 1.2% in June. This beat the estimate of 1.0% and marked the strongest gain since March 2015. At the same time, BoJ Core Inflation, the BoJ’s preferred inflation indicator, dipped to 0.4%, its smallest gain since in 11 months. The Bank of Japan has stubbornly held to its inflation of target of just under 2.0%, but this goal remains elusive. The markets are not expecting any significant changes to the BoJ’s ultra-accommodative monetary policy until inflation levels move higher.
The U.S economy keeps on humming, and Friday’s Advance GDP for the second quarter reflected this, with an excellent gain of 4.1%. This is much higher than the 2.2% gain recorded in the first quarter. This reading was within market expectations, so the dollar wasn’t able to gain ground. Strong economic numbers have kept the U.S currency at high levels, despite recent remarks by President Trump saying that the dollar is too high and is hampering exports. These comments have weighed on the dollar, but usually for a brief time only, as the performance of the economy has talked louder than Trump’s tweets.
EURUSD Outlook: Ticks Higher after US Data But Risk Remains Skewed Lower
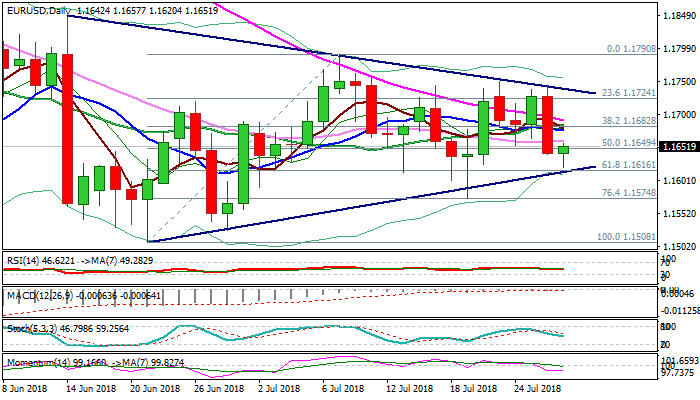
The Euro was higher in post-data 1.1620/50 advance, after US GDP came in line with expectations (4.1%) with previous release being upward-revised from 2.0% to 2.2%. Fresh dollar's weakness could be explained as disappointment of traders who expected stronger figure, but it looks like short-lived action as EURUSD's overall picture is bearish and bounce could be seen as positioning for fresh push lower on likely ‘buy rumor -sell fact' scenario. The price remains under the base of thick daily cloud (1.1680) reinforced by plethora of daily MA's, which is expected to cap upticks and keep bearish stance (also reinforced by negative momentum) intact. Bears need close below triangle support (1.1616) to confirm continuation and unmask next supports at 1.1574 and 1.1527. Stronger rally and close within the cloud is needed to neutralize immediate downside risk.
Res: 1.1662; 1.1680; 1.1718; 1.1741
Sup: 1.1616; 1.1574; 1.1527; 1.1508
Forex Price Action Techniques -Trading the Doji Candlestick
Forex price action, as one might have guessed now is a rather broad term and is, in fact, an umbrella term with various approaches involved to trading with forex price action. In this article, we will outline a few forex price action techniques that are independent of your trading strategies or analysis but bound to help you improve or add confidence to your trade entry and exits. We make use of the Doji candlestick pattern which is one of the most commonly occurring candlestick price action setup.
The Doji Candlesticks
The Doji candlesticks are unique with their small or near flat body with long wicks on both the top and bottom and is one of the distinctive forex price action candlestick patterns that are formed. The Doji candlestick pattern, as we know denotes market indecision. Buyers are unwilling to push prices higher while sellers are unwilling to push price lower. Doji candlestick patterns are a great way to trade and can be very useful especially in the context of understanding what the market is doing.
Forex Price Action – Trading off Doji Support & Resistance
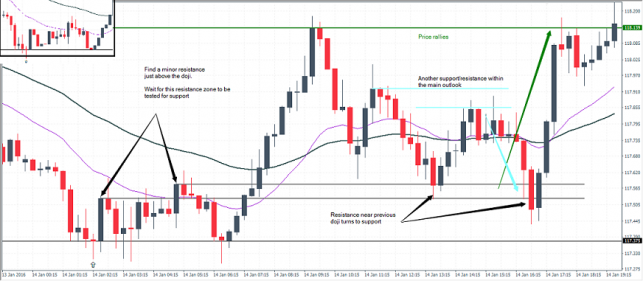
Conventional forex price action wisdom tells us that a Doji candlestick at the top or bottom of a strong trend signals a possible reversal. However, taken at face value, this nugget of wisdom can be disastrous. The first chart below shows the Doji candlestick being formed. However, notice how price repeatedly kept dipping back to the doji’s zone. For an inexperienced trader, taking a position at this doji set up would have resulted in getting their stop losses being hit repeatedly. Instead, identify a near-term support or resistance after the Doji is formed. Then wait for that support or resistance to flip and go long or short accordingly.
The chart below illustrates this example including a minor doji setup that was also formed.
forex price action
Forex Price Action – Doji trading method #1
Forex Price Action – Trading the doji high/low break
A second way to trade the Doji candlestick pattern with forex price action is to buy or sell on the break (with a closing price) above the high or the low of the Doji candlestick pattern, in the context of the trend. The chart below illustrates this second method.
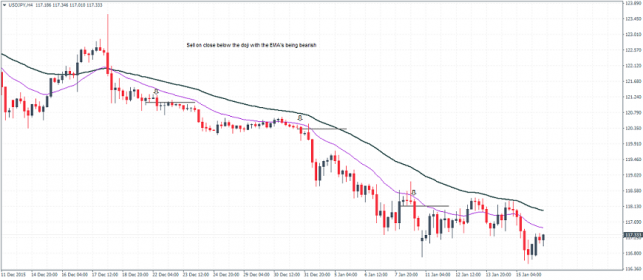
Selling on close below doji low
In the above chart, we have the EMA’s bearish. Price action shows various instances of the Doji candlestick pattern being formed. Taking a short position on the ‘close’ below the doji’s low within one or two candles shows a great way to trade the trend. Stops, in this method, are placed only on a closing price above the Doji high. In the second sell set up, notice how price spiked above the previous doji high but closed lower. Traditional stops would have been hit in what could have been a great trade ahead.
The next chart below shows a buy signal based on the doji’s high/low method.
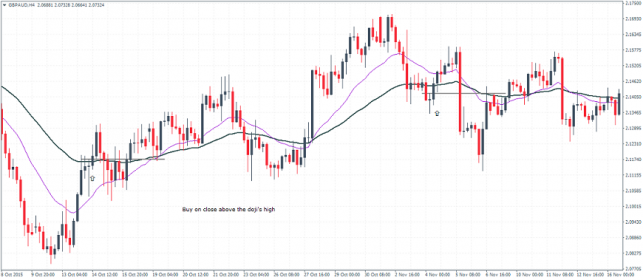
Buying on close above doji high
In the above chart, we have two examples of buying above the doji’s high on a close. To the left, the first forex price action signal shows a long entry. Note how prices continue to chop around near the doji’s low but prices never close below the doji’s low. Eventually, price action moves higher in a strong rally. The second example is one which shows a near text-book example with price closing above the doji’s high on the next candle resulting in a fairly decent price action movement to the upside.
Forex Price Action – Improving with doji candlestick patterns
The two methods outlined above are just one of the many examples for traders who want to experiment with trading forex price action. It is not only simple but also helps traders to be more confident in taking their trade setups.
ECN Forex Trading Explained
Trade execution usually doesn’t rank that high for most traders, especially in the retail forex business. That being said, the past few years has brought about some market volatility which has no doubt increased trader’s curiosity about how their trades are executed by their forex broker.
The most notable event which made an impact was last year’s (2015) Swiss Franc de-peg which saw quite a few retail traders either swallowing huge losses or making the biggest wins in a day. It also brought down quite a few forex brokerages including a few reputable ones as well. The Swiss Franc event in 2015 thus set forward period of awareness among traders as to how their trades are executed by their forex brokerages and, of course, brought the spotlight on whether it is best to trade with a market maker or an ECN/STP forex broker.
But what exactly is an ECN forex broker? In this article, we explain in detail what an ECN is and how your trades are executed by the broker.
ECN Forex Trading – The Network
ECN is an acronym for Electronic Communications Network. It is not to be mistaken with some kind of an intranet/extranet but merely a protocol that is adopted by forex brokerages are their liquidity partners for executing trades. ECN brokers primarily act as ‘Middle Men‘ (and thus the named broker) between the liquidity partners made up of banks and large institutions and the retail/trading community. The trades placed by the trades are routed directly and matched with the liquidity providers and when there is a matching order, the trade is executed. Of course, all of this happens in real time and hardly noticeable.
With an ECN forex broker, traders should know that the other side of their trade (also known as a counterparty) is made up of either one or a pool of institutional orders. The broker does not get involved as a counterparty but merely passes on their retail customer’s orders. Of course, the ECN broker does this for a small fee. This fee could either be in the form of charging a commission per trade or by adding a markup to the orders by a few pips.
ECN Forex Trading Vs. Market Making
As you might have understood by now, ECN forex trading is perhaps one of the simplest ways to do business as a forex broker. Unlike a market making a model where client’s trades are always accepted in-house which opens up the question on ‘conflict of interest’ between the brokerage and their customer. When the customer losses, the brokerage wins and vice versa (although this is not always the case as orders can also be routed differently with a market maker).
However, the point to understand here is the fact that with a market maker, there is a higher chance that your orders will be filled at the price you want to bid or ask at. This changes when it comes to an ECN forex broker where the order execution depends on whether the counterparty wants to accept your bid or ask at the price level you quoted. In other words, while an ECN forex broker can offer fast executions if the counterparty does not match your bids or asking prices, chances are that your orders remain unfilled.
And this was something which happened last year during the SNB event where, when the Swiss National Bank gave up the 1.20EURCHF floor, there were no orders below 1.20 leaving a large void and thus traders ended up with trades, where they were unable to defend it with stop loss orders. On the other hand, market makers managed to fare better given the fact that the order routing was different.
ECN Forex Trading – Is it good or bad?
There is no right answer to this question and more importantly, the answer can vary from one trader to another. The fact remains however that for traders who prefer to trade big and quick, an ECN forex broker can be the best match as commissions or spreads can be lowered especially if you bring big volume to your broker. On the other hand, traders who merely trade part time and are not very aware of the market risks are better off trading with a market maker instead.
EUR/USD Mid-Day Outlook
Daily Pivots: (S1) 1.1682; (P) 1.1711 (R1) 1.1758; More.....
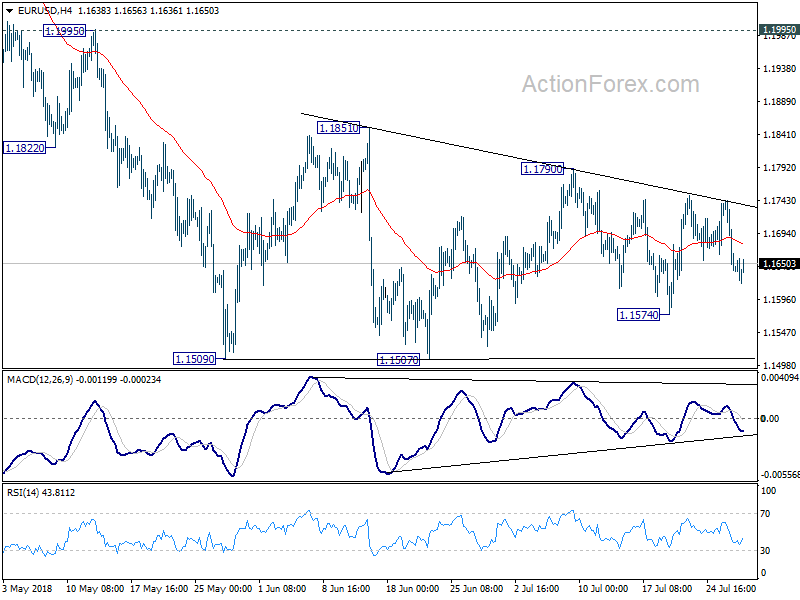
EUR/USD is still struggling in range above 1.1507 as consolidation is probably extending. Intraday bias remains neutral at this point. In case of stronger recovery, upside should be limited by 1.1851 resistance to bring fall resumption eventually. On the downside , firm break of 1.1507 will resume larger down trend through 50% retracement of 1.0339 to 1.2555 at 1.1447.
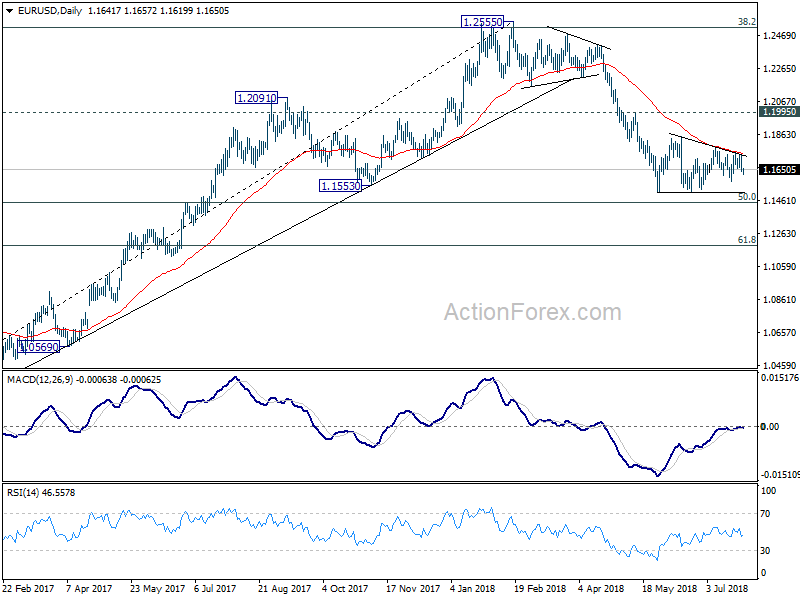
In the bigger picture, EUR/USD was rejected by 38.2% retracement of 1.6039 (2008 high) to 1.0339 (2017 low) at 1.2516. And, a medium term top was formed at 1.2555 already. Decline from there should extend further to 61.8% retracement of 1.0339 to 1.2555 at 1.1186 and below. For now, even in case of rebound, we won't consider the fall from 1.2555 as finished as long as 1.1995 resistance holds.
GBP/USD Mid-Day Outlook
Daily Pivots: (S1) 1.3071; (P) 1.3143; (R1) 1.3180; More...
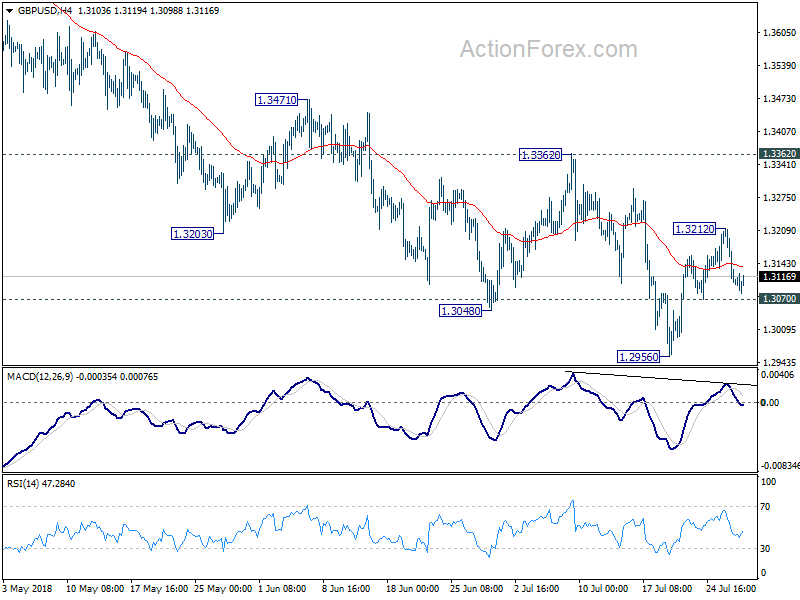
Intraday bias in GBP/USD remains neutral for the moment. On the downside, break of 1.3070 minor support will indicate completion of rebound form 1.2956 and turns bias back to the downside for this low. Firm break there will resume larger decline from 1.4376 for 1.2874 fibonacci level next. On the upside, above 1.3212 will bring another rebound. But after all, price actions from 1.2956 are seen as a correction. Hence, upside should be limited by 1.3362 resistance to bring larger decline resumption eventually.
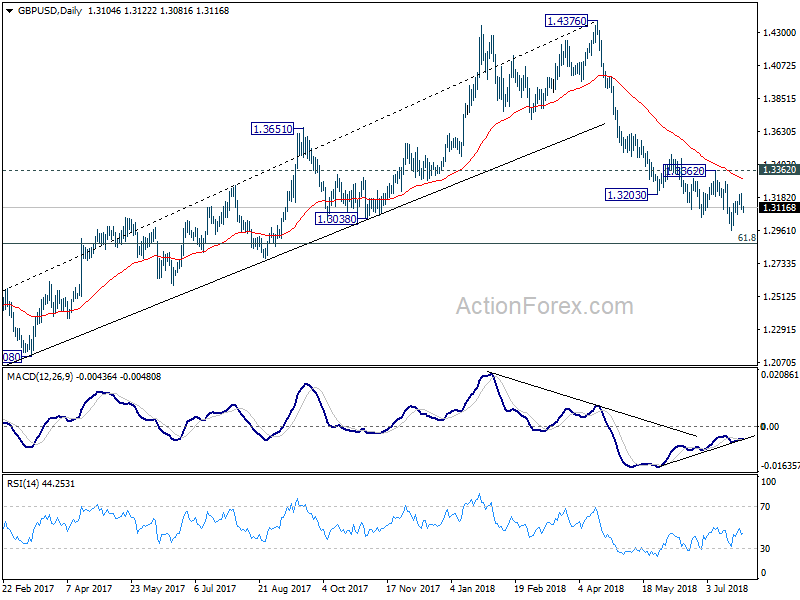
In the bigger picture, whole medium term rebound from 1.1946 (2016 low) should have completed at 1.4376 already, after rejection from 55 month EMA (now at 1.4179). Fall from 1.4376 should extend to 61.8% retracement of 1.1946 (2016 low) to 1.4376 at 1.2874 next. Decisive break of 1.2874 will raise the chance of long term down trend resumption through 1.1946 low. On the upside, break of 1.3362 resistance is needed to be the first indication of medium term bottoming. Otherwise, outlook will remain bearish even in case of strong rebound.
USD/JPY Mid-Day Outlook
Daily Pivots: (S1) 110.80; (P) 111.02; (R1) 111.46; More...
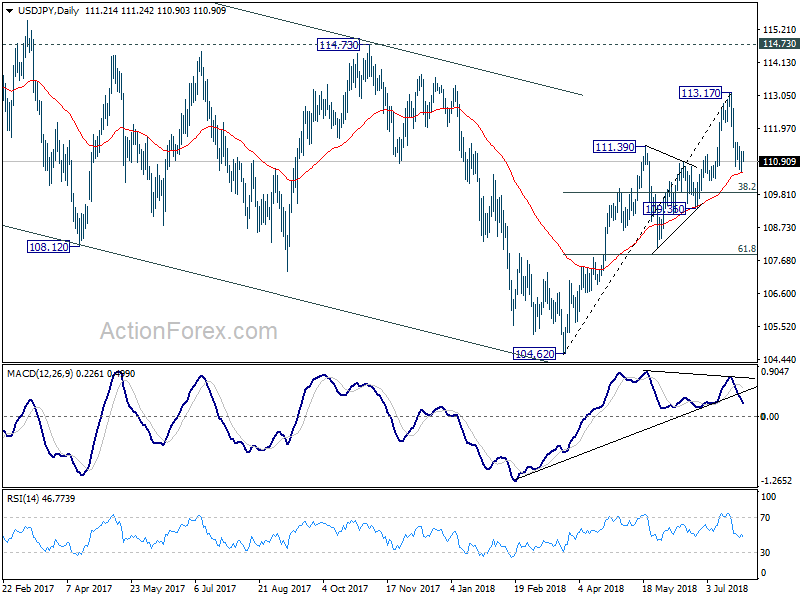
USD/JPY is still staying in tight range above 110.58 temporary low. Intraday bias stays neutral. Also, with 111.53 minor resistance intact, the corrective fall from 113.17 could extend lower. But downside should be contained by 38.2% retracement of 104.62 to 113.17 at 109.90 to bring rebound. On the upside, break of 111.53 minor resistance will turn bias to the upside for retesting 113.17 high first.
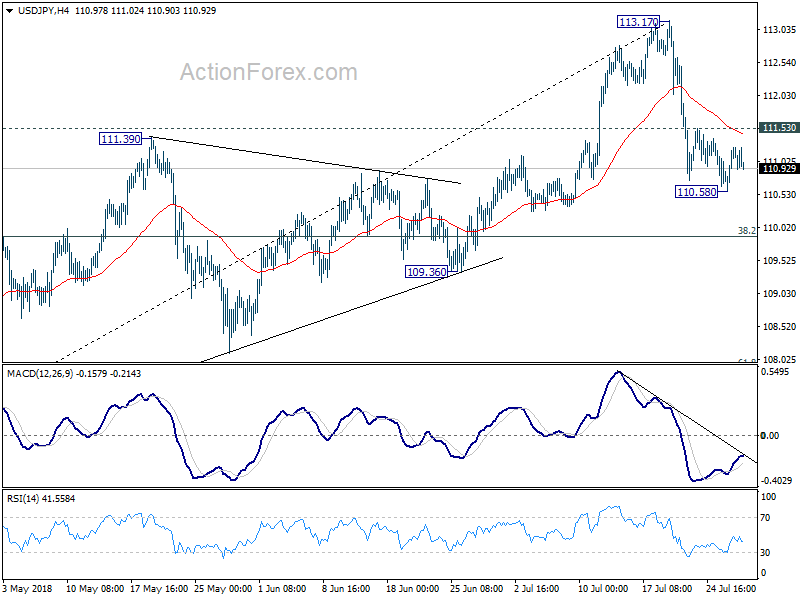
In the bigger picture, corrective fall from 118.65 (2016 high) should have completed with three waves down to 104.62. Decisive break of 114.73 resistance will likely resume whole rally from 98.97 (2016 low) to 100% projection of 98.97 to 118.65 from 104.62 at 124.30, which is reasonably close to 125.85 (2015 high). This will stay as the preferred case as long as 109.36 support holds.