Sample Category Title
DAX Climbs To 5-Week Highs As ECB Says No Rate Hikes On Horizon
The DAX index is slightly higher in the Friday session, continuing the upward trend seen on Thursday. Currently, the DAX is at 12,844, up 0.27% on the day. On the release front, the sole event is German Import Prices. The indicator dropped 0.5% in June, down sharply from the 1.6% gain a month earlier. Still, this beat the estimate of 0.5%. The U.S will release Advance GDP for Q2, with the markets expecting a strong gain of 4.2%.
It was more of the same from the ECB, which maintained its monetary policy at its Thursday policy meeting. The main refinancing rate remained at 0.0%, where it has been pegged since January 2016. In a policy statement, policymakers reiterated that rates would remain at current levels “through the summer of 2019”, and “as long as necessary to boost inflation to the target of just under 2.0%. There has been some quibbling among analysts as to the exact meaning of “through the summer”, but what is clear is that the ECB plans to keep rates at a flat 0.00% after winding up its bond-purchase scheme at the end of the year. Low interest rates are bullish for stocks, and the DAX responded with gains on Thursday after the ECB statement. Still, a rate hike seems likely sometime in 2019. The exact timing of a rate increase will depend on the strength of the eurozone economy and inflation levels – if the second half of 2018 is marked by stronger growth and higher inflation, there will be pressure on the ECB to raise rates earlier rather than later in 2019.
It’s been an excellent week for the DAX, which has climbed 2.6% and is at its highest level since mid-June. Market sentiment improved on Thursday on Wednesday, after a meeting between EU Commission President Jean-Claude Juckner met with President Trump went better than expected. The two leaders agreed to take concrete steps to eliminate tariffs and improve the trade relationship between the U.S and the EU, which has been battered in recent weeks. President Trump agreed to hold back on any further tariffs while talks are ongoing. This is a major concession from Trump, who just last week had threatened to impose tariffs on European car imports. U.S tariffs on European aluminum and steel will remain in place, but Juckner pointed out that the U.S has agreed to reassess these measures. The surprise agreement triggered strong gains in bank and automakers shares on the DAX, boosting the index. With fears of a full-blown transatlantic trade war easing, the markets are hoping that the conciliatory tone shown by the Trump administration with the Europeans will extend to China as well.
The Analytical Overview Of The Main Currency Pairs
The EUR/USD currency pair
Technical indicators of the currency pair:
Prev Open: 1.17297
Open: 1.16417
% chg. over the last day: -0.72
Day's range: 1.16424 – 1.16572
52 wk range: 1.0571 – 1.2557
Yesterday, there were aggressive sales on the EUR/USD currency pair. The ECB left the key interest rate unchanged at 0.00%, which hit the euro. Quotes fell by more than 80 points. At the moment, the technical pattern is ambiguous. The key support and resistance levels are 1.16350 and 1.16650, respectively. We recommend opening positions from these marks.
The news feed on 2018.07.27:
Data on the US GDP at 14:45 (GMT+3:00).
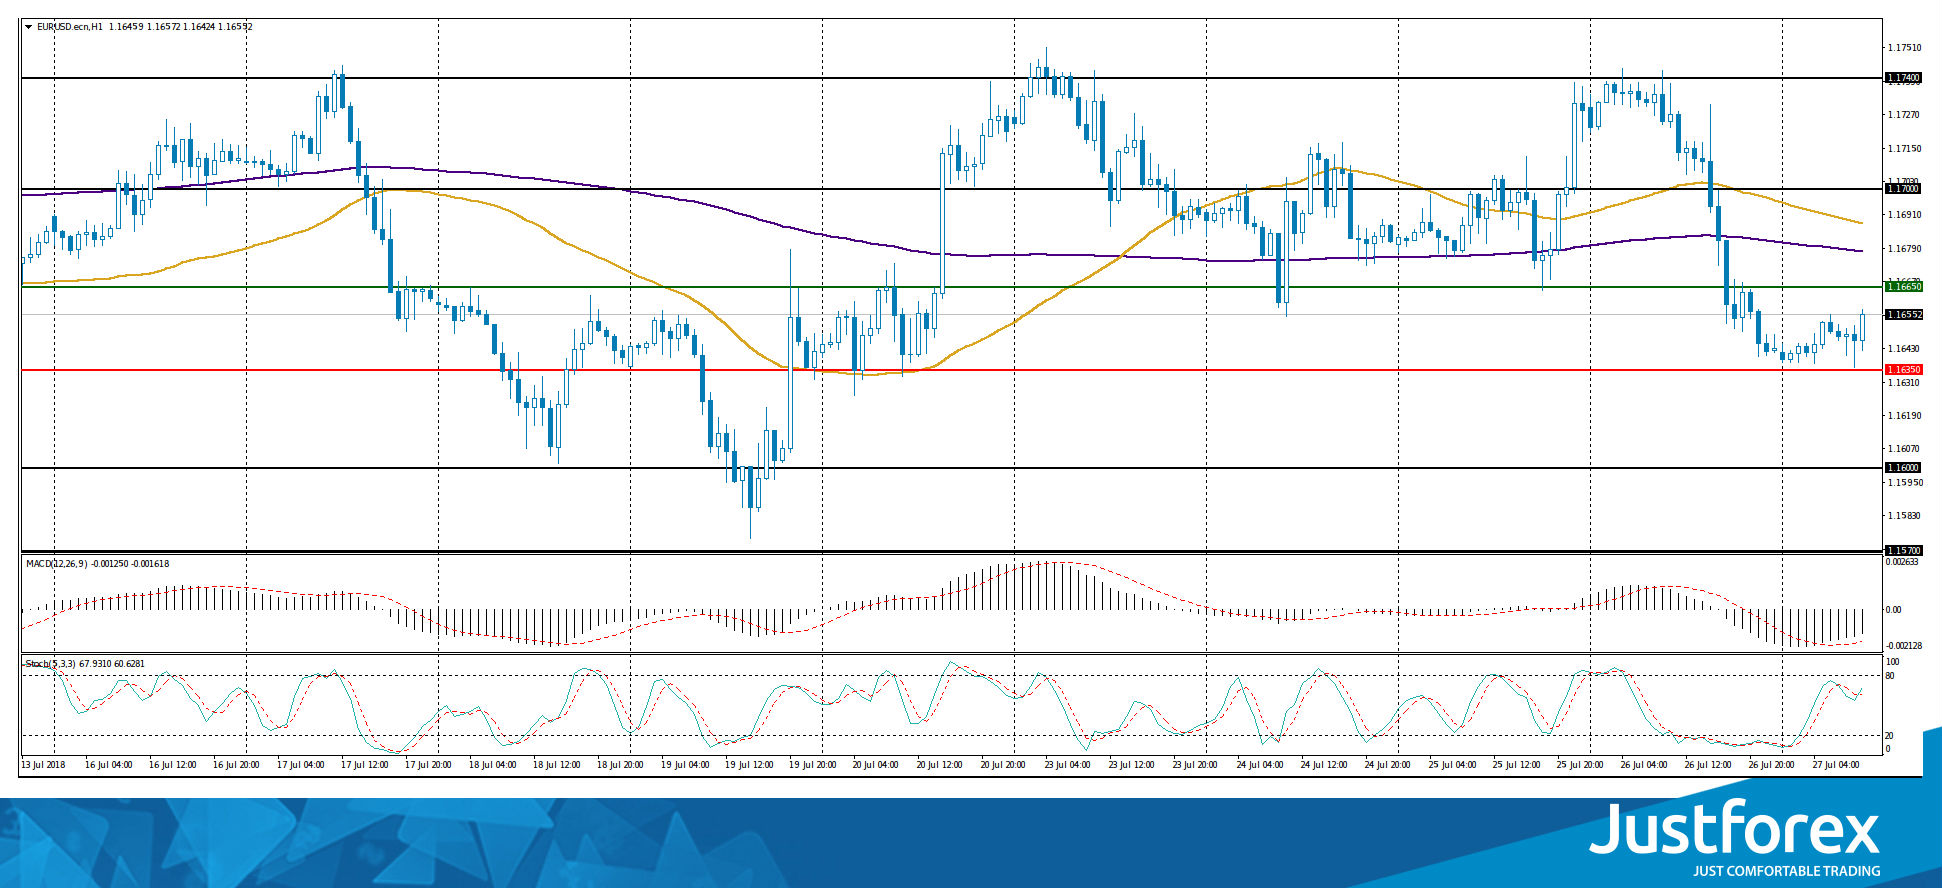
Indicators point to the power of sellers: the price has fixed below 50 MA and 200 MA.
The MACD histogram is located in the negative zone, but above the signal line, which gives a weak signal to sell EUR/USD.
Stochastic Oscillator is in the neutral zone, the %K line crossed the %D line. There are no accurate signals.
Trading recommendations
Support levels: 1.16350, 1.16000, 1.15700
Resistance levels: 1.16650, 1.17000, 1.17400
If the price fixes below 1.16350, we recommend considering sales of EUR/USD. The movement is tending to 1.16000-1.15700.
Alternative option. If the price fixes above the resistance level of 1.16650, the EUR/USD quotes are expected to rise. The movement is tending potentially to 1.17000-1.17200.
The GBP/USD currency pair
Technical indicators of the currency pair:
Prev Open: 1.31887
Open: 1.31075
% chg. over the last day: -0.61
Day's range: 1.31013 – 1.31102
52 wk range: 1.2361 – 1.4345
Yesterday, the bearish sentiment was observed on the GBP/USD currency pair. The decrease in quotes was more than 80 points. At the moment, the technical pattern is ambiguous. Investors expect additional drivers. Local support and resistance levels are 1.30900 and 1.31300, respectively. The positions should be opened from these marks. The trading instrument has the potential for further reduce.
Today, the publication of important news from the UK is not expected.
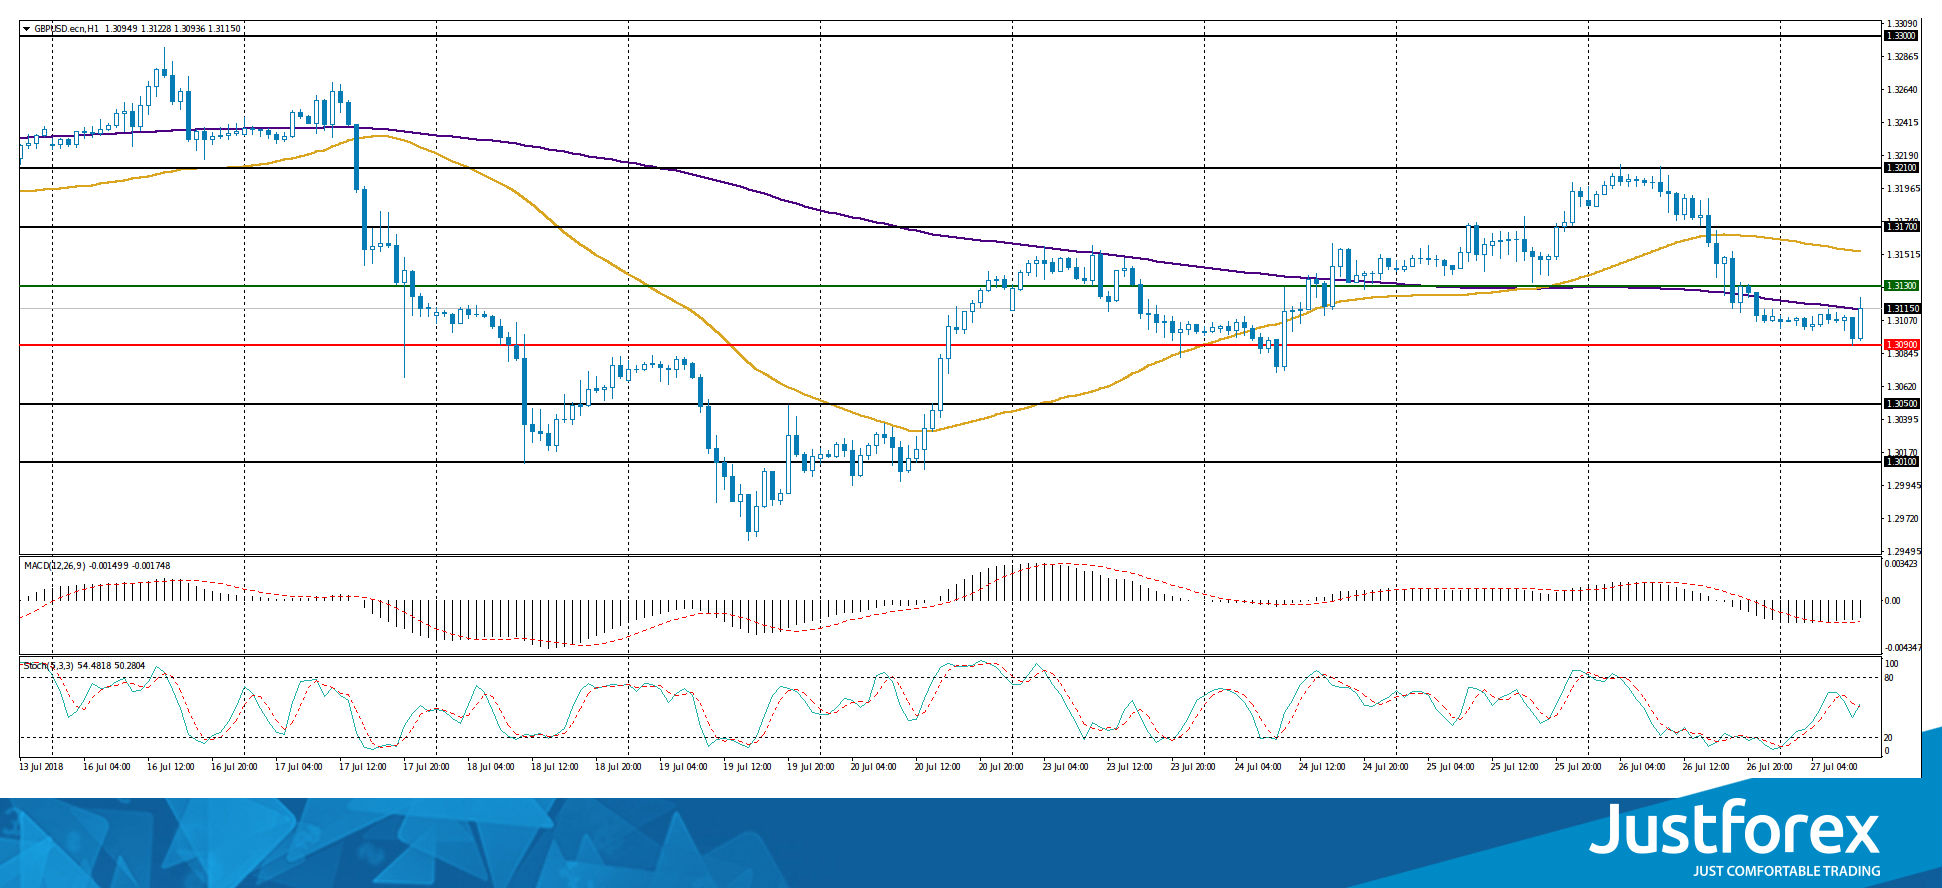
Indicators do not send accurate signals: the price is testing 200 MA.
The MACD histogram is in the negative zone, but above the signal line, which gives a weak signal to sell GBP/USD.
Stochastic Oscillator is located in the neutral zone, the %K line crossed the %D line. There are no accurate signals.
Trading recommendations
Support levels: 1.30900, 1.30500, 1.30100
Resistance levels: 1.31300, 1.31700, 1.32100
If the price fixes above 1.31300, the GBP/USD currency pair is expected to correct. The movement is tending to 1.31700-1.31900.
Alternative option. If the price fixes below the support of 1.30900, we recommend considering sales of GBP/USD. The movement is tending to 1.30500-1.30300.
The USD/CAD currency pair
Technical indicators of the currency pair:
Prev Open: 1.30451
Open: 1.30708
% chg. over the last day: +0.18
Day's range: 1.30706 – 1.30784
52 wk range: 1.2059 – 1.3795
Yesterday, the bullish sentiment was observed on the USD/CAD currency pair. The growth of quotes was restrained due to a weak report on core durable goods orders in the US. The indicator counted to 0.4% in June, while investors expected a value of 0.5%. At the moment, the trading instrument is moving in the range of 1.30450-1.30800. Positions should be opened from the key support and resistance levels.
The news feed on the economy of Canada is calm.
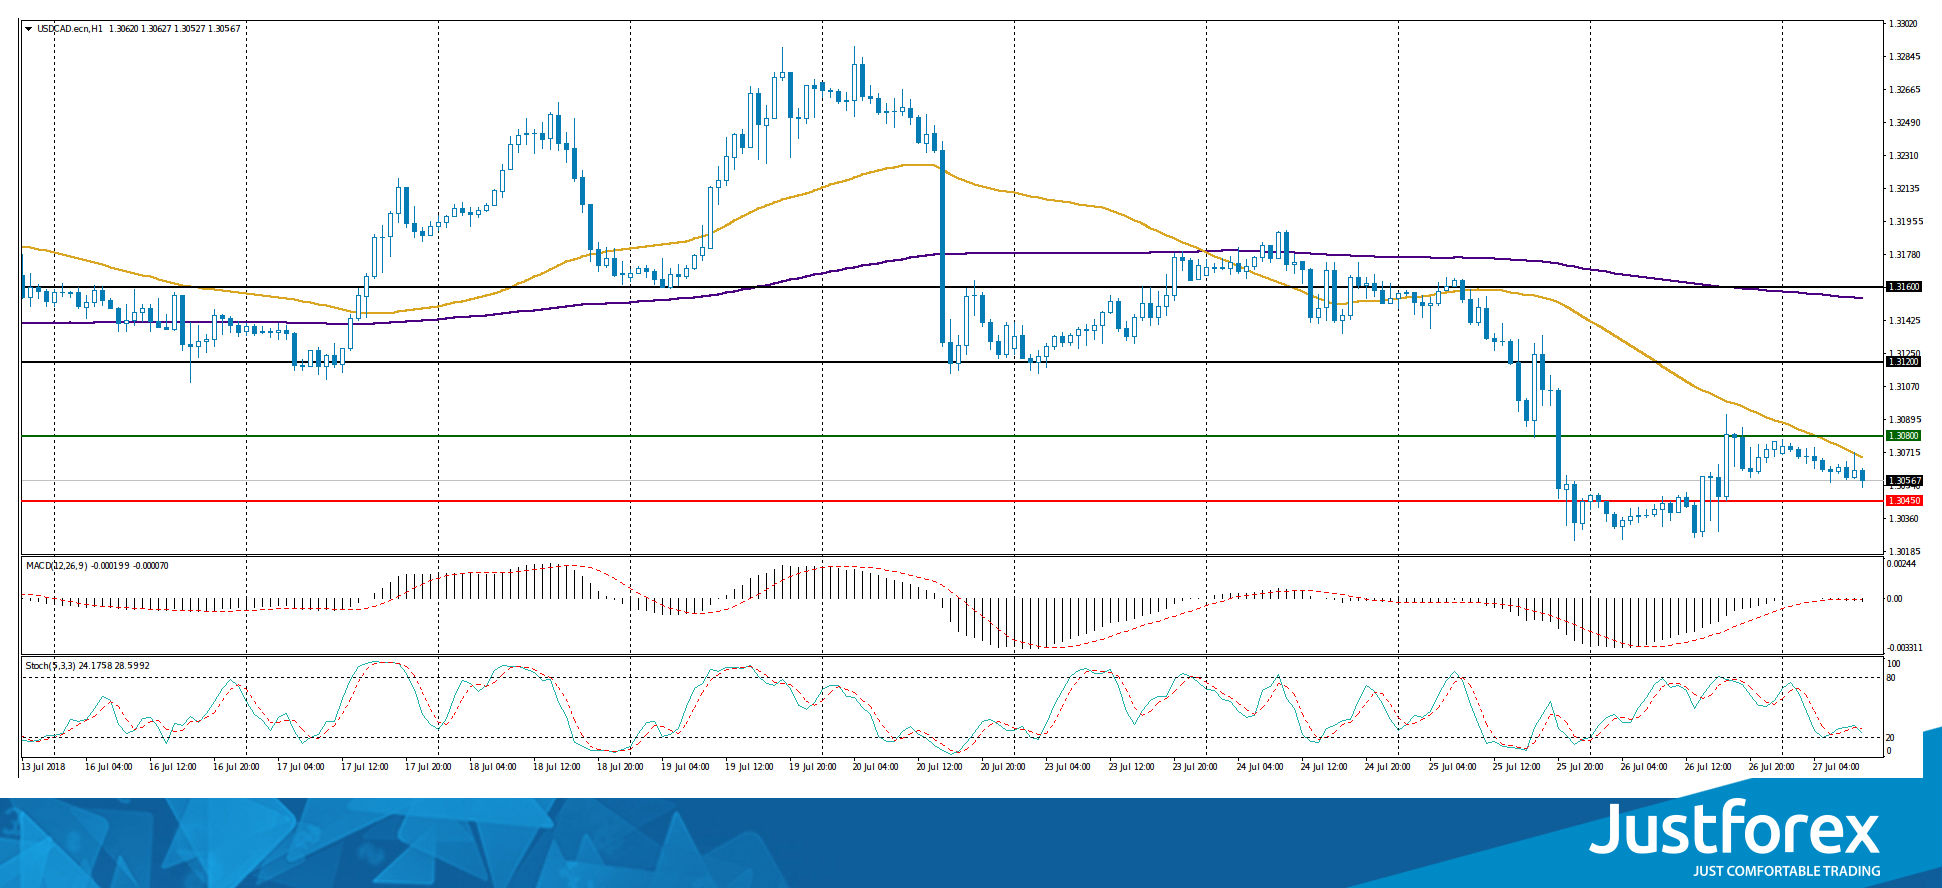
Indicators point to the power of sellers: the price has fixed below 50 MA and 200 MA.
The MACD histogram is near the 0 mark. There are no signals.
Stochastic Oscillator is in the neutral zone, the %K line is crossing the %D line. There are no signals at the moment.
Trading recommendations
Support levels: 1.30450, 1.30000
Resistance levels: 1.30800, 1.31200, 1.31600
If the price fixes below the support level of 1.30450, we recommend considering sales of USD/CAD. The movement is tending to 1.30000-1.29800.
If the price fixes above the 1.30800 mark, it is necessary to look for entry points to the market to open long positions. The target movement level is 1.31200-1.31400.
The USD/JPY currency pair
Technical indicators of the currency pair:
Prev Open: 110.974
Open: 111.219
% chg. over the last day: +0.17
Day`s range: 110.940 – 110.054
52 wk range: 104.56 – 114.74
Yesterday, there was the bullish sentiment on the USD/JPY currency pair. At the moment, the technical pattern is ambiguous. Investors expect additional drivers. The key support and resistance are 110.900 and 111.200, respectively. The positions should be opened from these marks.
The news feed on the economy of Japan is calm.
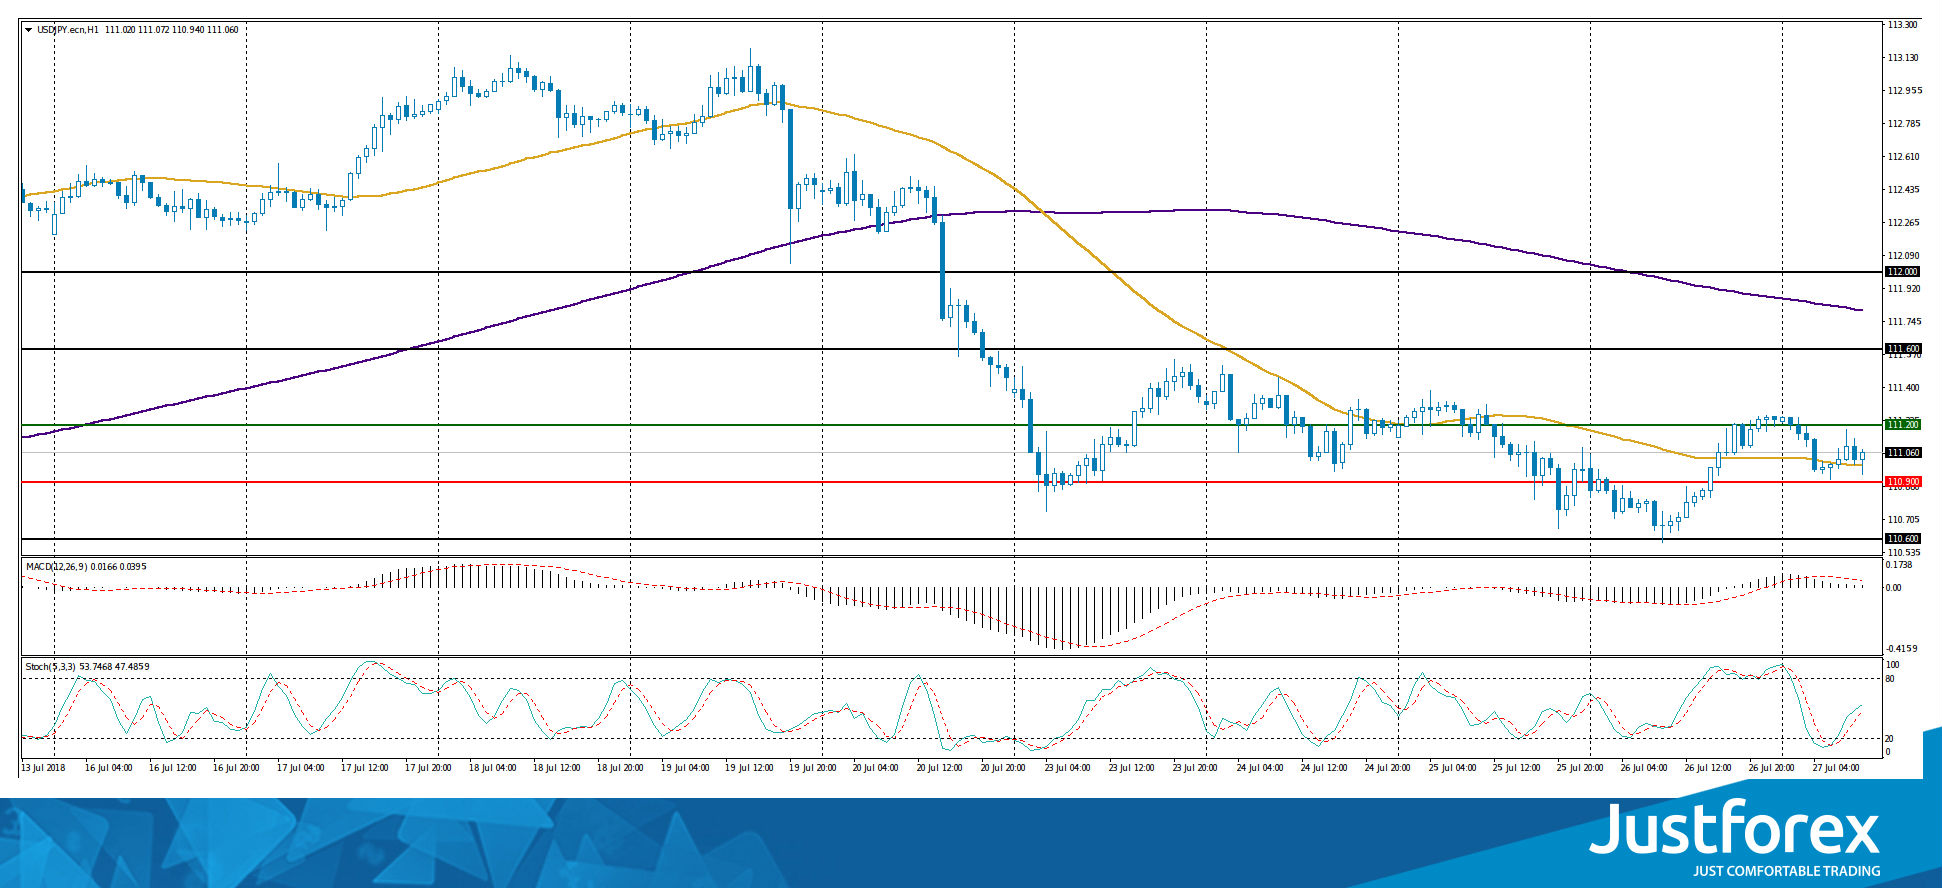
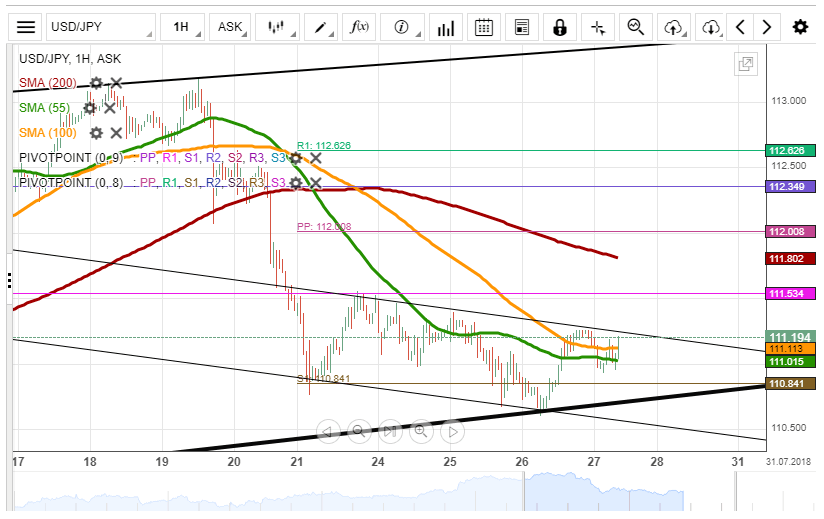
Indicators do not send accurate signals: the price is testing 50 MA.
The MACD histogram is in the positive zone, but below the signal line, which gives a weak signal to buy USD/JPY.
Stochastic Oscillator is located in the neutral zone, the %K line is above the %D line, which indicates the growth of quotes.
Trading recommendations
Support levels: 110.900, 110.600
Resistance levels: 111.200, 111.600, 112.000
If the price fixes below the already "mirror" support of 110.900, the USD/JPY currency pair is expected to decline. The movement is tending to 110.600-110.300.
Alternative option. If the price fixes above 111.200, it is necessary to consider purchases of USD/JPY. The movement is tending to 111.600-111.800.
Demand For The US Dollar Has Resumed
The US currency strengthened against the basket of major currencies after negotiations between President of the European Commission Jean-Claude Juncker and the US President Donald Trump. As it became known, the US and the European Union agreed to abolish trade duties for each other in order to avoid a trade war. The US dollar index (#DX) started rising and closed in the positive zone (+0.47%).
Nevertheless, the growth of the US dollar was restrained due to a weak report on core durable goods orders. The indicator counted to 0.4% in June, while investors expected a value of 0.5%. The euro was under pressure after it became known that the interest rate remained unchanged at the level of 0.00%. The ECB President Mario Draghi said that the Eurozone economy needs financial stimulation. The ECB representatives intend to leave the interest rate unchanged until the end of the summer of 2019.
The "black gold" prices are consolidating. At the moment, futures for the WTI crude oil are testing a mark of $69.45 per barrel.
Market Indicators
Yesterday, there was a variety of trends in the US stock market: #SPY (-0.24%), #DIA (+0.43%), #QQQ (-1.52%).
At the moment, the 10-year US government bonds yield is at the level of 2.96-2.97%.
The news feed on 2018.07.27:
Data on the US GDP at 14:45 (GMT+3:00).
Forex Technical Analysis: EUR/USD, USD/JPY, GBP/USD
EUR/USD
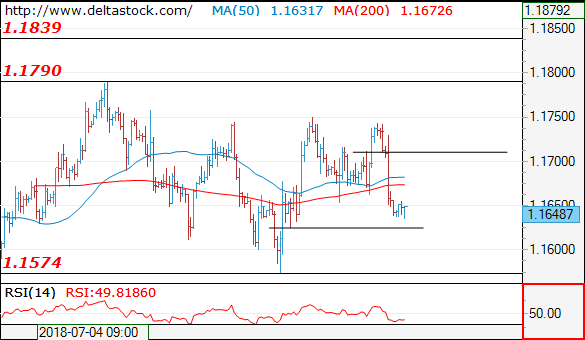
Current level - 1.1648
The slide below 1.1710 has neutralized the bullish outlook and the bias is bearish, for a test of 1.1625 static support. A rebound above 1.1660 will reinstate the positive outlook for 1.1790.
| Resistance | Support | ||
| intraday | intraweek | intraday | intraweek |
| 1.1660 | 1.1750 | 1.1625 | 1.1510 |
| 1.1750 | 1.1830 | 1.1570 | 1.1300 |
USD/JPY
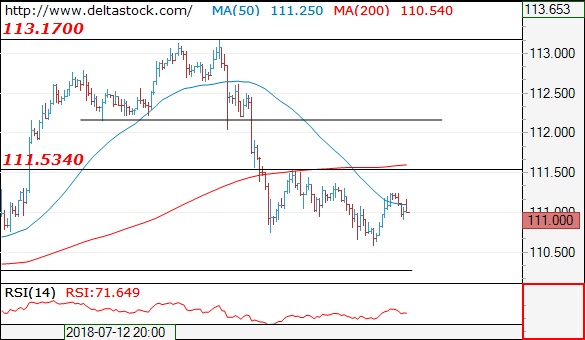
Current level - 111.00
The rebound above 111.10 has neutralized the negative bias and the intraday situation here is neutral.
| Resistance | Support | ||
| intraday | intraweek | intraday | intraweek |
| 111.50 | 114.50 | 110.25 | 110.25 |
| 112.10 | 114.50 | 109.30 | 109.30 |
GBP/USD
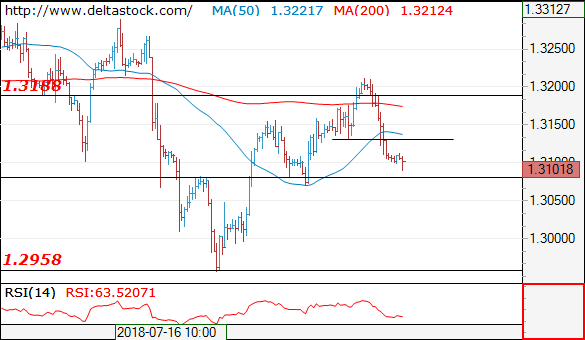
Current level - 1.3101
My outlook is counter-trend against 1.3080, for another upswing, towards 1.3300.
| Resistance | Support | ||
| intraday | intraweek | intraday | intraweek |
| 1.3130 | 1.3460 | 1.3080 | 1.2960 |
| 1.3300 | 1.3620 | 1.2960 | 1.2770 |
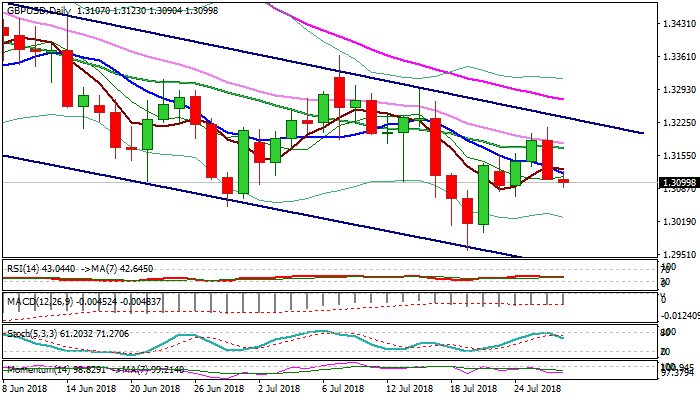
GBPUSD Outlook: Thursday’s Bearish Outside Day Signals Further Weakness
Cable remains in red on Friday after suffering heavy losses on fall from 1.3213 to 1.3105 on Thursday. Fresh bearish extension of pullback from 1.3213 (after recovery failed to clearly break above pivotal Fibo 61.8% of 1.3362/1.2957 fall barrier) probes below 1.31 handle and pressures pivots at 1.3085/71 (50% of 1.2957/1.3213 rally/4-hr cloud base/24 July trough). Thursday's bearish outside day adds to negative outlook on negative setup of daily techs. Close below cracked weekly 100SMA (1.3078) is needed to confirm bearish continuation and expose psychological 1.30 level and key support at 1.2957 (19 July low, the lowest since Aug 2017). Broken daily Tenkan-sen marks initial resistance at 1.3113, with broken Kijun-sen (1.3160) expected to cap stronger upticks and maintain bearish stance.
Res: 1.3113, 1.3160, 1.3180, 1.3213
Sup: 1.3085, 1.3071, 1.3055, 1.3000
EUR/USD Expected To Fall
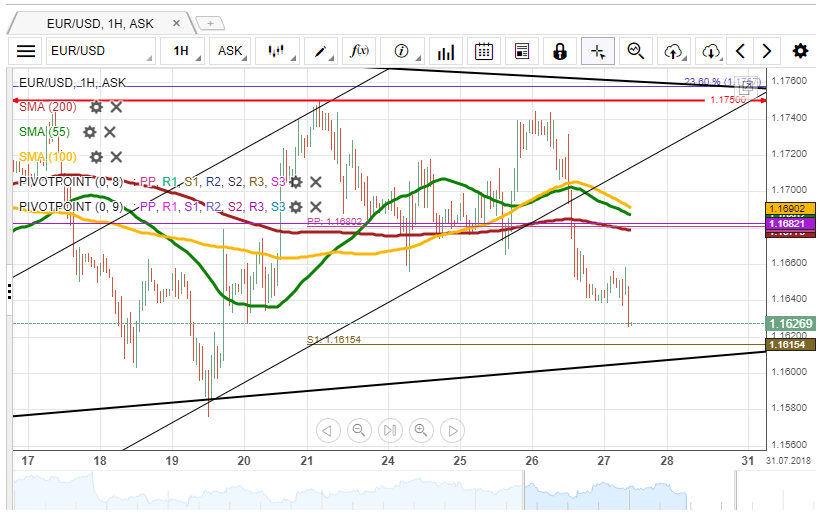
The Euro lost 95 pips against the US Dollar on Thursday. The pair started falling considerably following a breakout from the 55-, 100– and 200-hour SMAs around the 1.17 mark.
This fall stopped suddenly near 1.1640 around which the Euro was fluctuating on Friday morning, as well. This plunge has sent technical indicators in the oversold territory on the 1H time-frame. However, there is still apparent some downside potential on the 4H chart that could result in bears gaining control in the market once again and testing the senior triangle line and the weekly S1 at 1.1615.
In terms of resistance, it is unlikely that the rate gains enough bullish momentum to dash through the 1.1680 territory which is limited by the weekly PP and the 55-, 100– and 200-period SMAs on both the 1H and 4H charts.
Professionals revised up inflation forecast in ECB survey
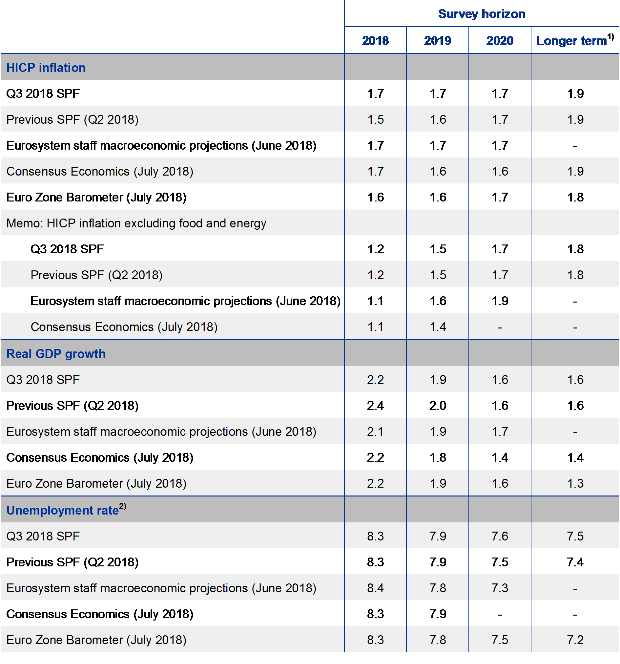
ECB released the latest Survey of Professional Forecasters (SPF) today. On Eurozone inflation, SPF respondents raised their headline HICP inflation forecast to 1.7% in 2018 (from 1.5%) , 1.7% in 2019 (from 1.6%) and 1.7% in 2010 (unchanged). They now matched Eurosystem staff projection of 1.7% through 2018 to 2020.
On Core HICP inflation, SPF projections were unchanged at 1.2% in 2018, 1.5% in 2019 and 1.7% in 2020. That compares to Eurosystem staff forecasts of 1.1% in 2018, 1.6% in 2019 and 1.9% in 2020. That is, SPF respondents expect faster pickup in core inflation in 2018 but the slowed the rise slows quickly.
On growth, SPF respondents revised down GDP forecast to 2.2% in 2018 (from 2.4%), 1.9% in 2019 (from 2.0%) and 1.6% in 2020 (unchanged). That compares to Eurosystem staff projections of 2.1% in 2018, 1.9% in 2019 and 1.7% in 2020.
Majority of British voters want a referendum on the final Brexit deal
According to a YouGov poll for the Times, 42% British voters would like to have a referendum on the final terms of Brexit deal with the EU. Only 40% said there should not be, and the rest didn't know.
Among the votes, 58% of labor supporters, 67% of Lib-dem supporters and 21% of Conservative supported wanted a second referendum on the terms.
In the event of another referendum on Brexit tomorrow, 45% said they would vote to remain, 42% would vote to leave, 4% wouldn't vote and 9% said they didn't know.
It's a poll of 1653 adults in the UK conducted on Wednesday and Thursday this week.
GBP/USD Falls Below SMAs
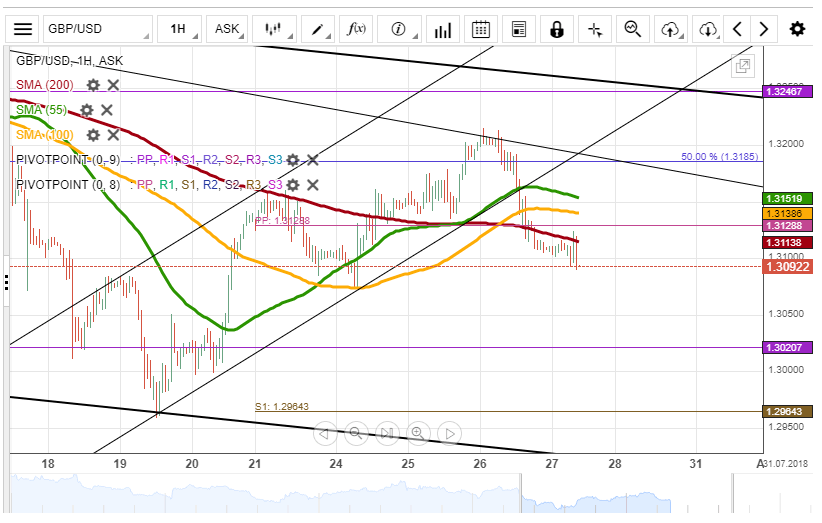
The Sterling was unable to overcome the psychological 1.32 mark, thus being driven by bears during the whole session on Thursday. The rate breached the short-term ascending channel and the 55—, 100– and 200-hour SMAs, thus losing almost 100 pips along the way.
This breakout should point to further decline today. There is no level limiting the pair until the distant monthly S1 at 1.3020. This means that if bears do take over the market, the Pound might be sent for a freefall down to this mark.
In terms of upside potential, the rate will need strong bullish momentum to overcome the many resistance levels apparent on both the 1H and 4H time-frames. Thus, even if the aforementioned plunge does not occur, gains should likewise be limited.
USD/JPY Aims For 112.00
USD/JPY's decline on Wednesday was stopped at 110.60 when the rate reversed to the upside and breached the 200-period (4H) SMA. Thus, the bottom boundary of the senior channel was adjusted to include this latest development.
The Greenback later breached the 55– and 100-hour SMAs for a brief period of time, but failed to accelerate and thus remained fluctuating there until Friday morning.
Technical indicators are bullish in this session. It means that the rate could be supported by the breached 200-period SMA, thus being able to reach for the 200-hour and 100-period SMAs and the weekly PP circa 112.00. This area is regarded as today's highest point if no fundamentals disrupt this assumption.
In case 111.00 is breached to the downside, the US Dollar should not fall below 110.50.