

Sample Category Title
EUR/JPY Weekly Outlook
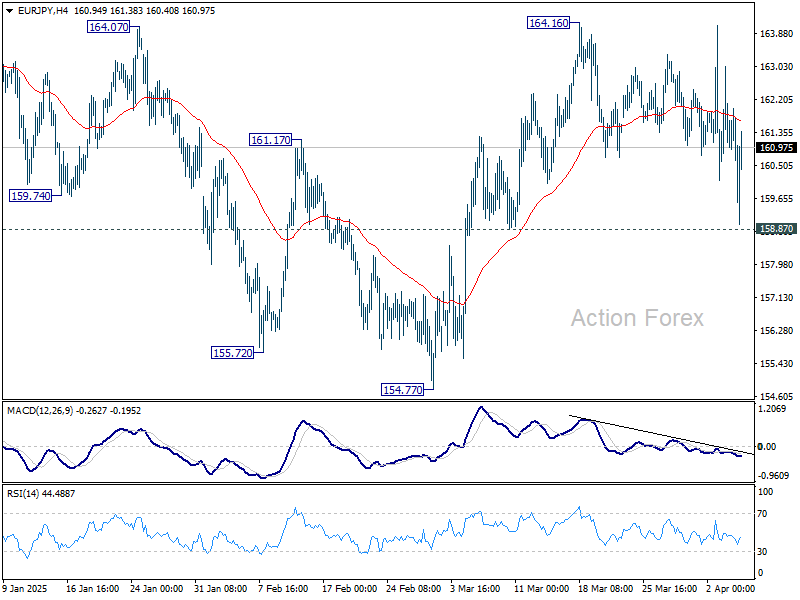
EUR/JPY dipped notably last week but recovered ahead of 158.87 support. Initial bias remains neutral this week first. On the upside, above 164.16 will resume the rally from 154.77 to 164.89 resistance, and then 166.67. However, break of 158.87 support will bring deeper decline back to 154.77 support. Overall, sideway consolidation pattern from 154.40 is still extending.
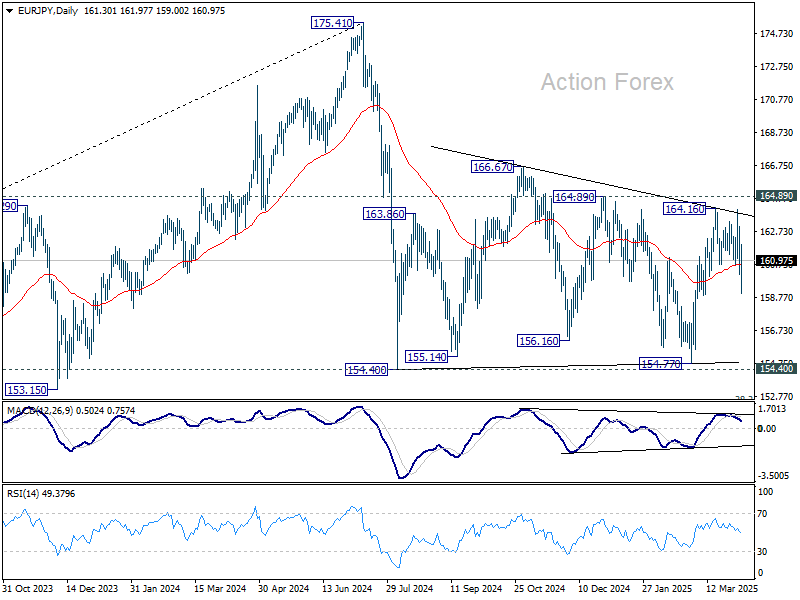
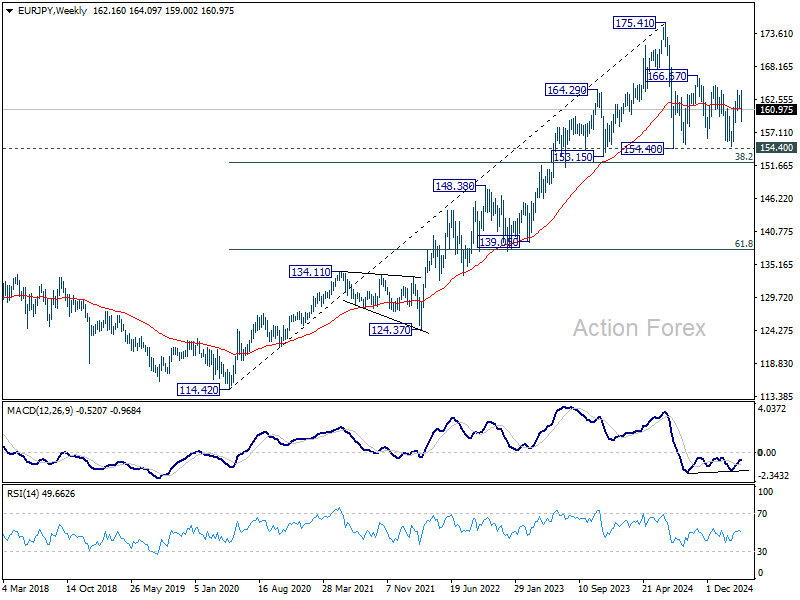
In the bigger picture, price actions from 175.41 are seen as correction to rally from 114.42 (2020 low). Strong support should be seen from 38.2% retracement of 114.42 to 175.41 at 152.11 to contain downside. However, sustained break of 152.11 will bring deeper fall even still as a correction.
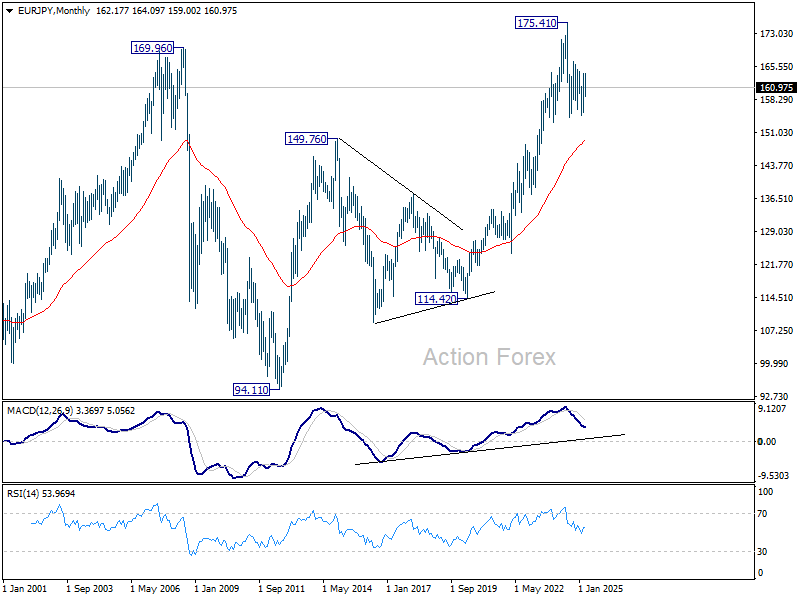
In the long term picture, while 175.41 is at least a medium term top, it's still early to conclude that up trend from 94.11 (2012 low) has completed. A medium term corrective phase is in progress with risk of deeper fall back to 55 M EMA (now at 148.94).
EUR/GBP Weekly Outlook
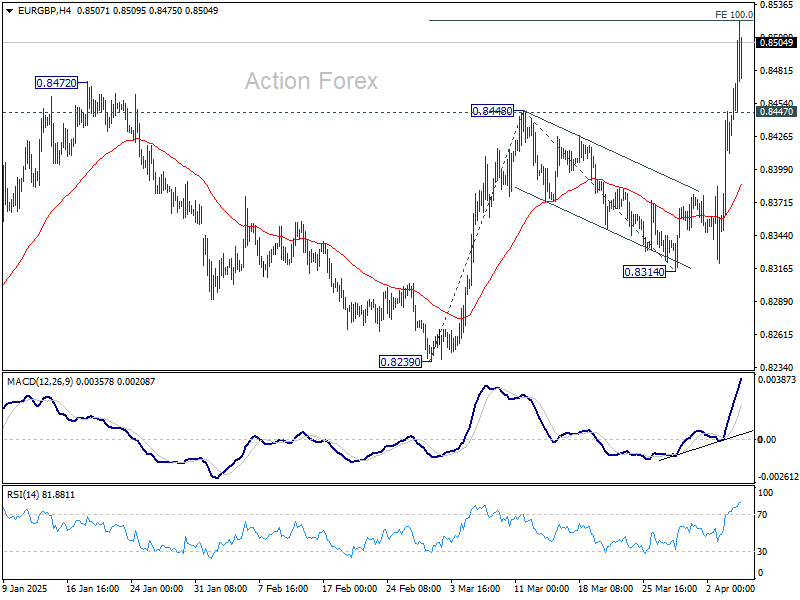
EUR/GBP's rise from 0.8239 resumed by breaking through 0.8448 and 0.8472 resistance. There is no sign of topping yet. Initial bias stays on the upside this week. Firm break of 100% projection of 0.8239 to 0.8448 from 0.8314 at 0.8523 will pave the way to 0.8624 cluster resistance next. On the downside, below 0.8447 minor support will turn intraday bias neutral first.
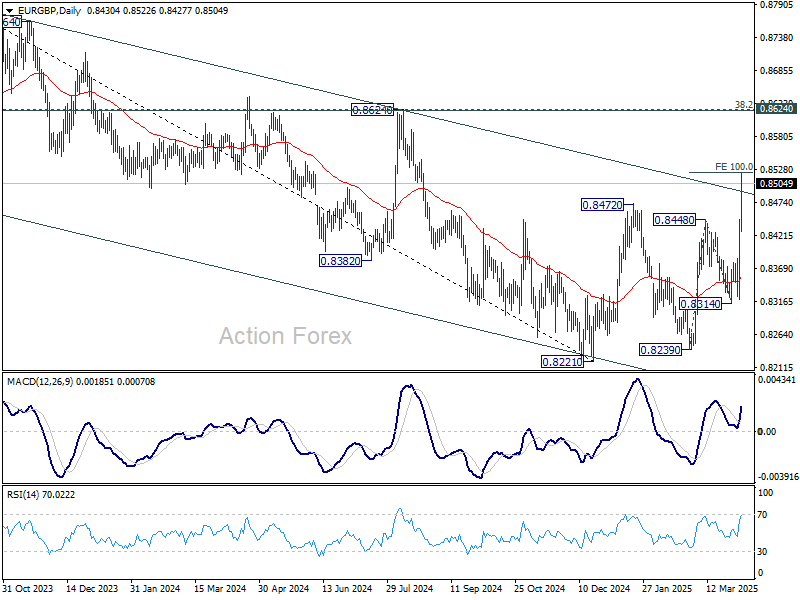
In the bigger picture, the break of medium term channel resistance is a bullish signal. Down trend from 0.9267 (2022 high) could have completed at 0.8221, just ahead of 0.9201 key support (2022 low). Firm break of 0.8624 cluster resistance (38.2% retracement of 0.9267 to 0.8221 at 0.8621) will confirm this bullish case and target 61.8% retracement at 0.8867 next. Nevertheless, rejection by 0.8624 will keep medium term outlook neutral at best.
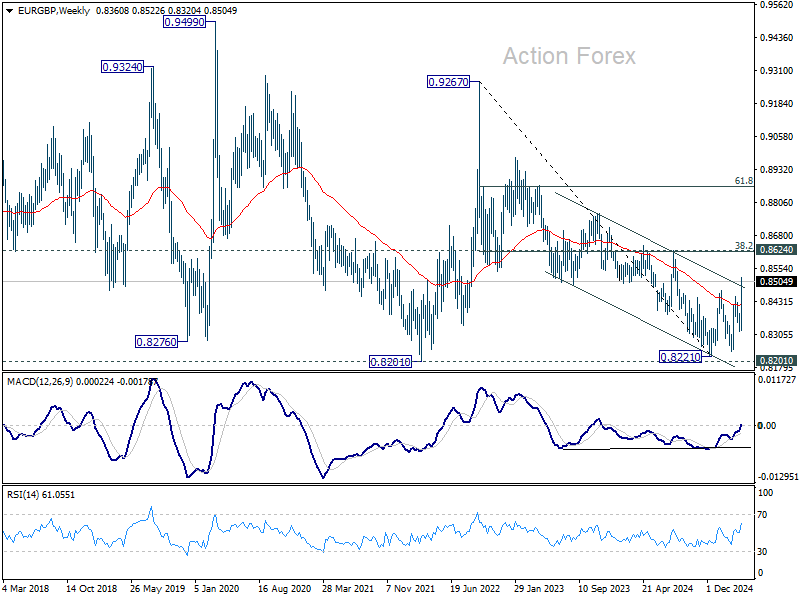
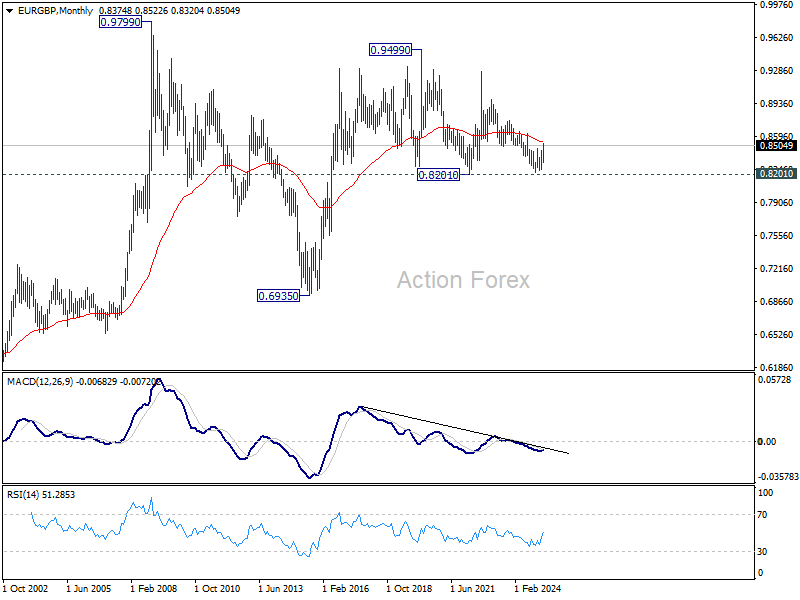
In the long term picture, price action from 0.9499 (2020 high) is seen as part of the long term range pattern from 0.9799 (2008 high). Range trading should continue between 0.8201 and 0.9499, until there is clear signal of imminent breakout.
EUR/AUD Weekly Outlook
EUR/AUD's up trend resumed last week and accelerated to as high as 1.8290. There is no sign of topping yet. Initial bias stays on the upside for 161.8% projection of 1.6355 to 1.7417 from 1.7047 at 1.8765 next. On the downside, below 1.7965 minor support will turn bias neutral and bring consolidations first, before staging another rally.

In the bigger picture, up trend from 1.4281 (2022 low) is in progress, and in reacceleration phase as seen in W MACD. Next target is 100% projection of 1.4281 to 1.7062 from 1.5963 at 1.8744. Outlook will remain bullish as long as 1.7062 resistance turned support holds (2023 high) even in case of deep pullback.

In the longer term picture, rise from 1.4281 is seen as the second leg of the pattern from 1.9799 (2020 high), which is part of the pattern from 2.1127 (2008 high). As long as 55 M EMA (now at 1.6213) holds, this second leg could still extend higher. However, firm break of the above mention 1.8744 projection level with strong momentum, will argue that it's indeed resuming the up trend form 1.1602 (2012 low).

EUR/CHF Weekly Outlook
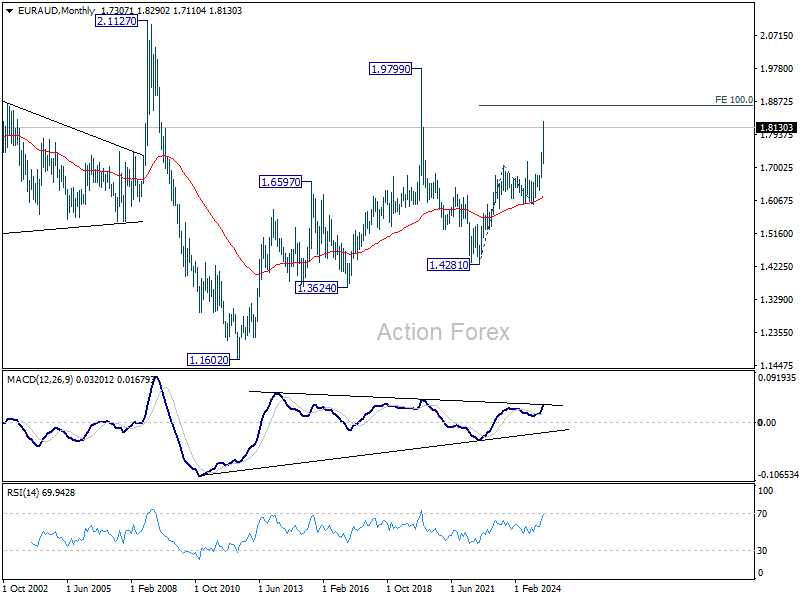
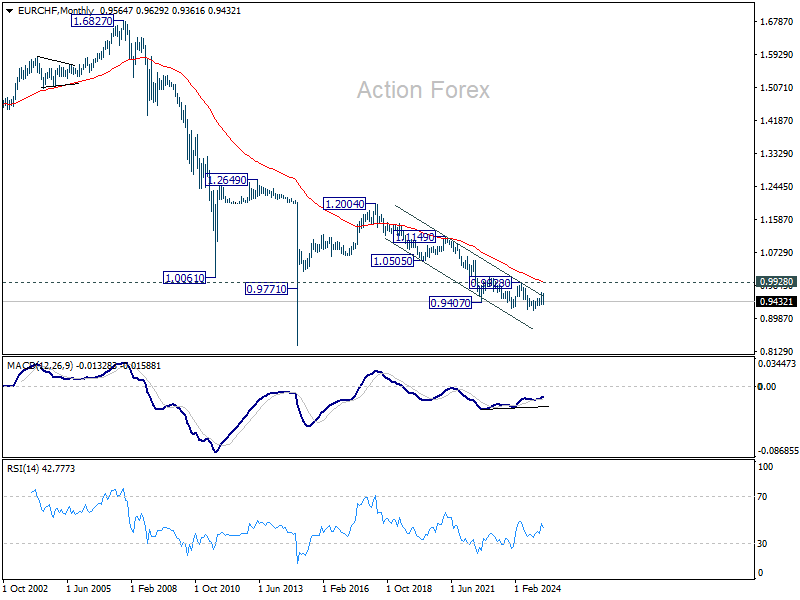
EUR/CHF's fall from 0.9660 resumed last week and dived to as low as 0.9361. Initial bias stays on the downside this week for 0.9331 structural support. Firm break there will indicate that whole rally from 0.9204 has completed as a three-wave correction, after rejection by channel resistance. Deeper decline would be seen to retest 0.9204 low next. On the upside, above 0.9473 minor resistance will turn intraday bias neutral first.
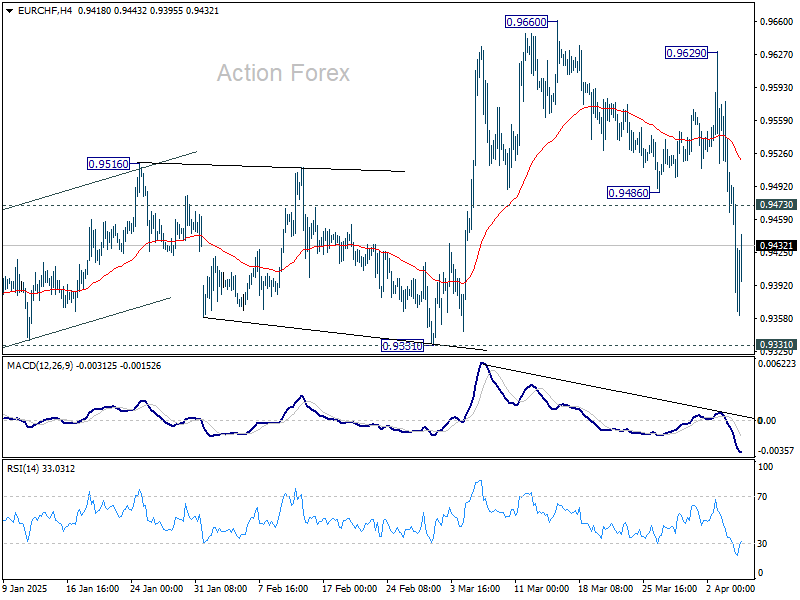
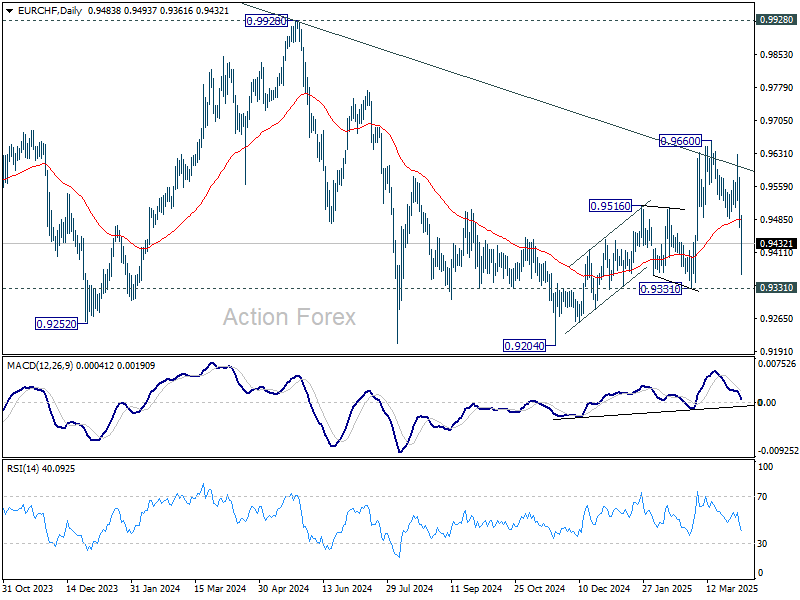
In the bigger picture, rejection by long-term falling channel resistance (now at 0.9600) will retail medium term bearishness. That is, down trend from 1.2004 (2018 high) is still in progress. Downside breakout through 0.9204 low would then be in favor at a later stage.
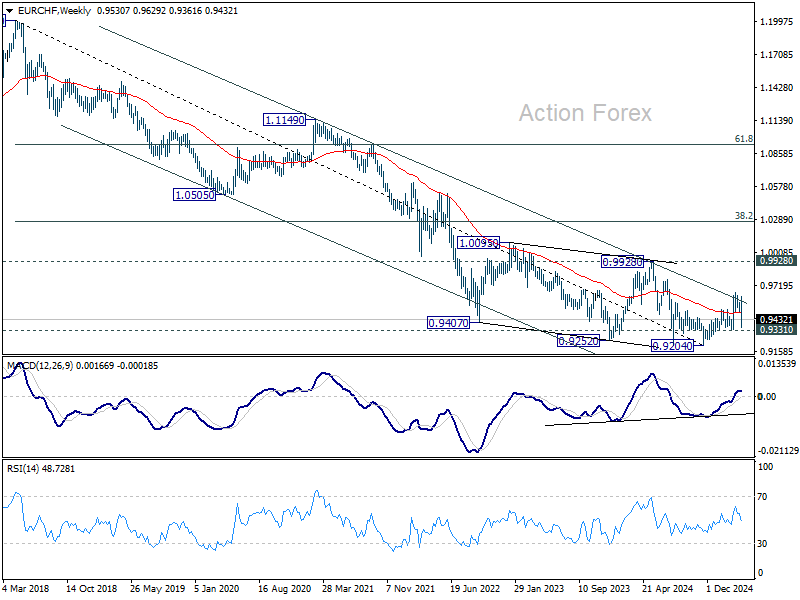
In the long term picture, bullish signs are emerging. However, the important hurdle at 0.9928 resistance, which is close to 55 M EMA (now at 0.9960), is needed to be taken out decisively before considering long term trend reversal. Otherwise, outlook is neutral at best.
Market Turmoil Unleashed as Global Tariff Battlelines Drawn
The global financial markets were shaken last week as US President Donald Trump’s long-anticipated reciprocal tariff plan arrived with a bang. The magnitude of the tariff rates, the number of countries impacted, and the sheer complexity of implementation shocked investors. What could have been a temporary setback quickly spiraled into a broader risk event, fueling sharp selloffs and potentially igniting a full-fledged bear market.
Matters only worsened after China swiftly responded with its own retaliatory measures. The rhetoric on both sides is heating up. Trump, doubling down on his hardline stance, declared on social media that his “policies will never change” and accused China of panicking. Meanwhile, Chinese officials dismissed the US measures, mockingly claiming, “The market has spoken.”
With Washington and Beijing locked in confrontation, global focus now turns to how the rest of the world will react. The first clear sign of diplomacy came from Vietnam, where General Secretary To Lam phoned Trump and offered to negotiate a deal to reduce tariffs on US exports to zero, in exchange for equal treatment. If this sets a precedent, it may provide insight into whether Trump’s long-term vision is truly a bilateral web of lowered trade barriers. Or, he has something else in his mind.
Still, the true litmus test lies ahead with the US-EU trade negotiations. European Commission President Ursula von der Leyen has shown no signs of backing down, warning that the EU “holds a lot of cards” and that “all instruments are on the table.” Europe’s massive market and leadership in tech give it leverage, and should talks break down, the threat of firm and coordinated countermeasures looms large. The shape and tone of the US-EU discussions will be critical in determining whether a full-blown global trade war materializes, or if some de-escalation is still possible.
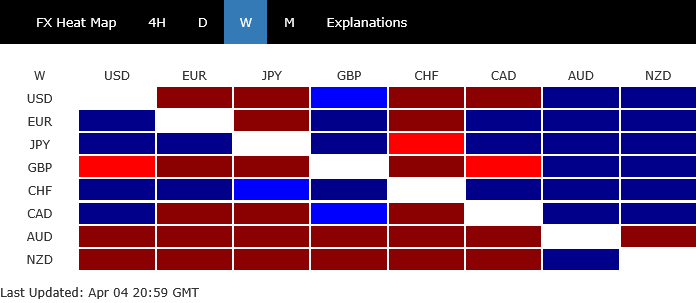
In the currency markets, Swiss Franc emerged as the ultimate winner last week, solidifying its position as the top safe-haven asset, while Yen followed closely. Euro, notably, seems to be replacing Dollar as a safe-haven choice. The
At the bottom of the currency ladder was the Aussie, which was hammered by China’s retaliation, given its economic dependence on Chinese demand. Kiwi followed while Sterling rounded out the bottom three. Loonie, and Dollar saw mixed results—gaining ground against commodity currencies but faltering against their safe-haven counterparts.
Oversold Bounce Possible, Yet Trade War Escalations Keep Downside Risks Elevated
Following last week's brutal stock market selloff, there’s technical scope for a short-term rebound. Markets are deeply oversold, and some bargain-hunting or short coverers may lift equities from their recent lows in the days ahead. However, any recovery in risk sentiment will likely be capped by the still-heavy cloud of uncertainty surrounding the unfolding global tariff war.
Despite the market's hopes, it’s unrealistic to expect trade negotiations — especially those involving sweeping reciprocal tariffs and multiple major economies — to wrap up quickly. The threat of a prolonged standoff or even a complete breakdown in talks remains high. In such a case, a full-blown global trade war could be on the table, with wide-ranging consequences for investment, consumption, and global growth.
Of particular concern is Europe’s position in this trade crossfire. Both the EU and ECB have previously flagged concerns that China could redirect excess supply to the EU if blocked by US tariffs. Such dumping would put further pressure on already weak growth and inflation in the region. To avoid this, Europe might be forced to erect its own trade barriers against China, risking retaliation and further fragmentation of global trade flows.
In this increasingly fragile environment, the risks for a synchronized global slowdown looms large. However, unlike the Great Recession of 2008-09, unlikely the country could act as a buffer this time. China itself is now a central target in the trade conflict, and its export-driven model could face unprecedented pressure from multiple fronts. That leaves the world vulnerable to a more prolonged and widespread economic downturn if trade tensions escalate further.
For traders and investors, the message is clear. Any near-term rally should be treated with caution. Rebounds may be sharp, but as long as key technical resistance levels in major indexes like DOW, Nikkei, or DAX remain intact, it's premature to call it a return to normal. Until then, the base case remains a fragile market dominated by geopolitical risk, with any relief rallies vulnerable to sudden reversals.
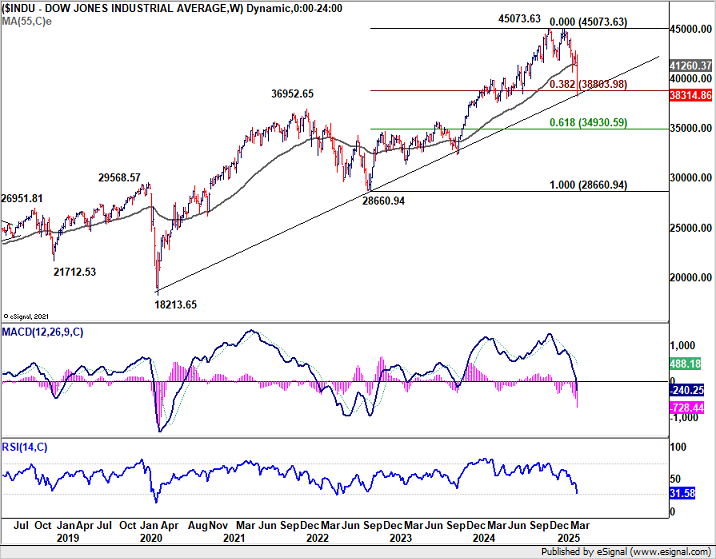
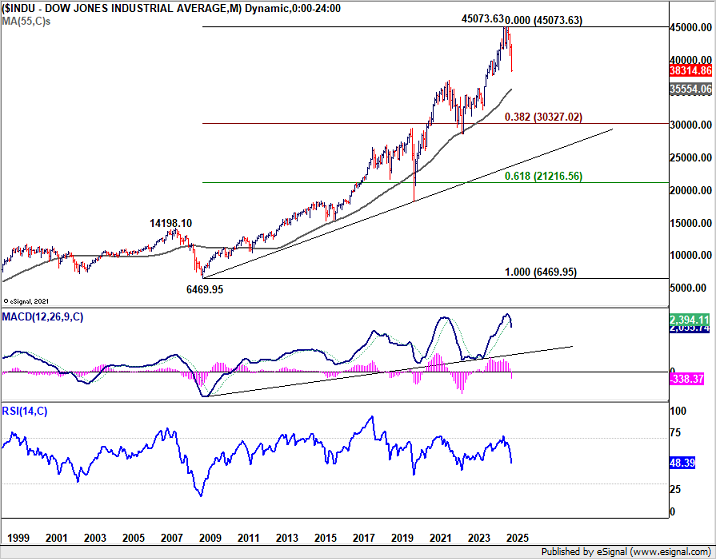
Technically, for DOW, it's now at an important support zone of the long term rising trend line and 38.2% retracement of 28660.94 to 45071.29 at 38802.54. A rebound from current level would be reasonable, but risk will stay heavily on the downside as long as 55 W EMA (now at 41260.37) holds. However, sustained break of 38802.54 will raise the change of even deeper correction to next key support at 55 M EMA (now at 35554.06).
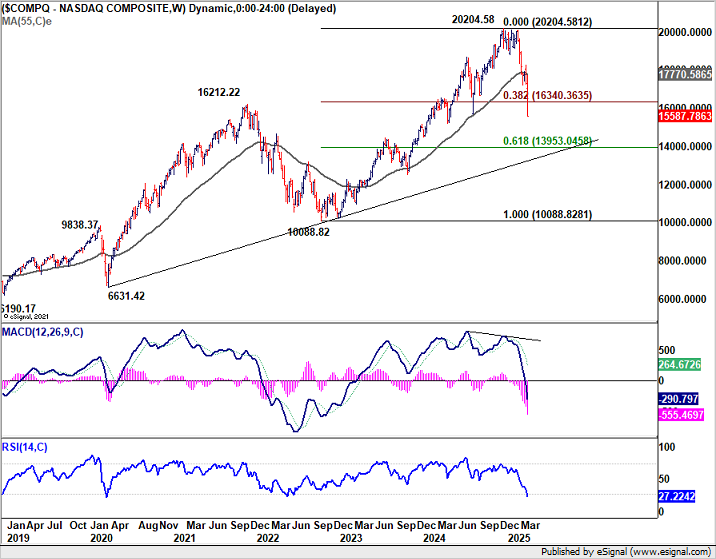
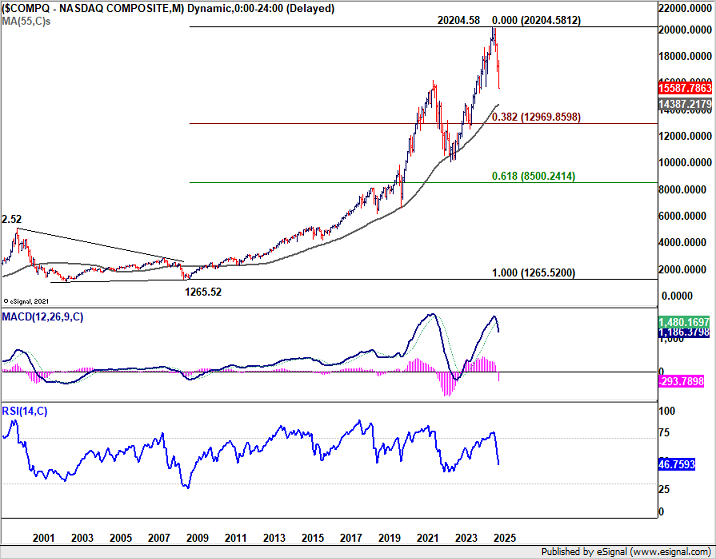
NASDAQ's outlook was worse with the break of 38.2% retracement of 10088.82 to 20204.68 at 16340.36. Risk will stay on the downside as long as 55 W EMA (now at 17770.58) holds. Fall from 20204.58 should be on track to 55 M EMA (now at 14387.21) on next fall.
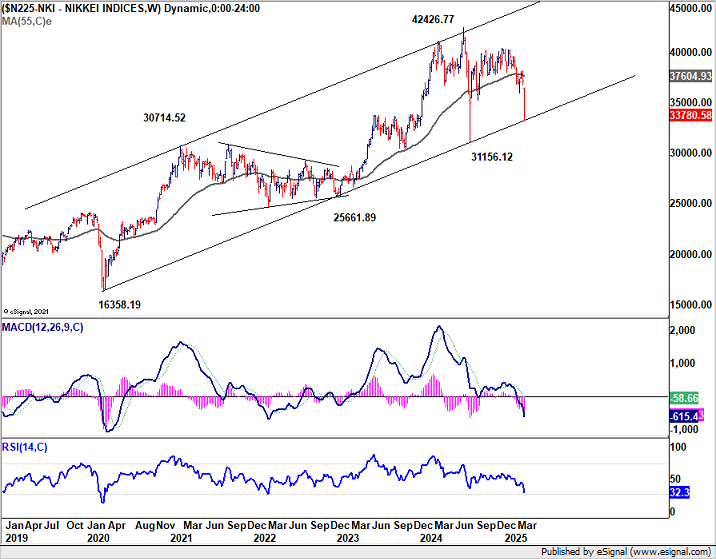
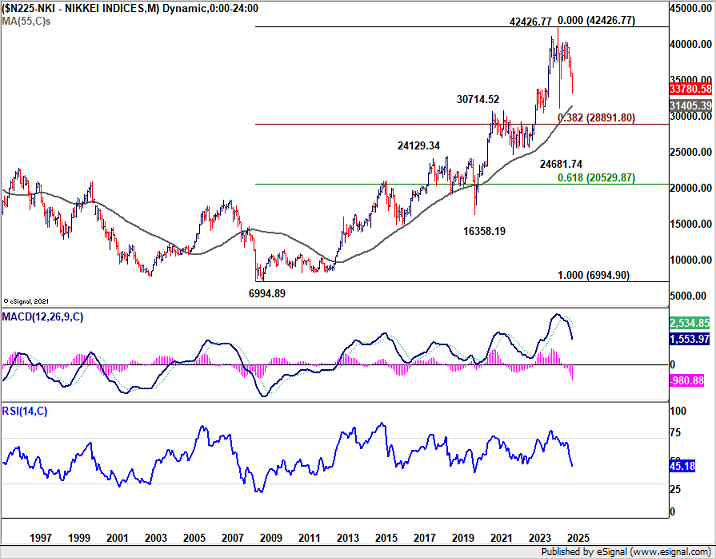
Nikkei's steep fall confirmed that corrective pattern from 42426.77 (2024 high) has already started the third leg. Strong bounce from current level will keep Nikkei inside the long term rising channel. But risk will stay on the downside as long as 55 W EMA (now at 37604.93) holds. Sustained trading below the channel support will bring even deeper fall to 55 M EMA (now at 31405.39) or even further to 38.2% retracement of 6994.89 (2009 low) to 42426.77 at 28891.80.
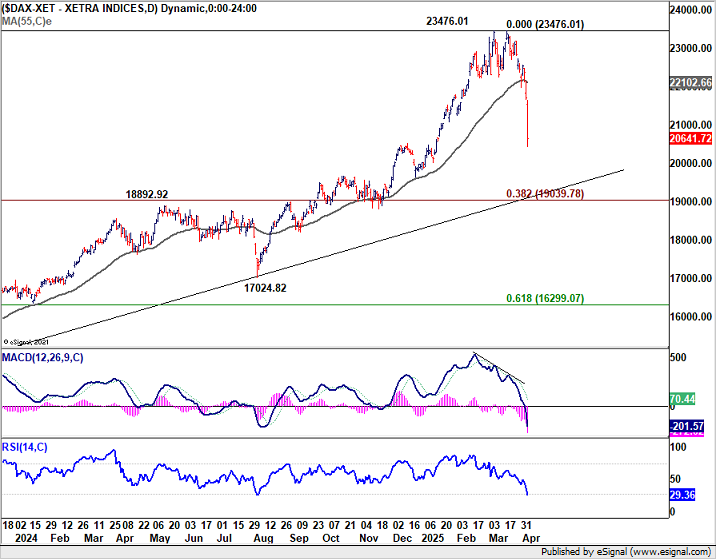
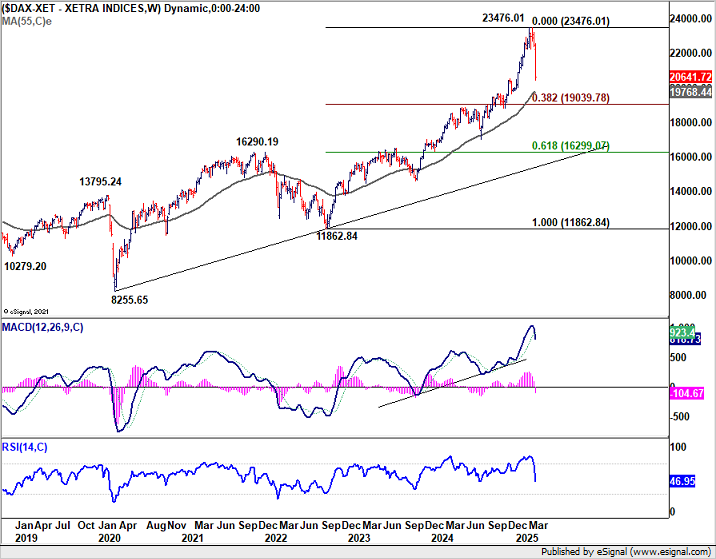
Outlook in DAX is slightly better thanks to the strong rally in March. But still, near term risk will be on the downside as long as 55 D EMA (now at 22102.60) holds. Fall from 23476.01 is seen as corrective the up trend from 11862.84 (2022 low only). There are a few levels ahead that could help floor the correction, including 55 W EMA (now at 19768.44), trend line support at around 19200, and 38.2% retracement of 11862.84 to 23476.01 at 19039.78.
Will 100 Be the Savior for Sliding Dollar Index?
Dollar Index staged a notable late-week rebound, closing at 103.02 on Friday, well off the week's low of 101.26. The move helped ease immediate downside pressure. The 100 psychological level, along with the 55 M EMA (now at 101.01) could provide a floor in the near term and turn the index into consolidations. Still, firm break of 104.68 resistance is needed to confirm short term bottoming first. Or risk will remain on the downside.
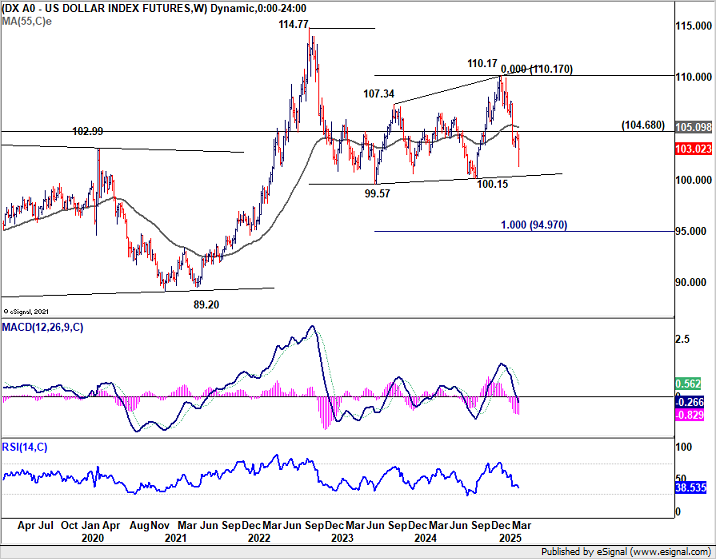
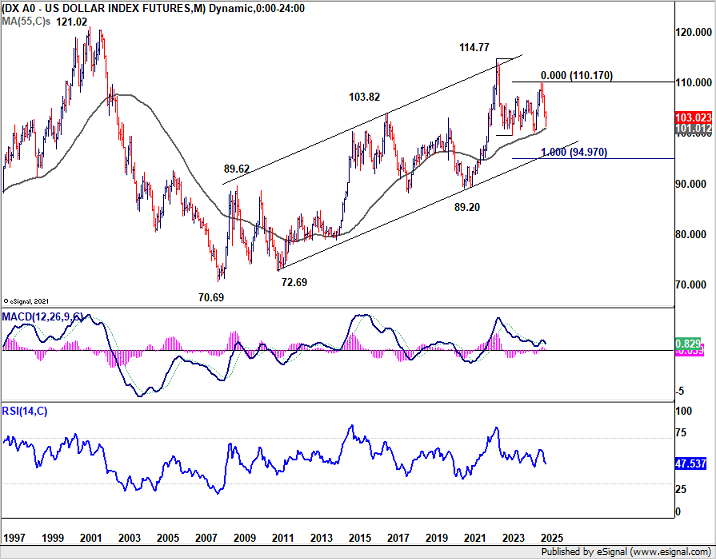
From a broader perspective, the fall from 110.17 is seen as the third leg of a larger correction originating from 114.77 (2022 high). Decisive break below key 99.57/100.15 support zone would open the door for deeper medium term fall to decade-long rising channel support (now at 95.80), or even further to 100% projection of 114.77 to 99.57 from 110.17 at 94.97.
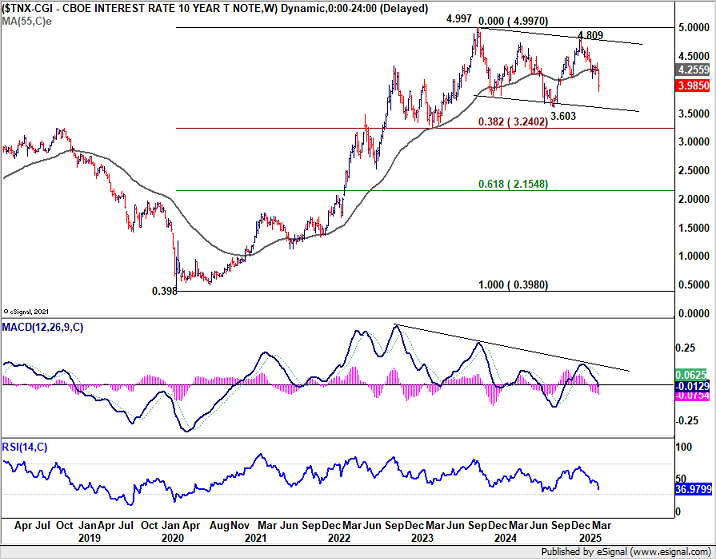
A critical variable in Dollar’s path is the development of US Treasury yields. The sharp drop in the 10-year yield last week reinforces the view that the broader corrective pattern from 4.997 (2023 high) is in another downleg.
Risk will stay on the downside as long as 55 W EMA (now at 4.255) holds. Further decline is likely to 3.603 support.
Even so, solid technical support should emerge from the 38.2% retracement of 0.398 to 4.997 at 3.240 to contain downside. That should provide some support to floor Dollar's decline in the medium term.
Swiss Franc Dominates in Europe, Would It Cap EUR/GBP Advance?
Swiss Franc ended last week as the strongest European currency, outperforming both Euro and the risk-sensitive Sterling by a mile.
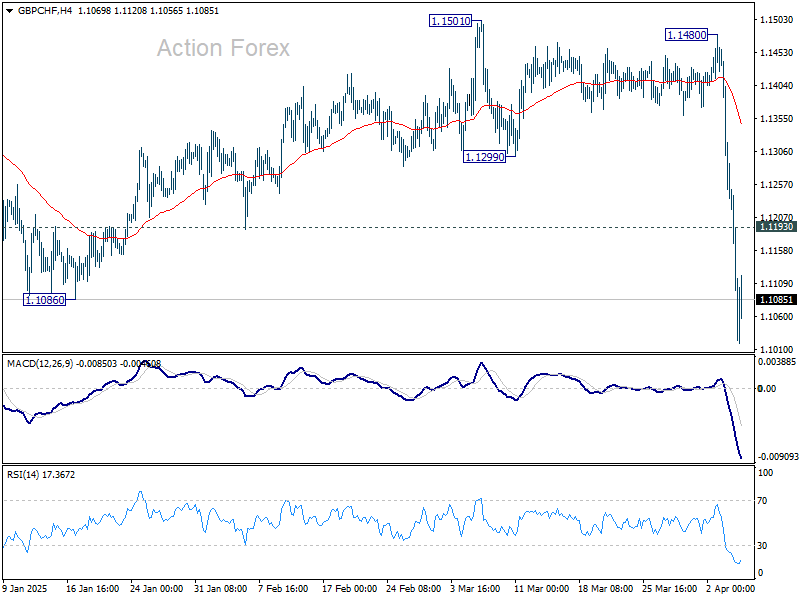
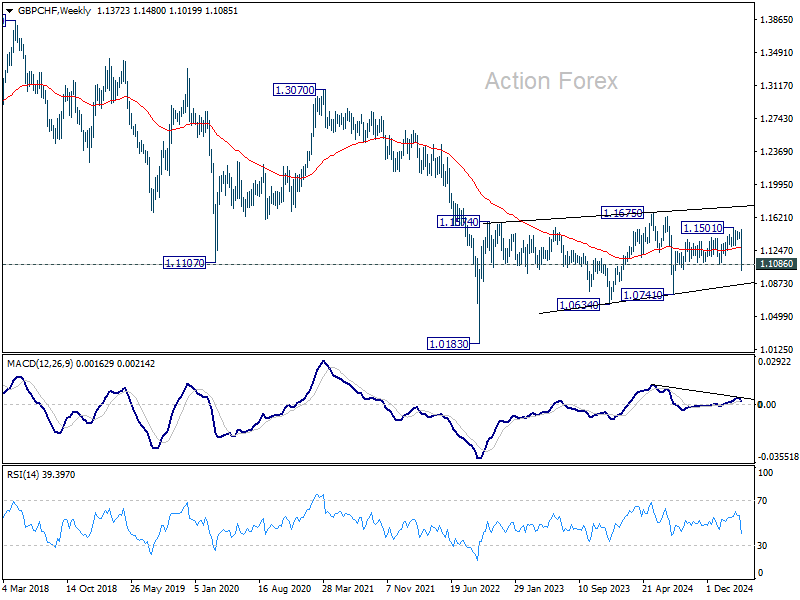
GBP/CHF's break of 1.1086 support suggests that whole rally from 1.0741 has completed at 1.1501. Deeper fall should be seen back to 1.0741 support first. Firm break there will argue that long term down trend is ready to resume through 1.0183 (2022 low). Meanwhile, above 1.1193 minor resistance will turn bias neutral and bring consolidations first, before staging another fall.
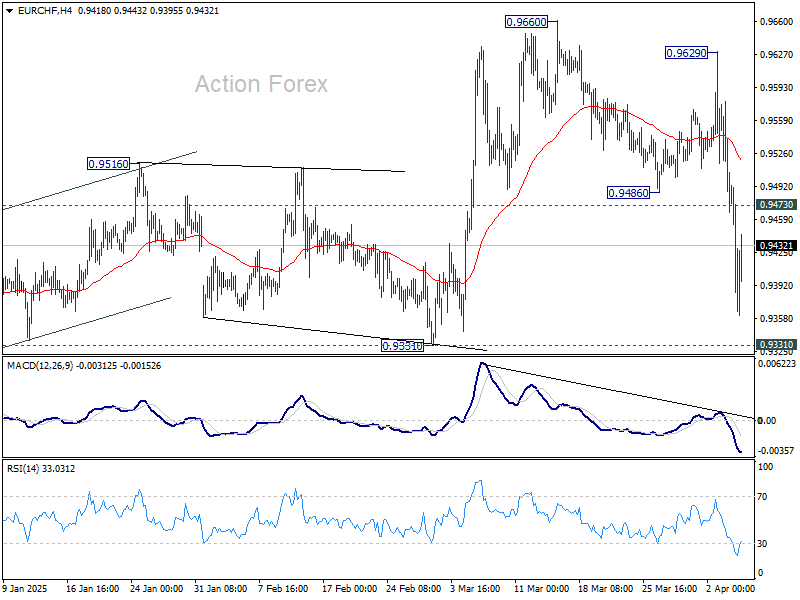
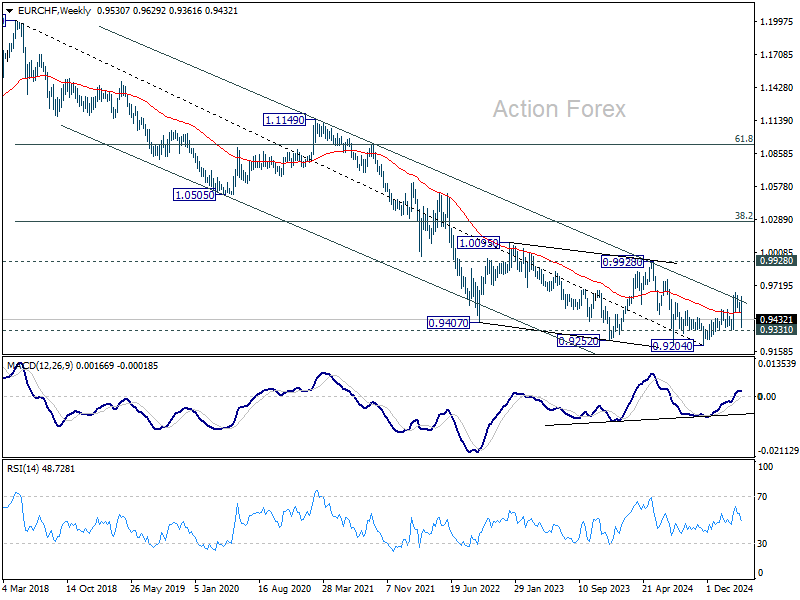
As for EUR/CHF, focus is back on 0.9331 support after the sharp fall. Firm break there should confirm that rebound form 0.9204 has completed at 0.9660. More importantly, that would also confirm rejection by the long term channel resistance. Larger down trend might then be ready to resume through 0.9204.
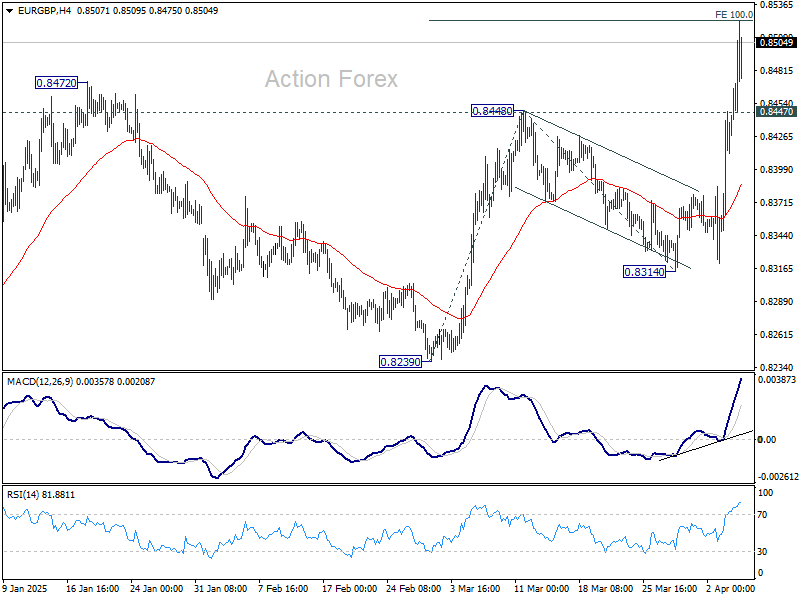
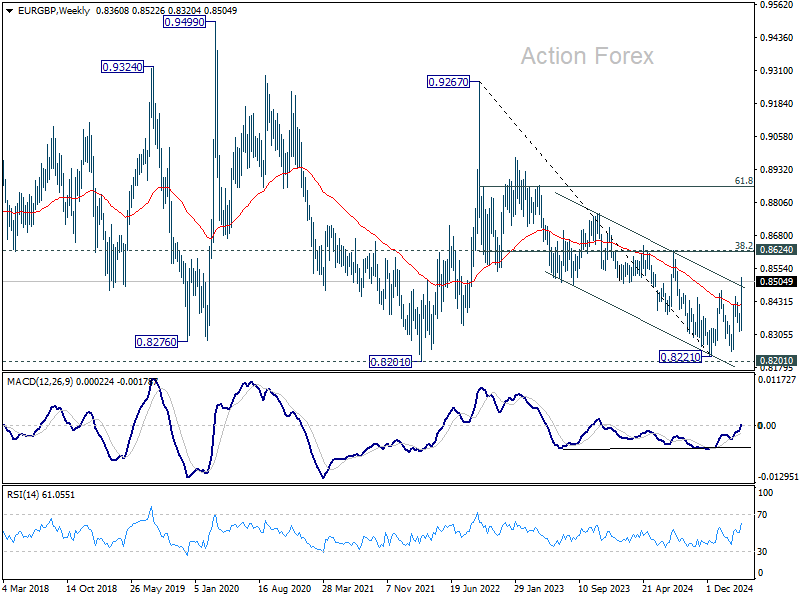
EUR/GBP resumed the rise from 0.8239 and hit as high as 0.8522, just shy of 100% projection of 0.8239 to 0.8448 from 0.8314 at 0.8523. The break of medium term falling channel resistance is a bullish sign. It's also plausible that down trend from 0.9267 (2022 high) has completed at 0.8221, just ahead of 0.8201 key support (2022 low). Firm break of 0.8523 will affirm this case, and target 0.8624 cluster resistance (38.2% retracement of 0.9267 to 0.8221 at 0.8621) for confirmation of bullish reversal.
However, for EUR/GBP to extend its bull run decisively, support is needed from a rebound in EUR/CHF. If EUR/CHF breaks down further below 0.9331 and drags on Euro more broadly, EUR/GBP would struggle to gain traction or even come under pressure itself.
AUD/CAD and AUD/NZD in free fall
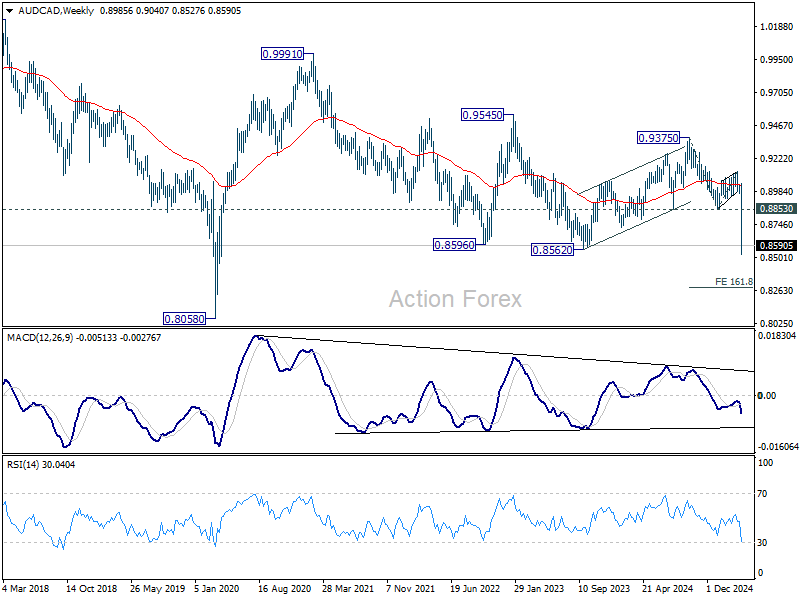
Commodity currencies all declined broadly on risk aversion. But Aussie was the worst by far, particularly hard-hit following China’s announcement of retaliatory tariffs against the US.
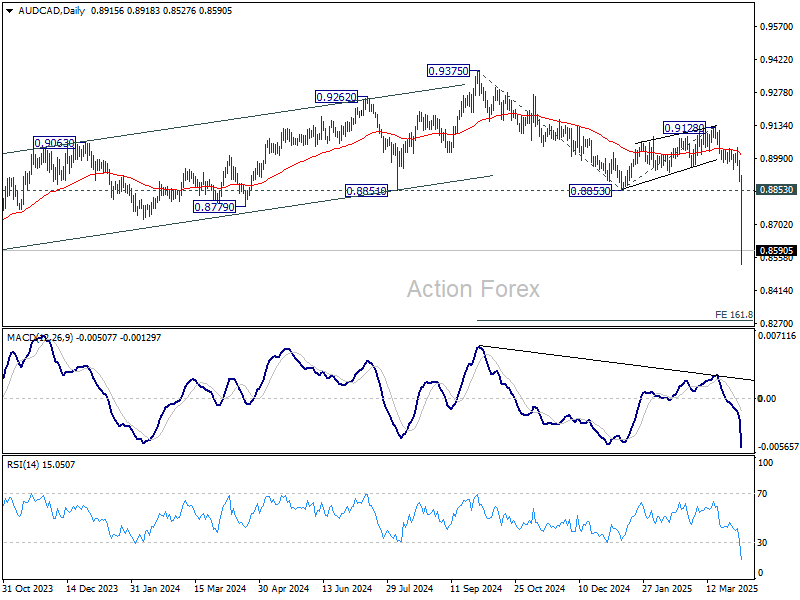
AUD/CAD's break of 0.8562 (2023 low) suggests that whole down trend from 0.9991 (2021 high) is resuming. Outlook will stay bearish as long as 0.8853 support turned resistance holds, even in case of recovery. Next target is 161.8% projection of 0.9375 to 0.9128 from 0.8853 at 0.8283.
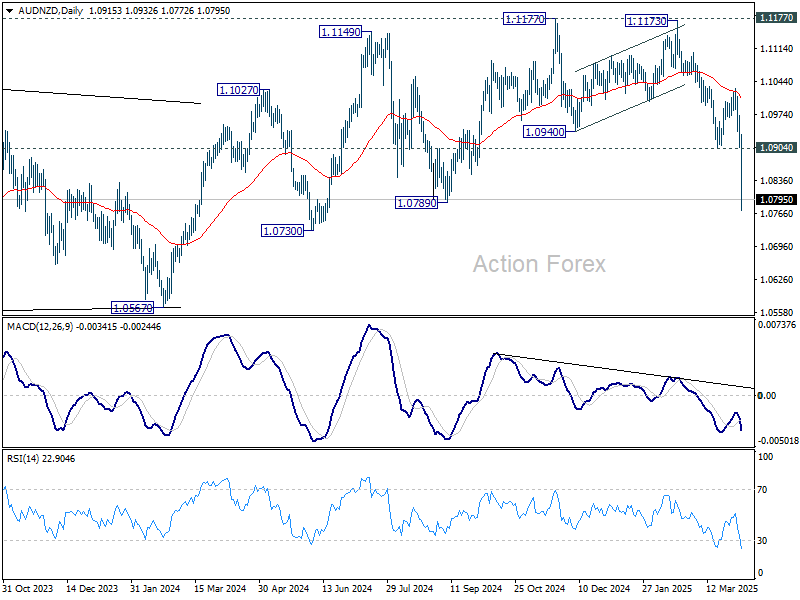
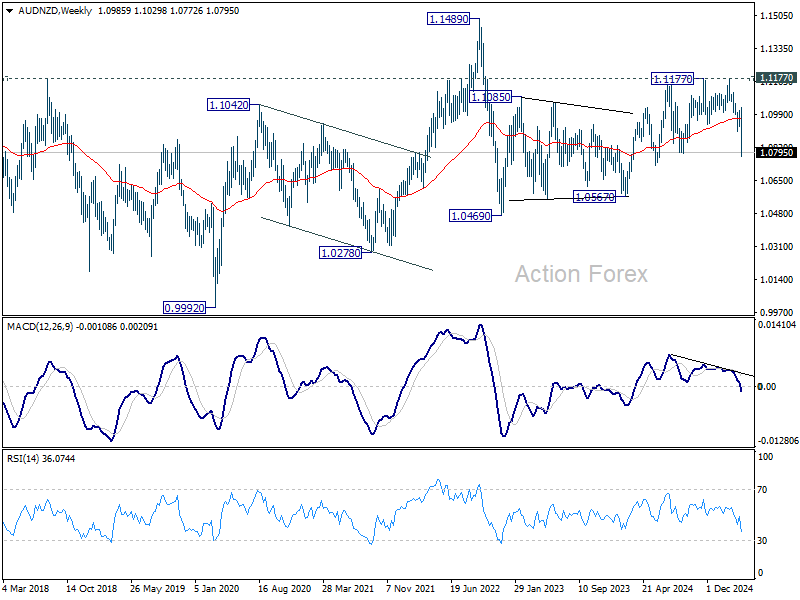
AUD/NZD's break of 1.0789 support suggests that rise from 1.0567 has already completed at 1.1177 already. More importantly, whole rebound from 1.0469 (2022 low) could have finished as a three-wave corrective rise too. Near term outlook will now remain bearish as long as 1.0904 support turned resistance holds. Deeper fall would be see back to 1.0567 support next. Firm break there will raise the chance that whole down trend from 1.1489 (2022 high) is ready to resume through 1.0469.
USD/JPY Weekly Outlook
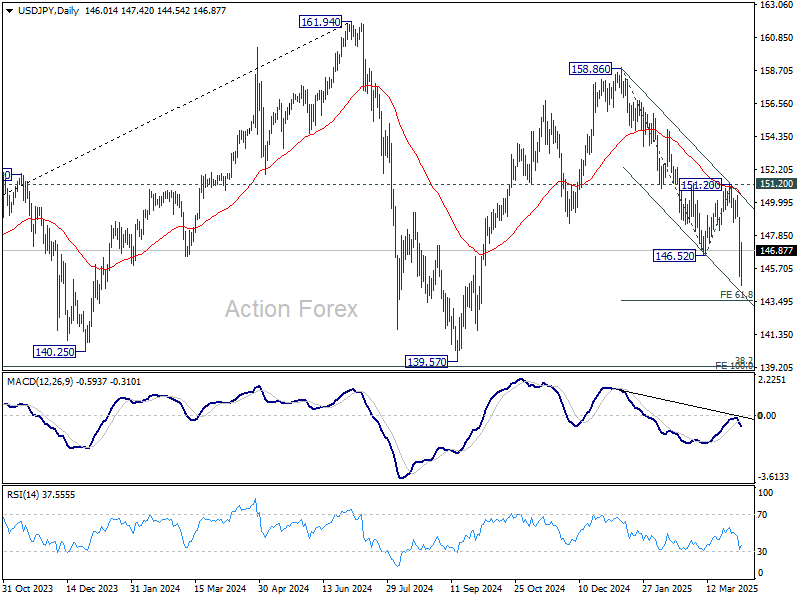
USD/JPY's fall from 158.86 resumed last week and hits as low as 144.54. But a temporary low should be formed with subsequent recovery. Initial bias is turned neutral this week for consolidations first. Outlook will remain bearish as long as 151.20 resistance holds. Below 144.54 will target 61.8% projection of 158.86 to 146.52 from 151.20 at 143.57. Break there will target 139.57 low.
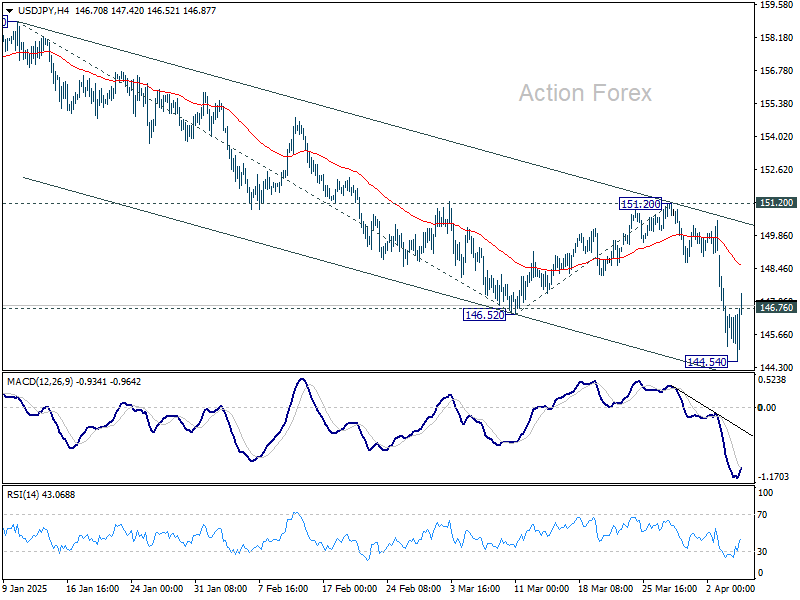
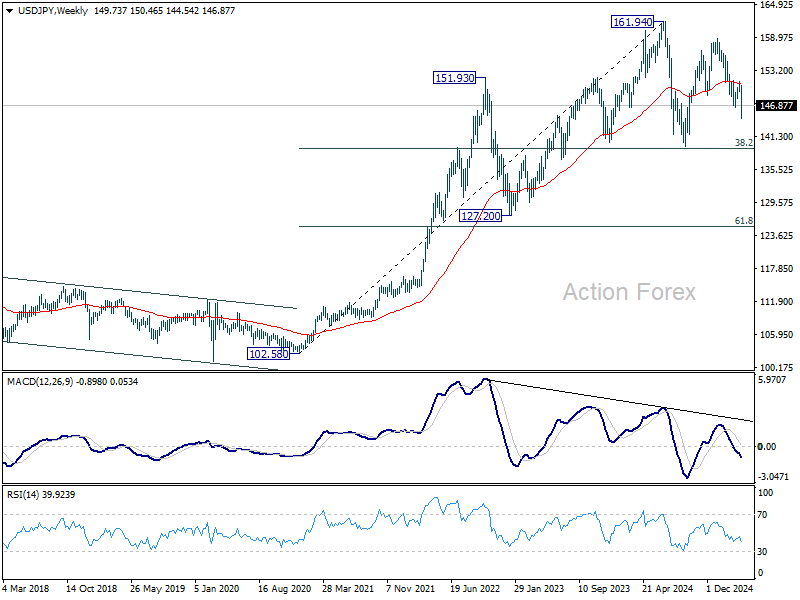
In the bigger picture, price actions from 161.94 are seen as a corrective pattern to rise from 102.58 (2021 low), with fall from 158.86 as the third leg. Strong support should be seen from 38.2% retracement of 102.58 to 161.94 at 139.26 to bring rebound. However, sustained break of 139.26 would open up deeper medium term decline to 61.8% retracement at 125.25.
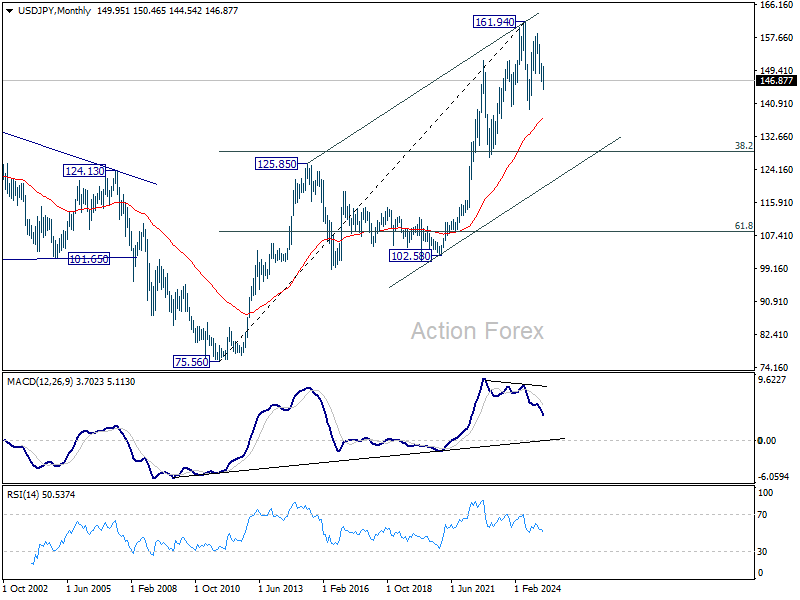
In the long term picture, it's still early to conclude that up trend from 75.56 (2011 low) has completed. A medium term corrective phase should have commenced, with risk of deep correction towards 55 M EMA (now at 137.30) and even below.
Markets Weekly Outlook – FOMC Minutes, Tariff Developments and Inflation Ahead
- US equity markets tumbled due to President Trump's tariff proposals, raising global growth concerns.
- Federal Reserve Chair Jerome Powell acknowledged tariffs' impact, emphasizing monitoring inflation and waiting for more data.
- The upcoming week focuses on further tariff developments, US jobs data, and central bank decisions in Australia and New Zealand.
- Technical analysis shows that the Nasdaq 100 has now entered a bear market, down 20% from all-time highs.
Week in review: Liberation day tariffs send markets tumbling
A bloodbath week for US Equity markets and markets as a whole has finally come to an end. Market sentiment soured after President Trump revealed his tariff proposals which weighed on global growth expectations and sent US stocks tumbling.
On Thursday, hedge funds sold stocks at their highest single-day amount since 2010. At the same time, retail investors bought $4.7 billion worth of stocks, the most in over a decade. Friday, the S&P 500 lost another $1.5 trillion in market value, bringing the total two-day losses to $3.5 trillion.
Friday's losses came about as China announced it will retaliate against U.S. President Donald Trump by imposing an extra 34% tariff on U.S. goods. This move intensifies the trade war, worrying investors and raising fears of a possible recession.
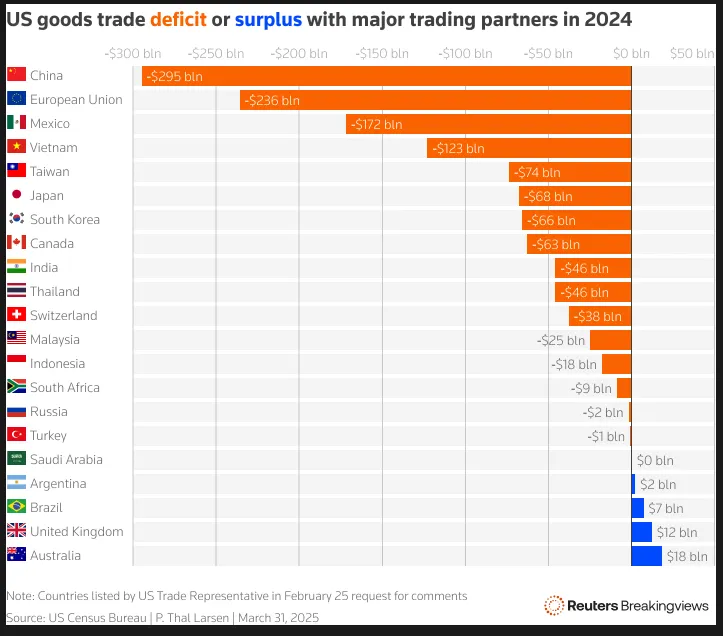
Source: LSEG, US Census Bureau
Developments this week saw investment bank J.P. Morgan increase their estimates to 60% that the global economy would enter a recession by year-end, up from 40% previously.
Big tech stocks dropped, pushing the Nasdaq closer to a bear market. Companies that rely heavily on China and Taiwan for manufacturing were hit hard, with Apple falling 6.4% and Nvidia dropping 7.7%.
The Nasdaq was set to close more than 20% below its record high from December.
It appears that market participants are now looking to the Federal Reserve and Chair Jerome Powell to be the saviour.
Federal Reserve Chair Jerome Powell told a business journalists' conference on Friday that the tariffs were "bigger than expected" and increased the risk of higher inflation and slower economic growth.
The Fed plans to wait for more data before deciding on monetary policy but will focus on keeping inflation under control if Trump's tariffs lead to lasting price increases, Powell said.
He didn’t directly comment on the U.S. stock market selloff but admitted that uncertainty is causing businesses to delay decisions.
"People are just waiting for clarity," Powell said. "I can't say when it will clear up, but it eventually will."
On the FX front, The U.S. dollar strengthened against major currencies like the euro and yen on Friday after Federal Reserve Chairman Jerome Powell discussed the impact of bigger-than-expected U.S. tariffs and took a cautious approach to future rate cuts.
The Aussie Dollar lost ground on Friday and hit five-year lows against the greenback after China announced its tariff stance and retaliation. The Swiss Franc and the Japanese Yen both benefitted this week from safe haven appeal, both gaining significant ground across the board.
Commodities were interesting to observe this week. Gold prices rose immediately after the tariff announcement but experienced a significant selloff since then. Gold reached a high of 3167 before the selloff saw prices touch a low of 3015 on Friday. The only explanation that I could draw was significant profit taking and the possibility that the tariffs were largely priced in.
Oil prices struggled this week as OPEC + announced further output increases. That coupled with tariff fears sent Oil prices to their lowest level since 2021. Friday's losses were around 8%. For more information on the OPEC + developments read Brent Oil price plummets: OPEC+ output hike & price outlook
Heading into next week and the tariff picture is far from clear. Market participants will do well to focus on potential deals between the US and other countries which could help sentiment improve. However, if no deals materialize and countries follow the China approach markets could be in for another week of pain.
The week ahead: Markets eye tariff developments and the FOMC minutes
The upcoming week will focus on U.S. President Donald Trump's plans for new tariffs. Alongside this, markets will also watch U.S. jobs data, an Australian central bank meeting, and a key eurozone inflation report.
Asia Pacific Markets
The main focus this week in the Asia Pacific region will be Chinese inflation and Japanese wage data as the BoJ eyes a rate hike in the coming months.
Next week, China's low inflation could give the central bank (PBoC) room to cut interest rates. March inflation data, due Thursday, is expected to show consumer prices staying weak, with a slight rise of just 0.1% year-on-year.
Meanwhile, producer prices are likely to remain negative for the 30th straight month as input costs keep falling. These deflationary pressures and high real interest rates could push the PBoC to lower rates, though it has held off so far, waiting for the right moment.
The Bank of Japan will be watching wage data this week as the central bank eyes another rate hike. Wages are expected to improve gradually. February saw stronger labor cash earnings, helped by solid bonus payouts. However, real cash earnings are likely to keep shrinking as inflation peaked in the same month. Inflation eased in March due to energy subsidies and lower fresh food prices, supporting the outlook for a steady rise in wages over time.
The Reserve Bank of New Zealand will announce its interest rate decision on Wednesday next week. Market participants are expecting the central bank to cut rates by 25 bps. Given the tariff developments and the backdrop of the New Zealand economy a 25 bps cut seems all but certain at this point.
Europe + UK + US
In developed markets, the US is the major data player next week with the Euro Zone and the UK enjoying a data reprieve.
The US economy is facing growing challenges as President Trump’s new trade policies spark concerns about higher prices and slower economic growth. Steep tariffs, which are paid by importing companies, could hurt profit margins and reduce consumer spending, especially as worries about job losses grow and stock markets decline. While markets are increasingly expecting the Federal Reserve to cut interest rates, another high core CPI and PPI reading next week might make the Fed cautious about acting soon.
I will also be watching consumer confidence, which could drop further after recent events, and monitoring whether government spending cuts tied to DOGE are improving the fiscal situation.
The UK does not have any high impact data releases but I will be keeping a close watch on Friday's GDP data print. After a slow January, I expect a small rebound in February's monthly GDP. These figures can be quite volatile, but despite a quieter end to 2024, the outlook for 2025 still seems positive, even with the recent tariff news.
There are still of course challenges as evidenced by the Goldman Sachs group which lowered its UK GDP forecast down to 0.7% from a previous 0.8%.
The UK government is significantly increasing spending this year, which should help support growth. However, weaker economic activity in the US and eurozone could become a big challenge later this year and into 2026.
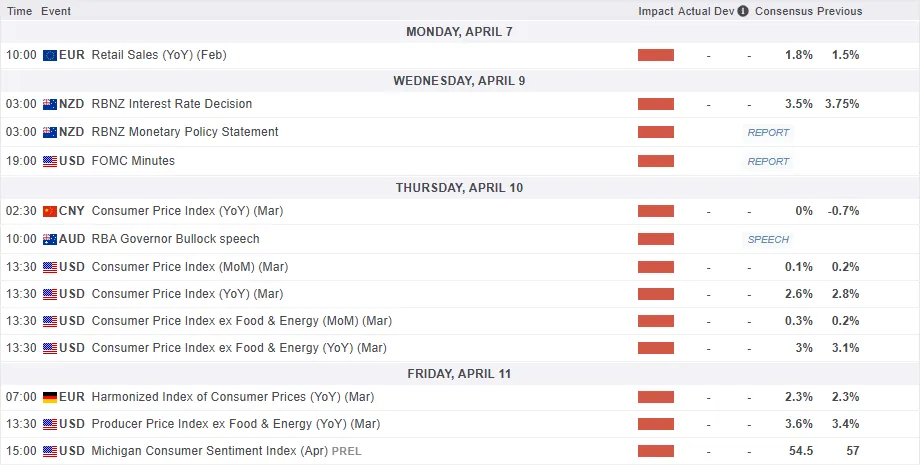
Chart of the week - Nasdaq 100
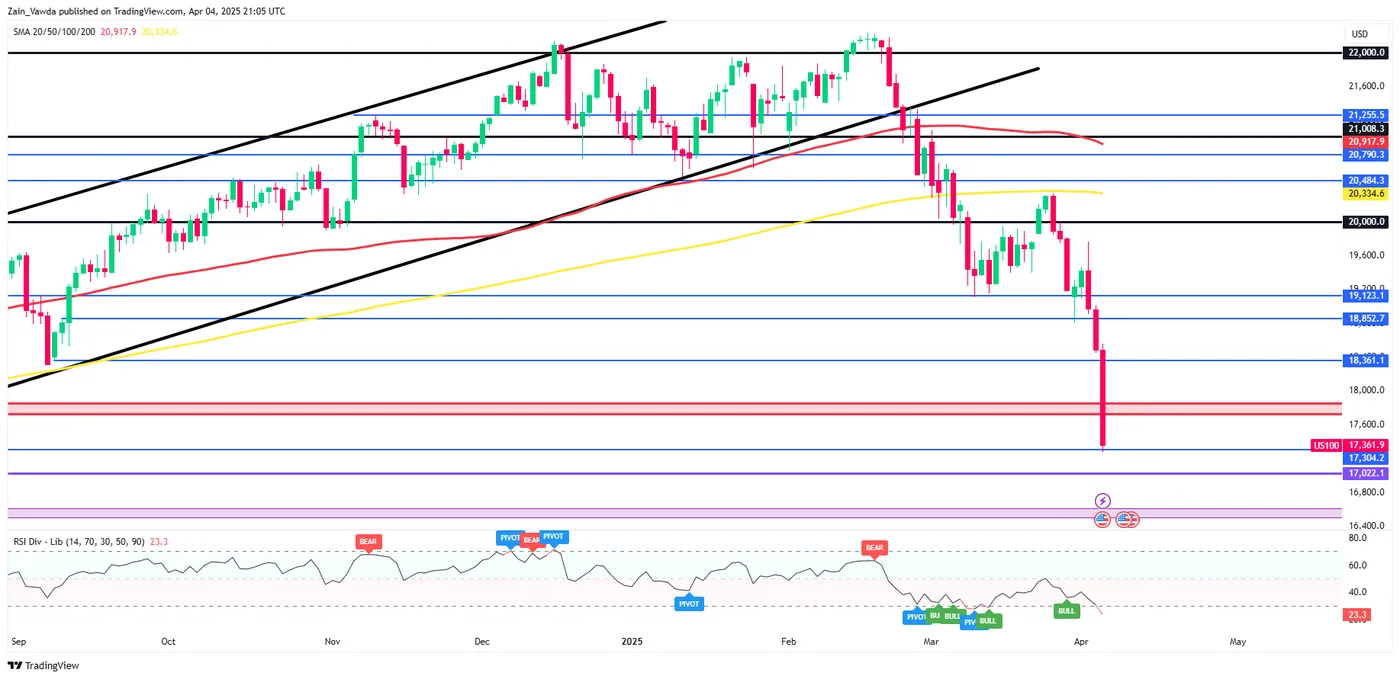
This week's focus shifts to the Nasdaq 100 which has now dropped over 20% from its all-time highs signaling a bear market.
The nasdaq is currently resting at an area of support around 17304 and finished the week with 3 successive days of losses.
The period-14 RSI is now resting in oversold territory but as we know the RSI can remain in oversold territory for extended periods of time which means the bearish move may not be over.
This will also depend on how tariff developments shake up next week.
Immediate support rests at 17000 before the 16500 and 16000 handle comes into focus.
Resistance rests at around 17737 before the 18361 and 18852 handles come into focus.
Nasdaq 100 Daily Chart - April 4, 2025
Source: TradingView.Com (click to enlarge)
Key Levels to Consider:
Support
- 17000
- 16500
- 16000
Resistance
- 17737
- 18361
- 18852
The Weekly Bottom Line: A Return to Turbulent Times
Canadian Highlights
- Canada initially appeared to have dodged tariffs on Trump’s Liberation day. But still facing three separate tariff actions, Canada’s effective tariff rate is close to 10%.
- Canada’s job market is already starting to show some softness, with net job losses and a higher unemployment rate in March.
- The jobs data has shifted market expectations towards an interest rate cut in April. We think further support is needed for Canada’s economy.
U.S. Highlights
- The U.S. announced sweeping ‘reciprocal’ tariffs due to go into effect over the next week, with all countries exporting to the U.S. soon to be subject to double digit surcharges.
- The employment report for March showed 228k new jobs added, illustrating robust health in the labor market prior to the recent volatility.
- Federal Reserve officials, including Chair Powell, noted that recent tariffs would add upside risks to inflation.
Canada – Trump’s Tariffs Sideswipe Markets
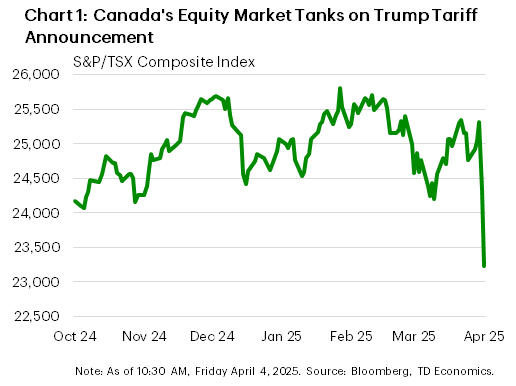
President Trump’s dreaded “Liberation Day”, saw the President make good on his campaign promise for a 10% universal tariff. Some countries received higher levies based on a bizarre calculation of trade “barriers” based on the size of the goods trade deficit with the U.S., with rates as high as 46% for Vietnam and 20% for the EU. Investor sentiment soured quickly; with many forecasters predicting the levies would tip the U.S. economy into recession. Global equity markets saw their largest one-day drops since 2020 on Thursday, with Toronto’s S&P TSX index dropping 3.8% (Chart 1). We don’t view this as an overreaction. We were not alone in pointing out that the market’s initial euphoria over Trump’s election win seemed to be favouring the economic positives of tax cuts and deregulation, rather than the disruption of upending 80 years of U.S. trade policy.
For Canada, there was some initial relief that we were not hit with any reciprocal tariff (see commentary). But zooming out, Canada already faces an effective tariff rate around 10%, depending on the degree of USMCA compliance among goods exports. Canada faces three separate 25% import tariffs: the 25% “fentanyl/illegal immigration” tariff, with 10% on energy and potash with a carve out for goods that are USMCA compliant, the 25% steel and aluminum tariff and a 25% tariff on finished vehicle imports. Fortunately, it is estimated that 80-90% of exports can become USMCA compliant, which would take down the effective tariff rate to roughly 4-5%. That is still double the 2% rate pre-Trump.
The current projected rate is only slightly lower than the 12.5% we assumed in our recent Quarterly Economic Forecast. If those tariffs remain in place for six months, Canada’s economy slips into a shallow recession.
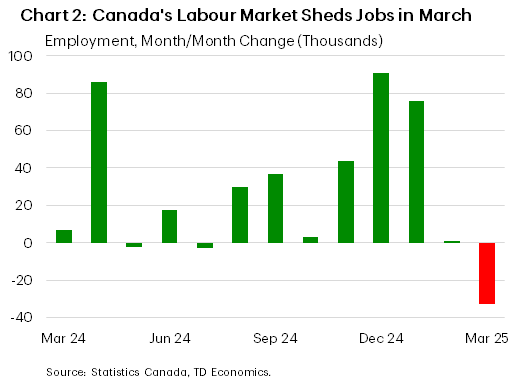
Canada’s job data for March reinforced a softer economic message. The labour market shed positions for the first time in more than three years (Chart 2), taking the unemployment rate higher by one tenth to 6.7%. There weren’t many silver linings in the report either. Job losses were in full-time positions in the private sector, and across most demographic groups. The share of people unemployed long-term also rose, and wage pressures eased. The job market may not be flashing red warning signs yet, but it is certainly yellow, and has softened significantly relative to the early post-pandemic period.
Looking at trends by sector, the losses in March were largest in the services sector, led by wholesale and retail trade (-29k; -1.0%), and information, culture and recreation (-20k; -2.4%). Although manufacturing (-7k; -0.4%) and construction (-4k; -0.2%) also saw job losses. Given the layoffs already announced in the auto sector this week, more are likely to come.
The Bank of Canada’s next interest rate announcement is on April 16th, and decision makers will still get to digest the BoC’s Business Outlook Survey and the March inflation report before then. Market odds of a rate cut increased sharply in the wake of the jobs data, to becoming the consensus view. We have argued that the Bank should cut rates further to support Canada’s economy in the face of the tariff threat, despite the risk of slightly higher inflation in the short run.
U.S. – A Return to Turbulent Times
We kicked off the second quarter this week with what has likely been the most anticipated day of the year so far. On it’s so-named ‘Day of Liberation’, the administration announced broad-based tariffs set to go into effect over the coming week. Equity markets and U.S. Treasury yields fell sharply over the following days on concerns over the economic impact of the policies. As of the time of writing, the S&P 500 is down 7.4% on the week, while the U.S. Treasury 10-year yield fell 33 basis-points (bps) to 3.93%.
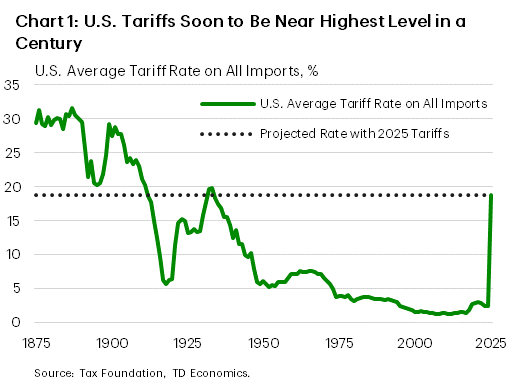
The tariffs announced by President Trump this week included a baseline 10% tariff on nearly every country that the U.S. trades with, scheduled to go into effect on April 5th, with varied upward revisions subsequently applied to 60 countries on April 9th. The latest tariffs will bring the effective tariff rate charged by the U.S. to its highest level in nearly a century (Chart 1). The countries likely to be the most impacted include China (which now faces a total stacked tariff rate of over 54%), the European Union (20%), and Vietnam (46%), although the effects, like the policy, are expected to be widespread. China has already announced that it will retaliate in equal force while the EU is preparing countermeasures. Some hope remains that negotiations can lead to the removal or some reduction of the tariffs before their full impact is felt, but for the time being it appears that we are witnessing the start of a trade war unlike any seen in generations.
Even before the most recent tariffs were announced, we were already starting to see some softening in the economic data. The ISM manufacturing and services purchasing manager indexes for March both showed a slowdown in demand and hiring activity, with business sentiment weakening on trade uncertainty. However, we have also seen consumers and businesses attempt to front-load purchases in advance of tariffs, with March vehicle sales hitting a four-year high and imports remaining more than 20% above year-ago levels through February.
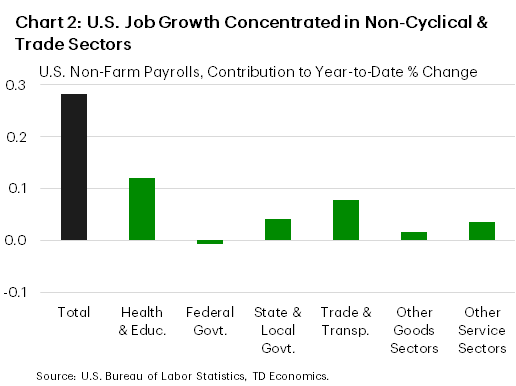
This behavior helped to keep the labor market healthy on aggregate in March, as 228k new jobs were added. Non-cyclical sectors, like health and education, as well as trade-exposed sectors contributed the lion’s share of the employment gains (Chart 2). While this was undoubtedly a solid report on the health of the labor market, we are likely to see some slowing in hiring over the coming months as trade policy uncertainty further weighs on business and consumer sentiment and tariffs begin to influence economic activity.
The next Federal Reserve meeting is still roughly a month away, but the views of Fed officials have likely become more consequential amid elevated uncertainty. During a presentation on Friday, Chair Powell noted that while the impact of tariffs remains uncertain, tariffs were likely to weigh on growth and raise inflation. As of the time of writing, markets are pricing in an 80% chance for 100bps in rate cuts by year-end. Next week’s CPI data release and the March FOMC meeting minutes will be parsed closely for further hints of the future direction of monetary policy as the administration’s ‘reciprocal’ tariffs are scheduled to come into effect. Assuming no changes occur between now and then, we will be entering a structurally different reality for global trade and finance.
Focus on Inflation Trends in Canadian Business Survey and U.S. CPI
Data in the coming week will be watched closely for impact from trade headwinds to prices in Canada and the U.S., following recent tariff announcements and progressively softening sentiment data.
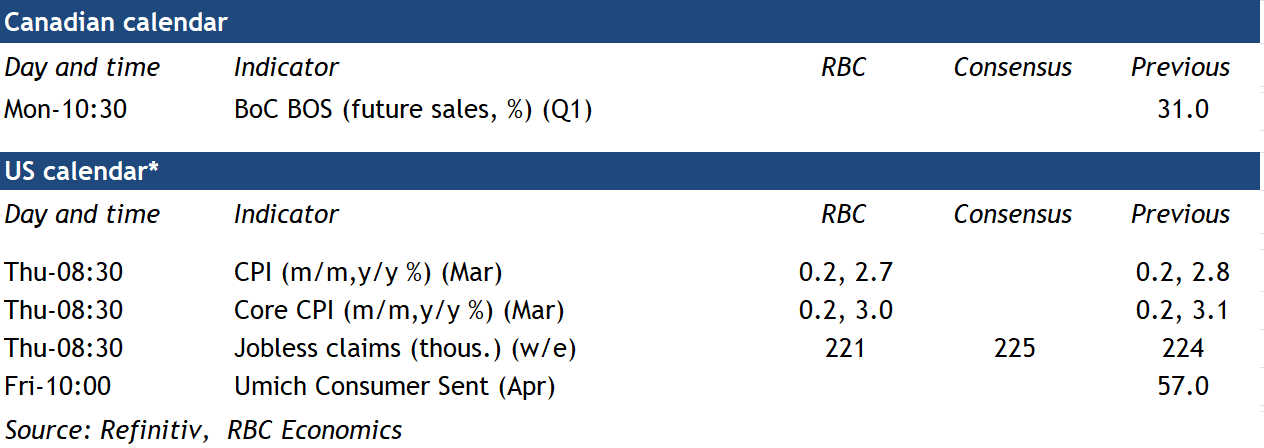
It is still likely too early to see significant increases in final U.S. consumer prices from tariffs. We anticipate a slower 0.2% month-over-month rise in both headline and core consumer price index measures in March. This will nudge both annual core and headline inflation down to 3% and 2.7%, respectively. Core goods inflation is likely to hold steady, still underperforming services sector inflation—at least for another month.
But there are already signs that tariffs have begun to push up costs earlier in the production cycle. The latest ISM manufacturing survey suggested the share of U.S. firms facing higher prices rose drastically in March. “Dramatic increases” were noted especially for steel and aluminum products thanks to related tariffs. We expect goods inflation in the U.S. may heat up in the months ahead.
In Canada, focus will be on the Q1 Bank of Canada Business Outlook Survey (BOS) conducted during February. The survey asked key questions on business sales outlook, capacity constraints, investment and hiring intentions as well inflation expectations amid escalating trade tensions.
Indeed, the Q2 results will likely be a stark contrast to the last iteration in Q4 when business sentiment was buoyed by large and consecutive interest rate cuts from the BoC and early signs of a recovery in domestic demand toward the end of last year. We expect the near-term outlook dimmed while businesses scaled back hiring and investment plans, especially for those in the trade-exposed manufacturing industries.
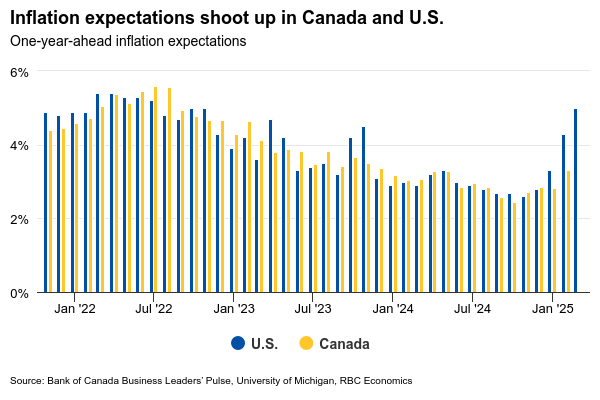
Businesses’ expectations for input cost and inflation pressures likely both rose, mirroring the early survey released alongside the last BoC interest rate announcement that showed plans among businesses to pass on a large chunk of tariff related cost increases to consumers.
Moving forward, the BoC and U.S. Federal Reserve will be watching trends on inflation, expectations and business pricing behaviour (expected frequency and size of future price adjustments) very closely to ensure tariff-related price increases do not turn into continuing high inflation.
Summary 4/7 – 4/11
Monday, Apr 7, 2025
| GMT | Ccy | Events | Consensus | Previous |
|---|---|---|---|---|
| 23:30 | JPY | Labor Cash Earnings Y/Y Feb | 3.10% | 2.80% |
| 05:00 | JPY | Leading Economic Index Feb P | 107.8 | 108.3 |
| 06:00 | EUR | Germany Industrial Production M/M Feb | -0.90% | 2.00% |
| 06:00 | EUR | Germany Trade Balance (EUR) Feb | 17.8B | 16.0B |
| 07:00 | CHF | Foreign Currency Reserves (CHF) Mar | 735B | |
| 08:30 | EUR | Eurozone Sentix Investor Confidence Apr | -8.7 | -2.9 |
| 09:00 | EUR | Eurozone Retail Sales M/M Feb | 0.50% | -0.30% |
| 14:30 | CAD | BoC Business Outlook Survey | ||
| 22:00 | NZD | NZIER Business Confidence Q1 | ||
| 23:50 | JPY | Current Account (JPY) Feb | 2.74T | 1.94T |
| GMT | Ccy | Events | |
|---|---|---|---|
| 23:30 | JPY | Labor Cash Earnings Y/Y Feb | |
| Forecast: 3.10% | Previous: 2.80% | ||
| 05:00 | JPY | Leading Economic Index Feb P | |
| Forecast: 107.8 | Previous: 108.3 | ||
| 06:00 | EUR | Germany Industrial Production M/M Feb | |
| Forecast: -0.90% | Previous: 2.00% | ||
| 06:00 | EUR | Germany Trade Balance (EUR) Feb | |
| Forecast: 17.8B | Previous: 16.0B | ||
| 07:00 | CHF | Foreign Currency Reserves (CHF) Mar | |
| Forecast: | Previous: 735B | ||
| 08:30 | EUR | Eurozone Sentix Investor Confidence Apr | |
| Forecast: -8.7 | Previous: -2.9 | ||
| 09:00 | EUR | Eurozone Retail Sales M/M Feb | |
| Forecast: 0.50% | Previous: -0.30% | ||
| 14:30 | CAD | BoC Business Outlook Survey | |
| Forecast: | Previous: | ||
| 22:00 | NZD | NZIER Business Confidence Q1 | |
| Forecast: | Previous: | ||
| 23:50 | JPY | Current Account (JPY) Feb | |
| Forecast: 2.74T | Previous: 1.94T | ||
Tuesday, Apr 8, 2025
| GMT | Ccy | Events | Consensus | Previous |
|---|---|---|---|---|
| 01:30 | AUD | NAB Business Confidence Mar | -1 | |
| 01:30 | AUD | NAB Business Conditions Mar | 4 | |
| 05:00 | JPY | Eco Watchers Survey: Current Mar | 45.3 | 45.6 |
| 06:45 | EUR | France Trade Balance (EUR) Feb | -6.2B | -6.5B |
| 10:00 | USD | NFIB Business Optimism Index Mar | 101.3 | 100.7 |
| 14:00 | CAD | Ivey PMI Mar | 53.2 | 55.3 |
| GMT | Ccy | Events | |
|---|---|---|---|
| 01:30 | AUD | NAB Business Confidence Mar | |
| Forecast: | Previous: -1 | ||
| 01:30 | AUD | NAB Business Conditions Mar | |
| Forecast: | Previous: 4 | ||
| 05:00 | JPY | Eco Watchers Survey: Current Mar | |
| Forecast: 45.3 | Previous: 45.6 | ||
| 06:45 | EUR | France Trade Balance (EUR) Feb | |
| Forecast: -6.2B | Previous: -6.5B | ||
| 10:00 | USD | NFIB Business Optimism Index Mar | |
| Forecast: 101.3 | Previous: 100.7 | ||
| 14:00 | CAD | Ivey PMI Mar | |
| Forecast: 53.2 | Previous: 55.3 | ||
Wednesday, Apr 9, 2025
| GMT | Ccy | Events | Consensus | Previous |
|---|---|---|---|---|
| 02:00 | NZD | RBNZ Interest Rate Decision | 3.50% | 3.75% |
| 05:00 | JPY | Consumer Confidence Index Mar | 34.9 | 35 |
| 06:00 | JPY | Machine Tool Orders Y/Y Mar P | 3.50% | |
| 14:00 | USD | Wholesale Inventories Feb F | 0.30% | 0.30% |
| 14:30 | USD | Crude Oil Inventories | 6.2M | |
| 18:00 | USD | FOMC Minutes | ||
| 23:01 | GBP | RICS Housing Price Balance Mar | 8% | 11% |
| 23:50 | JPY | Bank Lending Y/Y Mar | 3.10% | 3.10% |
| 23:50 | JPY | PPI Y/Y Mar | 3.90% | 4.00% |
| GMT | Ccy | Events | |
|---|---|---|---|
| 02:00 | NZD | RBNZ Interest Rate Decision | |
| Forecast: 3.50% | Previous: 3.75% | ||
| 05:00 | JPY | Consumer Confidence Index Mar | |
| Forecast: 34.9 | Previous: 35 | ||
| 06:00 | JPY | Machine Tool Orders Y/Y Mar P | |
| Forecast: | Previous: 3.50% | ||
| 14:00 | USD | Wholesale Inventories Feb F | |
| Forecast: 0.30% | Previous: 0.30% | ||
| 14:30 | USD | Crude Oil Inventories | |
| Forecast: | Previous: 6.2M | ||
| 18:00 | USD | FOMC Minutes | |
| Forecast: | Previous: | ||
| 23:01 | GBP | RICS Housing Price Balance Mar | |
| Forecast: 8% | Previous: 11% | ||
| 23:50 | JPY | Bank Lending Y/Y Mar | |
| Forecast: 3.10% | Previous: 3.10% | ||
| 23:50 | JPY | PPI Y/Y Mar | |
| Forecast: 3.90% | Previous: 4.00% | ||
Thursday, Apr 10, 2025
| GMT | Ccy | Events | Consensus | Previous |
|---|---|---|---|---|
| 01:30 | CNY | CPI M/M Mar | -0.20% | |
| 01:30 | CNY | CPI Y/Y Mar | 0.10% | -0.70% |
| 01:30 | CNY | PPI Y/Y Mar | -2.30% | -2.20% |
| 12:30 | CAD | Building Permits M/M Feb | -0.90% | -3.20% |
| 12:30 | USD | Initial Jobless Claims (Apr 4) | 222K | 219K |
| 12:30 | USD | CPI M/M Mar | 0.20% | 0.20% |
| 12:30 | USD | CPI Y/Y Mar | 2.60% | 2.80% |
| 12:30 | USD | CPI Core M/M Mar | 0.30% | 0.20% |
| 12:30 | USD | CPI Core Y/Y Mar | 3.10% | |
| 14:30 | USD | Natural Gas Storage | 29B | |
| 22:30 | NZD | Business NZ PMI Mar | 53.9 | |
| 23:50 | JPY | Money Supply M2+CD Y/Y Mar | 1.20% | 1.20% |
| GMT | Ccy | Events | |
|---|---|---|---|
| 01:30 | CNY | CPI M/M Mar | |
| Forecast: | Previous: -0.20% | ||
| 01:30 | CNY | CPI Y/Y Mar | |
| Forecast: 0.10% | Previous: -0.70% | ||
| 01:30 | CNY | PPI Y/Y Mar | |
| Forecast: -2.30% | Previous: -2.20% | ||
| 12:30 | CAD | Building Permits M/M Feb | |
| Forecast: -0.90% | Previous: -3.20% | ||
| 12:30 | USD | Initial Jobless Claims (Apr 4) | |
| Forecast: 222K | Previous: 219K | ||
| 12:30 | USD | CPI M/M Mar | |
| Forecast: 0.20% | Previous: 0.20% | ||
| 12:30 | USD | CPI Y/Y Mar | |
| Forecast: 2.60% | Previous: 2.80% | ||
| 12:30 | USD | CPI Core M/M Mar | |
| Forecast: 0.30% | Previous: 0.20% | ||
| 12:30 | USD | CPI Core Y/Y Mar | |
| Forecast: | Previous: 3.10% | ||
| 14:30 | USD | Natural Gas Storage | |
| Forecast: | Previous: 29B | ||
| 22:30 | NZD | Business NZ PMI Mar | |
| Forecast: | Previous: 53.9 | ||
| 23:50 | JPY | Money Supply M2+CD Y/Y Mar | |
| Forecast: 1.20% | Previous: 1.20% | ||
Friday, Apr 11, 2025
| GMT | Ccy | Events | Consensus | Previous |
|---|---|---|---|---|
| 06:00 | EUR | Germany CPI M/M Mar F | 0.30% | 0.30% |
| 06:00 | EUR | Germany CPI Y/Y Mar F | 2.20% | 2.20% |
| 06:00 | GBP | GDP M/M Feb | 0.10% | -0.10% |
| 06:00 | GBP | Industrial Production M/M Feb | 0.10% | -0.90% |
| 06:00 | GBP | Industrial Production Y/Y Feb | -1.50% | |
| 06:00 | GBP | Manufacturing Production M/M Feb | 0.20% | -1.10% |
| 06:00 | GBP | Manufacturing Production Y/Y Feb | -1.50% | |
| 06:00 | GBP | Index of Services 3M/3M Feb | 0.50% | 0.40% |
| 06:00 | GBP | Goods Trade Balance (GBP) Feb | -17.9B | -17.8B |
| 12:30 | USD | PPI M/M Mar | 0.20% | 0.00% |
| 12:30 | USD | PPI Y/Y Mar | 3.20% | |
| 12:30 | USD | PPI Core M/M Mar | 0.30% | -0.10% |
| 12:30 | USD | PPI Core Y/Y Mar | 3.40% | |
| 14:00 | USD | UoM Consumer Sentiment Apr P | 55 | 57 |
| 14:00 | USD | UoM Inflation Expectations Apr P | 5.00% |
| GMT | Ccy | Events | |
|---|---|---|---|
| 06:00 | EUR | Germany CPI M/M Mar F | |
| Forecast: 0.30% | Previous: 0.30% | ||
| 06:00 | EUR | Germany CPI Y/Y Mar F | |
| Forecast: 2.20% | Previous: 2.20% | ||
| 06:00 | GBP | GDP M/M Feb | |
| Forecast: 0.10% | Previous: -0.10% | ||
| 06:00 | GBP | Industrial Production M/M Feb | |
| Forecast: 0.10% | Previous: -0.90% | ||
| 06:00 | GBP | Industrial Production Y/Y Feb | |
| Forecast: | Previous: -1.50% | ||
| 06:00 | GBP | Manufacturing Production M/M Feb | |
| Forecast: 0.20% | Previous: -1.10% | ||
| 06:00 | GBP | Manufacturing Production Y/Y Feb | |
| Forecast: | Previous: -1.50% | ||
| 06:00 | GBP | Index of Services 3M/3M Feb | |
| Forecast: 0.50% | Previous: 0.40% | ||
| 06:00 | GBP | Goods Trade Balance (GBP) Feb | |
| Forecast: -17.9B | Previous: -17.8B | ||
| 12:30 | USD | PPI M/M Mar | |
| Forecast: 0.20% | Previous: 0.00% | ||
| 12:30 | USD | PPI Y/Y Mar | |
| Forecast: | Previous: 3.20% | ||
| 12:30 | USD | PPI Core M/M Mar | |
| Forecast: 0.30% | Previous: -0.10% | ||
| 12:30 | USD | PPI Core Y/Y Mar | |
| Forecast: | Previous: 3.40% | ||
| 14:00 | USD | UoM Consumer Sentiment Apr P | |
| Forecast: 55 | Previous: 57 | ||
| 14:00 | USD | UoM Inflation Expectations Apr P | |
| Forecast: | Previous: 5.00% | ||
Weekly Economic & Financial Commentary: A User’s Guide to Reciprocal Tariffs
Summary
United States: Liberation Day
- The echoes of reciprocal tariffs are reverberating through markets, raising expectations for Fed cuts and driving down yields. Tariff anticipation also drove an expansive U.S. trade deficit in February and increased price pressures in the manufacturing and services sector. Although risks to the outlook are elevated, the labor market remains solid at present, adding 228K jobs on net in March.
- Next week: NFIB (Tue.), CPI (Thu.), Consumer Sentiment (Fri.)
International: Meanwhile Everywhere Else...
- While new U.S. tariffs were the primary talk of the town in recent days, we also got a read on economic sentiment and monetary policy in several foreign economies. Sentiment data from China and Japan were somewhat encouraging, while the Reserve Bank of Australia and Colombia's central bank, BanRep, both opted to hold rates steady. Eurozone inflation data were generally favorable.
- Next week: Mexico CPI (Wed.), Reserve Bank of India Policy Rate (Thu.), Norway CPI (Thu.)
Credit Market Insights: The Widening Gyre
- Corporate bond spreads widened substantially Thursday in a repricing of recession risk following President Trump's tariff announcements. Spreads on investment grade corporate bonds widened by 8 bps to 102 bps and spreads for riskier high yield bonds increased more than 50 bps to 387 bps. The widening in the spreads was the worst one-day move for investment grade bonds since the bank failures in March 2023, and the worst one-day move for high yield bonds since the onset of the pandemic in the spring of 2020.
Topic of the Week: A User's Guide to Reciprocal Tariffs
- The Trump administration announced sweeping new tariffs on many U.S. trading partners this week. The administration utilized a formula primarily based on each nation's trade balance to derive the new tariff rates. By our estimates, the overall U.S. effective tariff rate now stands at 23%, the highest in many decades.