Sample Category Title
AUD/USD Daily Report
Daily Pivots: (S1) 0.5907; (P) 0.6120; (R1) 0.6252; More...
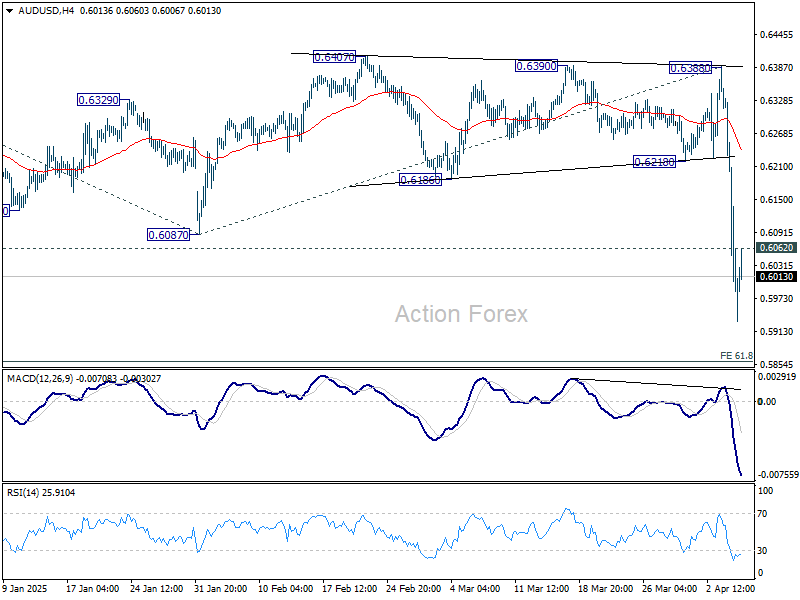
Intraday bias in AUD/USD stays on the downside for the moment. Current fall from 0.6941 should target 61.8% projection of 0.6941 to 0.6087 from 0.6388 at 0.5860. On the upside, above 0.6062 minor resistance will turn intraday bias neutral and bring consolidations first.
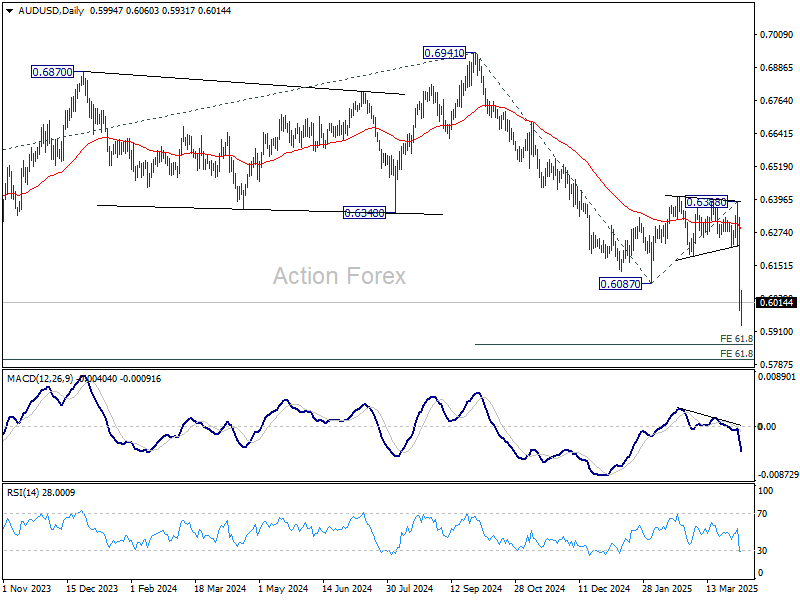
In the bigger picture, fall from 0.6941 (2024 high) is seen as part of the down trend from 0.8006 (2021 high). Next medium term target is 61.8% projection of 0.8006 to 0.6169 from 0.6941 at 0.5806. In any case, outlook will stay bearish as long as 0.6388 resistance holds.
Markets Crumble as Trump Doubles Down on Tariffs, Trade Storm Intensifies
The global stock market crash showed no sign of slowing today. Hong Kong’s Hang Seng Index returned from a holiday break and promptly plunged over -10% to catch up with last week’s global carnage. Meanwhile, Japan’s Nikkei suffered another dramatic drop of more than -2200 points, or -6.6%.
Risk aversion remains the dominant theme as markets digest the full implications of the rapidly escalating trade war. Despite the equity bloodbath, currency markets were relatively calm. Most major pairs and crosses pulled back inside Friday’s ranges after brief spikes.
Fueling the unease, US President Donald Trump showed no sign of backing away from his aggressive tariff agenda. Over the weekend, he defended the tariffs, likening them to “medicine to fix something” and insisted that countries wishing to avoid the duties must pay the US “a lot of money on a yearly basis.” Treasury Secretary Scott Bessent added that more than 50 countries have opened negotiations with Washington since last week’s announcement, suggesting Trump’s strategy is drawing some to the table.
Indeed, some notable trade partners are quickly moving to avoid being caught in the crosshairs. Taiwan’s President Lai Ching-te offered to remove trade barriers and match US tariffs with zero duties, while also pledging increased Taiwanese investment in America. That follows Vietnam’s similar proposal last week, raising the possibility that some nations could strike bilateral deals that eliminate tariffs entirely.
The next few days will be critical. Traders are watching closely to see if any of these bilateral talks bear fruit — specifically, whether they lead to a genuine dismantling of trade barriers. On the other hand, if the US uses these negotiations to extract unrelated concessions, trust may erode further, heightening fears of a full-blown trade conflict.
The path taken by Taiwan and Vietnam could become a model or a dead-end, depending on how Washington responds. The situation remains extremely fluid as US customs began collecting the baseline 10% tariffs over the weekend, with higher country-specific rates kicking in Wednesday.
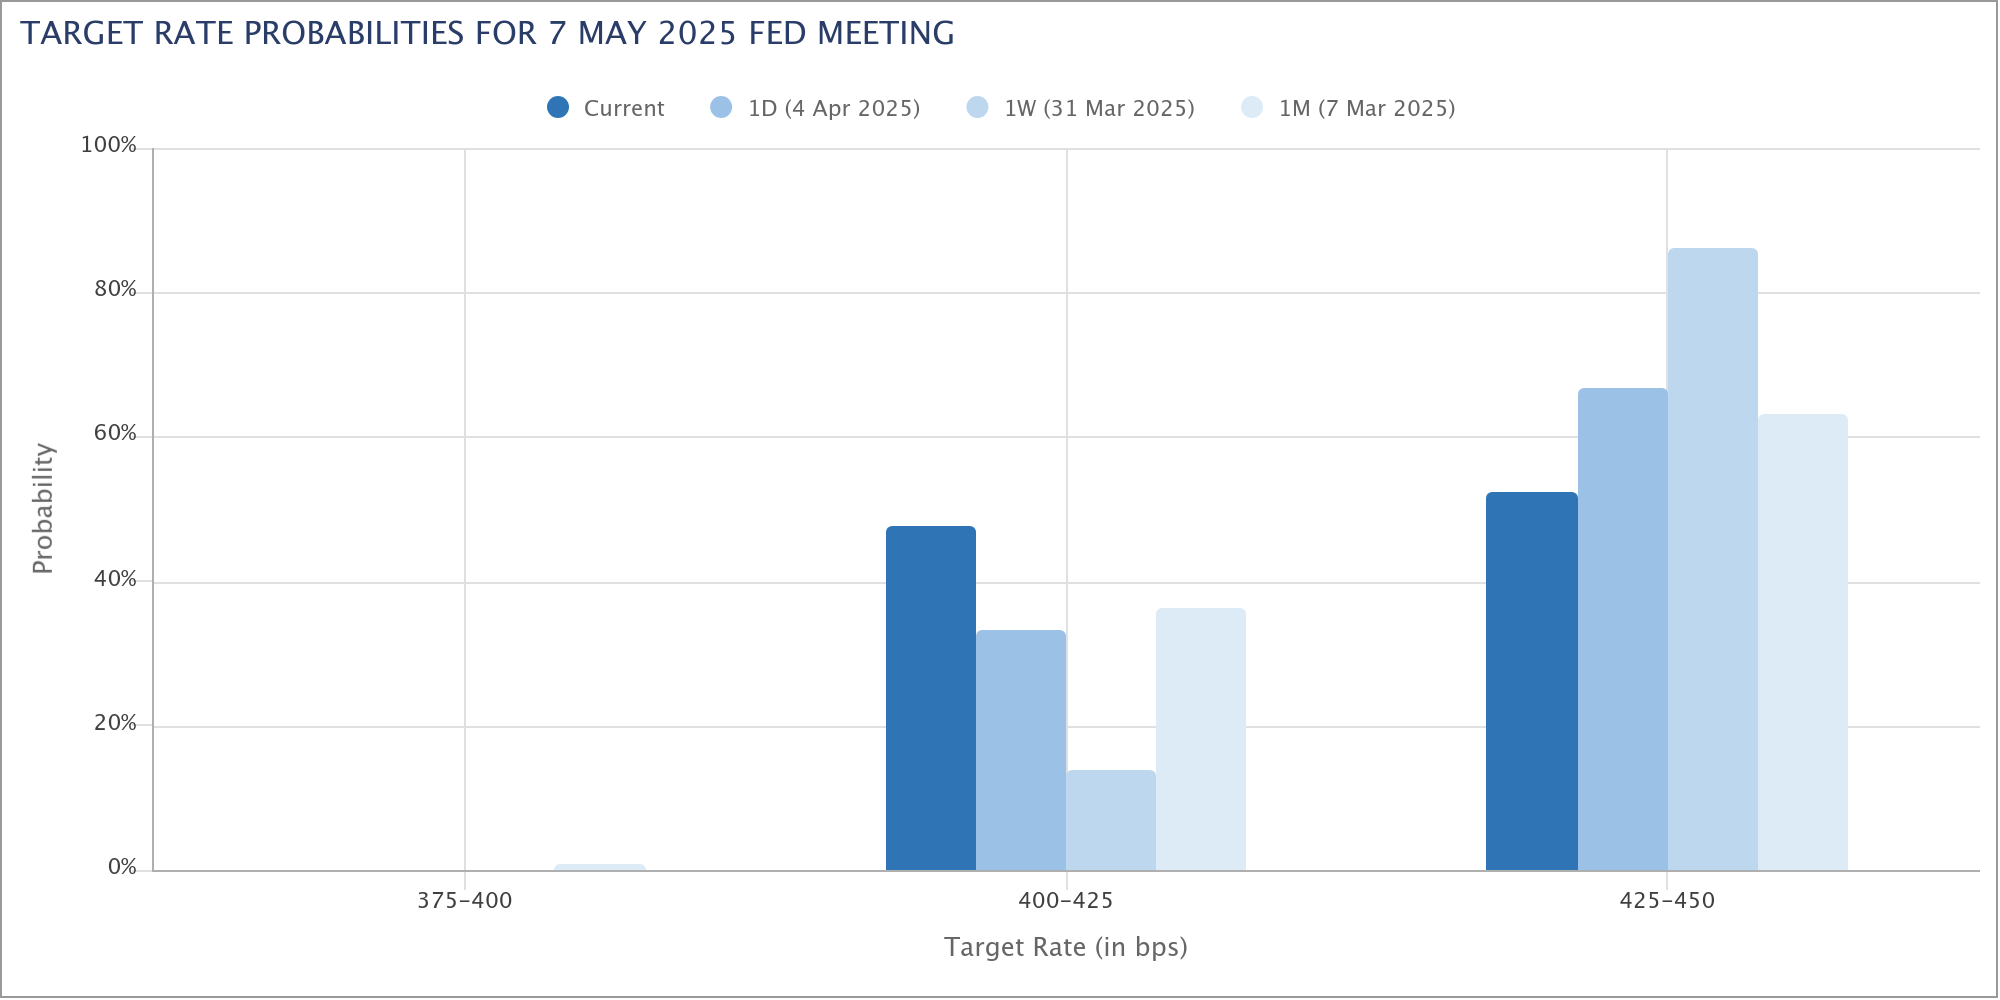
Fed will also be back in the spotlight, with the March FOMC minutes, CPI data, and fresh commentary from policymakers due. Up until last week, Fed officials were signaling a cautious, wait-and-see approach on rate cuts. But the financial market rout has dramatically altered expectations, with Fed funds futures now pricing in nearly a 50% chance of a 25bps cut in May — up from just 14% a week ago.
A soft CPI print or any hint of dovish pivot in tone from Fed could further fuel expectations of imminent easing—though it would also raise concern that Fed is bracing for deeper economic damage from the trade war
In Asia, at the time of writing, Nikkei is down -5.99%. Hong Kong HSI is down -10.50%. China Shanghai SSE is down -6.39. Singapore Strait Times is down -7.85%. Japan 10-year JGB yiield is down -0.037 at 1.119.
Japan’s real wages fall again despite nominal pay boost from bonuses
Japan’s nominal wages rose 3.1% yoy in February, a notable jump from downwardly revised 1.8%yoy in January, matching expectations.
However, this strong print was largely driven by a surge in special payments, which skyrocketed 77.4% yoy. Regular pay, considered a more stable indicator of wage trends, actually slowed to 1.6% yoy from the prior month’s 2.1% yoy, signaling only moderate momentum in base salary growth.
Despite the upbeat headline figure, real wages—which adjust for inflation—fell for the second consecutive month, down -1.2% yoy. This came as consumer inflation, as calculated by the labor ministry, remained elevated at 4.3% yoy, down slightly from January’s 4.7% yoy.
Gold rebounds from sub-3000 dip as market panic deepens in Asia
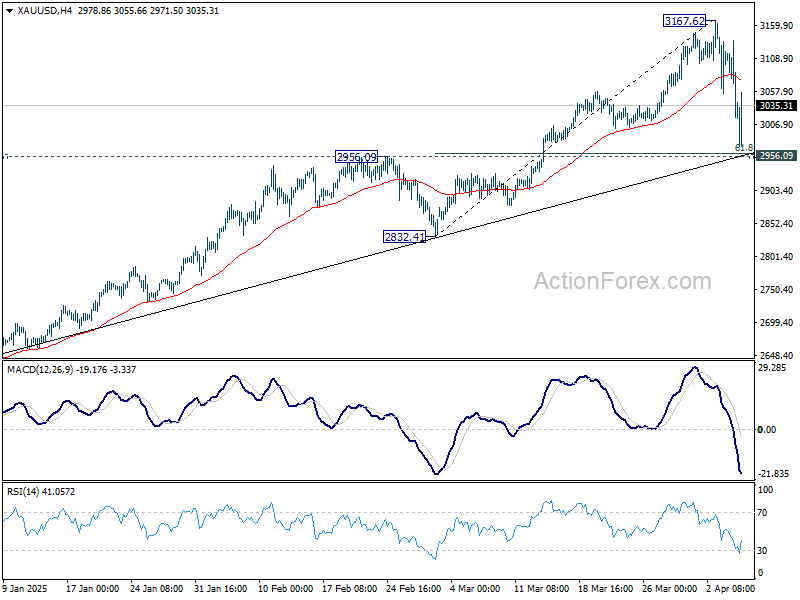
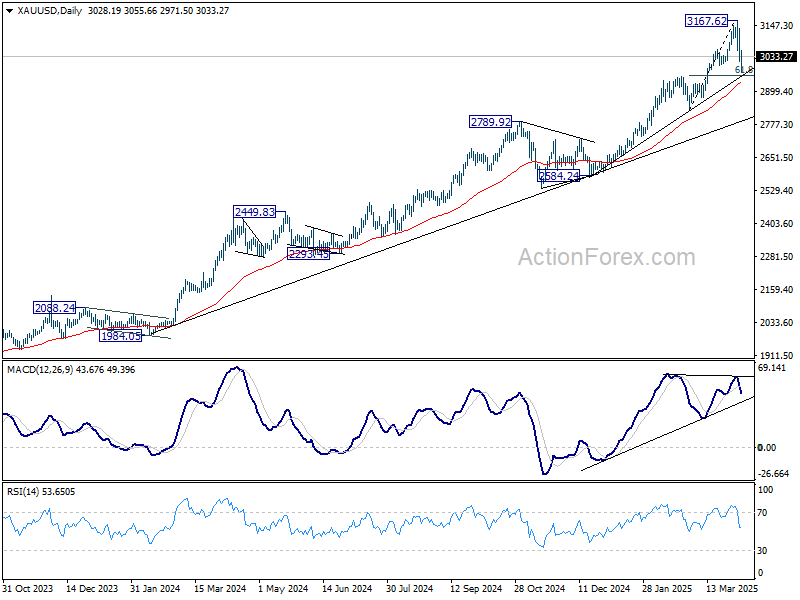
Gold had a shaky start to the week, being dragged below 3000 psychological level briefly, alongside broader risk asset liquidation. But as stock markets across Asia extended their crash into Monday, the precious metal caught some safe haven flows and bounced back above 3030 quickly.
Meanwhile, a critical 2950/60 zone appears to be providing strong support for Gold too. Reaction to this zone would unveil whether the intensifying global trade tensions and deepening equity losses are re-anchoring Gold as a defensive asset.
The 2950/60 zone marks the confluence of 2956.09 resistance turned support, 38.2% retracement of 2832.41 to 3167.62 at 2960.46, and trend line support at 2957.62.
Technically, break above 55 4H EMA (now at 3075.81) will set the range for sideway consolidations. That would also keep outlook bullish for extending the long term up trend at a later stage.
However, sustained break of 2950/60 will argue that Gold is also in medium term correction, with risk of falling back to 2584.24/2789.92 support zone.
WTI oil breaches 60 as trade war and OPEC+ output plans weigh
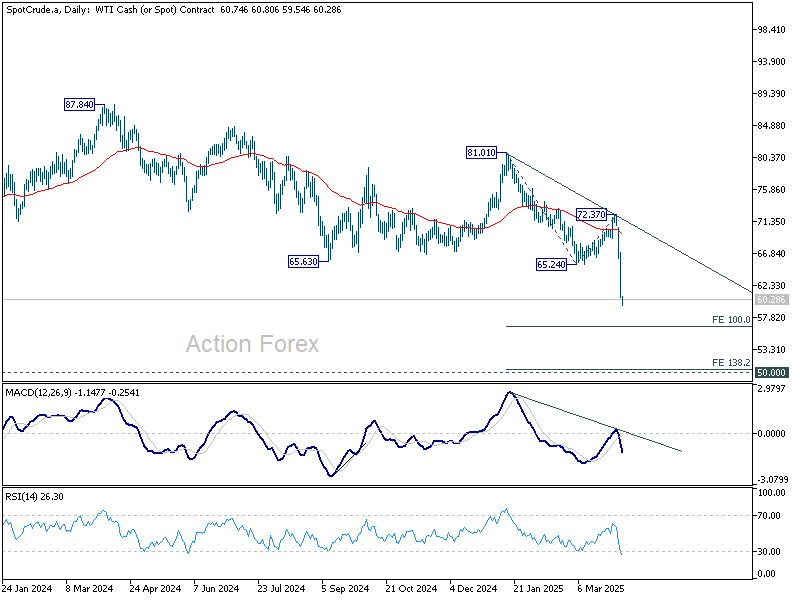
Oil prices extended their steep losses in Asian trading today, with WTI crude briefly dipping below the psychological level of 60 for the first time in nearly four years.
The persistent global equity selloff and deepening concerns over the economic fallout from the trade war have triggered fears about demand destruction, which remains difficult to quantify. Until there’s clarity on how much global consumption will be impacted, markets are likely to remain under pressure.
Adding to the bearish tone, OPEC+ announced last week that it would advance the timeline for increasing output, with plans to raise production by 411,000 barrels per day starting in May, compared to the previous plan of just 135,000 bpd. The supply boost, at a time of growing demand concerns, is exacerbating the imbalance and fueling the sharp price decline.
Technically, WTI oil might find some support at 100% projection of 81.01 to 65.24 from 72.37 at 56.60 to form a short term bottom. However, firm break of 56.60 could quickly push WTI towards 50 psychological level to 138.2% projection at 50.57.
Fed's patience faces test with inflation and consumer sentiment; RBNZ to cut again
The week ahead is packed with key US economic releases and a major central bank decision in New Zealand, all set against the backdrop of escalating global tariff tensions.
Fed is clearly stuck between a rock and a hard place. This week's US CPI data might show a slowdown in both headline and core readings. However, with core reading still hovering around 3%, and risk of tariffs boosting inflation in the near term, there is little room for Fed to rush to resume policy easing.
Meanwhile, markets, business and consumer sentiment has clearly deteriorated to an extent that recession risks are now real. The University of Michigan’s consumer sentiment index will offer a timely snapshot of how households are responding to the reciprocal tariffs that dominated headlines over the past two weeks. The survey window, March 25 through April 7, overlaps with the US announcement and China's retaliatory move, making it a valuable real-time pulse check on inflation expectations and confidence.
FOMC minutes are not expected to deliver any surprises. Markets will be keen to learn how much weight the Committee gave to tariff risks during its March discussions. But of course, with reciprocal tariffs now implemented, any earlier assessments may already be outdated. Nevertheless, insights into the range of views within Fed could help shape expectations for the timing of the next policy move.
On the central banking front, RBNZ is widely expected to cut its policy rate by 25 bps to 3.50%. This move would be in line with RBNZ’s February guidance, which projected two cuts in the first half of the year to keep inflation within the 1–3% target range. The bank sees 3.00% as the neutral rate, meaning policy will remain mildly restrictive even after the cut. Unless economic conditions have materially changed, a deviation from this path would be surprising.
However, markets will also be watching how the RBNZ responds to recent global turmoil. The US has slapped a 10% tariff on all New Zealand exports, yet Prime Minister Christopher Luxon has stated that New Zealand will not retaliate. Whether the RBNZ views this as a meaningful threat to growth or simply a policy headwind to monitor could influence how aggressively it plans to ease in the second half of the year.
Here are some highlights for the week:
- Monday: Japan labor cash earnings; Germany industrial production, trade balance; Swiss foreign currency reserves; Eurozone retail sales, Sentix investor confidence; Canada BOC business outlook survey.
- Tuesday: Australia Westpac consumer sentiment, NAB business confidence; US NFIB small business index; Canada Ivey PMI.
- Wednesday: RBNZ rate decision' Japan consumer confidence; US FOMC minutes.
- Thursday: Japan PPI; China CPI, PPI; US CPI, jobless claims.
- Friday: New Zealand BNZ manufacturing; Germany CPI final; UK GDP, production, trade balance; US PPI, U of Michigan consumer sentiment.
AUD/USD Daily Report
Daily Pivots: (S1) 0.5907; (P) 0.6120; (R1) 0.6252; More...
Intraday bias in AUD/USD stays on the downside for the moment. Current fall from 0.6941 should target 61.8% projection of 0.6941 to 0.6087 from 0.6388 at 0.5860. On the upside, above 0.6062 minor resistance will turn intraday bias neutral and bring consolidations first.
In the bigger picture, fall from 0.6941 (2024 high) is seen as part of the down trend from 0.8006 (2021 high). Next medium term target is 61.8% projection of 0.8006 to 0.6169 from 0.6941 at 0.5806. In any case, outlook will stay bearish as long as 0.6388 resistance holds.
WTI oil breaches 60 as trade war and OPEC+ output plans weigh
Oil prices extended their steep losses in Asian trading today, with WTI crude briefly dipping below the psychological level of 60 for the first time in nearly four years.
The persistent global equity selloff and deepening concerns over the economic fallout from the trade war have triggered fears about demand destruction, which remains difficult to quantify. Until there’s clarity on how much global consumption will be impacted, markets are likely to remain under pressure.
Adding to the bearish tone, OPEC+ announced last week that it would advance the timeline for increasing output, with plans to raise production by 411,000 barrels per day starting in May, compared to the previous plan of just 135,000 bpd. The supply boost, at a time of growing demand concerns, is exacerbating the imbalance and fueling the sharp price decline.
Technically, WTI oil might find some support at 100% projection of 81.01 to 65.24 from 72.37 at 56.60 to form a short term bottom. However, firm break of 56.60 could quickly push WTI towards 50 psychological level to 138.2% projection at 50.57.
EUR/USD Trims Gains, Can This Support Hold?
Key Highlights
- EUR/USD started a downside correction from the 1.1145 level.
- A connecting bullish trend line is forming with support at 1.0840 on the 4-hour chart.
- GBP/USD dipped heavily below the 1.3050 and 1.3000 levels.
- Gold prices corrected gains and traded below the $3,050 level.
EUR/USD Technical Analysis
The Euro faced a strong rejection near 1.1150 against the US Dollar. EUR/USD started a major decline below the 1.1050 and 1.1000 levels.
Looking at the 4-hour chart, the pair traded below the 50% Fib retracement level of the upward move from the 1.0732 swing low to the 1.1146 high. However, the pair is still above the 100 simple moving average (red, 4-hour) and the 200 simple moving average (green, 4-hour).
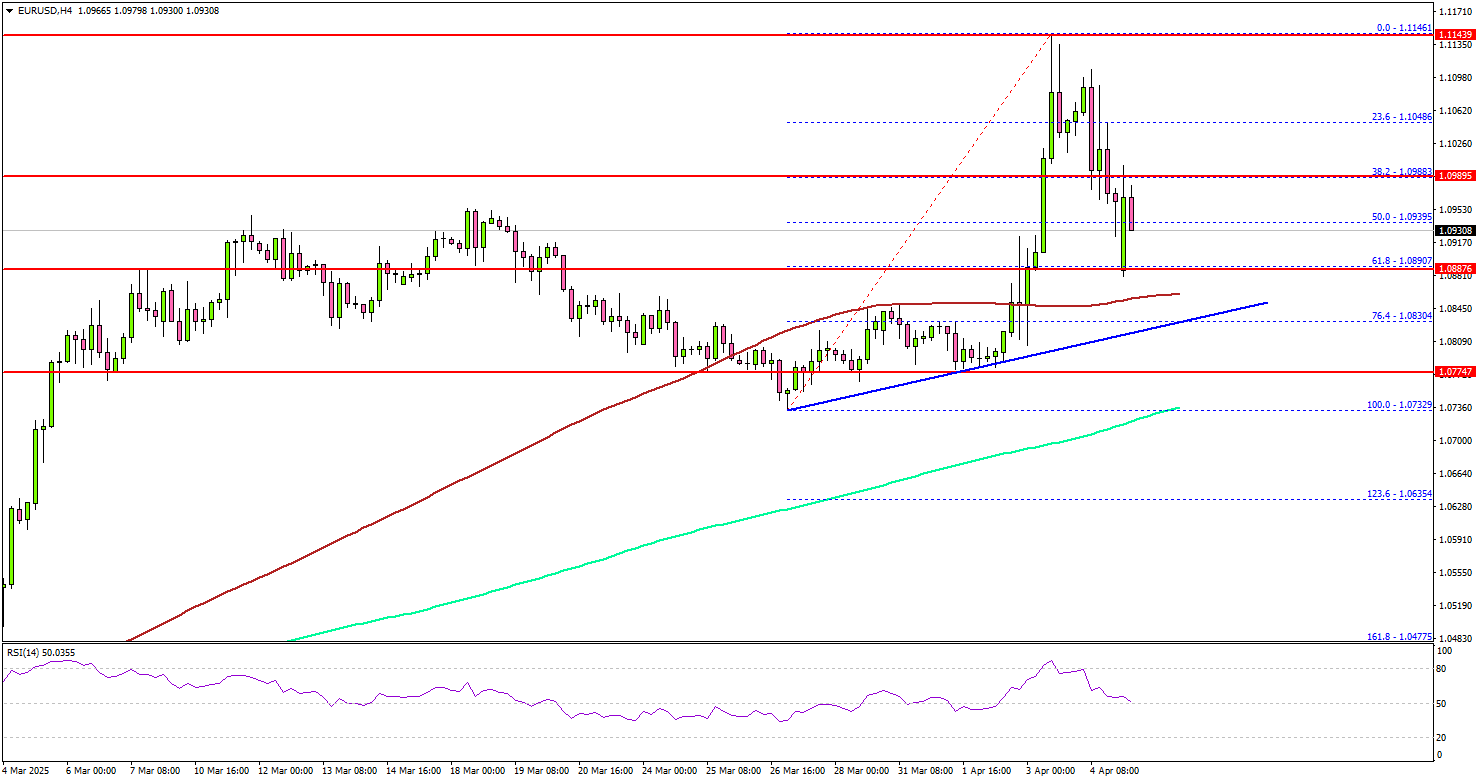
There is also a connecting bullish trend line forming with support at 1.0840 on the same chart. If there is a fresh increase, the pair could face resistance near the 1.0980 level.
The next major resistance is near the 1.1050 level. The main resistance is now forming near the 1.1150 zone. A close above the 1.1150 level could set the tone for another increase. In the stated case, the pair could even clear the 1.1200 resistance.
On the downside, immediate support sits near the 1.0840 level. The next key support sits near the 1.0820 level. Any more losses could send the pair toward the 1.0750 level.
Looking at Gold, the price started a sharp downside correction and there was a clear move below the $3,050 level.
Upcoming Economic Events:
- Euro Zone Retail Sales for Feb 2025 (MoM) - Forecast +0.5%, versus -0.3% previous.
Gold rebounds from sub-3000 dip as market panic deepens in Asia
Gold had a shaky start to the week, being dragged below 3000 psychological level briefly, alongside broader risk asset liquidation. But as stock markets across Asia extended their crash into Monday, the precious metal caught some safe haven flows and bounced back above 3030 quickly.
Meanwhile, a critical 2950/60 zone appears to be providing strong support for Gold too. Reaction to this zone would unveil whether the intensifying global trade tensions and deepening equity losses are re-anchoring Gold as a defensive asset.
The 2950/60 zone marks the confluence of 2956.09 resistance turned support, 38.2% retracement of 2832.41 to 3167.62 at 2960.46, and trend line support at 2957.62.
Technically, break above 55 4H EMA (now at 3075.81) will set the range for sideway consolidations. That would also keep outlook bullish for extending the long term up trend at a later stage.
However, sustained break of 2950/60 will argue that Gold is also in medium term correction, with risk of falling back to 2584.24/2789.92 support zone.
Japan’s real wages fall again despite nominal pay boost from bonuses
Japan’s nominal wages rose 3.1% yoy in February, a notable jump from downwardly revised 1.8%yoy in January, matching expectations.
However, this strong print was largely driven by a surge in special payments, which skyrocketed 77.4% yoy. Regular pay, considered a more stable indicator of wage trends, actually slowed to 1.6% yoy from the prior month’s 2.1% yoy, signaling only moderate momentum in base salary growth.
Despite the upbeat headline figure, real wages—which adjust for inflation—fell for the second consecutive month, down -1.2% yoy. This came as consumer inflation, as calculated by the labor ministry, remained elevated at 4.3% yoy, down slightly from January’s 4.7% yoy.
Nikkei 225 Wave Analysis
Nikkei 225: ⬇️ Sell
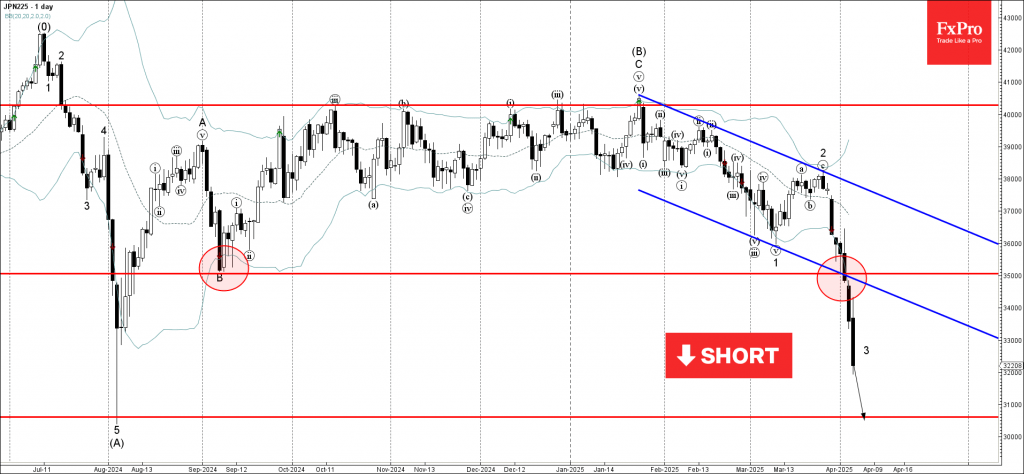
- Nikkei 225 broke support zone
- Likely to fall to support level 30600.00
The Nikkei 225 index recently broke the support zone located at the intersection of the support level 35000.00 (former monthly low from September) and the support trendline of the daily down channel from January.
The breakout of this support zone accelerated the active downward impulse wave 3 of the higher-order impulse wave (C) from January.
The Nikkei 225 index can be expected to fall to the next support level 30600.00 (former major support from August of 2024).
Gold Wave Analysis
Gold: ⬇️ Sell
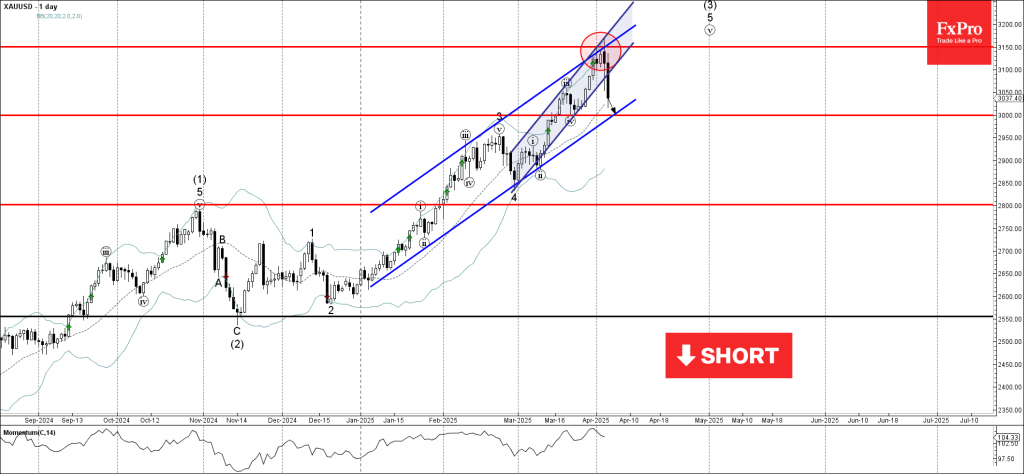
- Gold broke daily up channel
- Likely to fall to support level 3000.00
Gold recently reversed down from the resistance level 3150.00 (which formed the daily Bearish Engulfing) and broke the sharp daily up channel from February.
The breakout of this up channel added to the bearish pressure on Gold – accelerating the active downward correction to the higher-order impulse wave (3) from November.
Gold can be expected to fall to the next round support level 3000.00 (which stopped the previous short-term correction iv).
EUR/USD Weekly Outlook
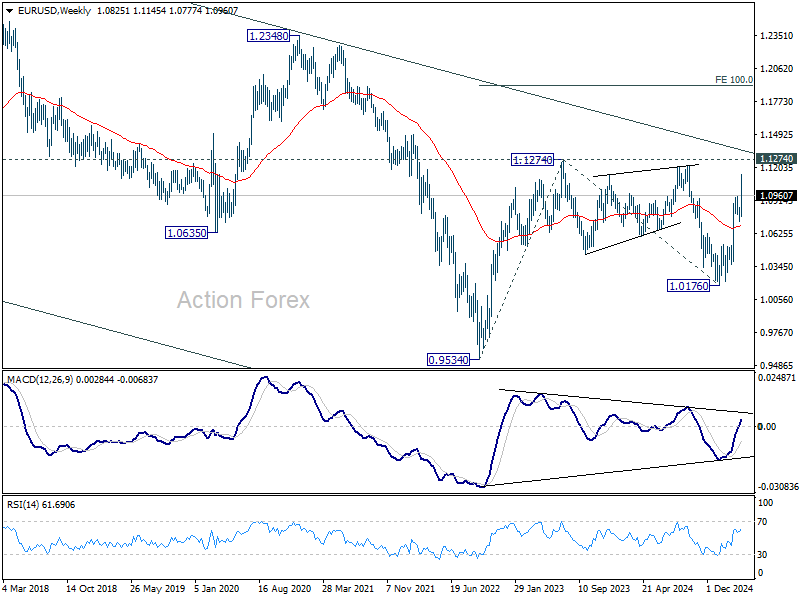
EUR/USD's rally from 1.0176 resumed last week and spiked higher to 1.1145. But a temporary top was formed there with subsequent retreat. Initial bias remains neutral this week for consolidations. Downside of retreat should be contained by 38.2% retracement of 1.0176 to 1.1145 at 1.0775 to bring rebound. Above 1.1145 will target 1.1213/74 key resistance zone next.
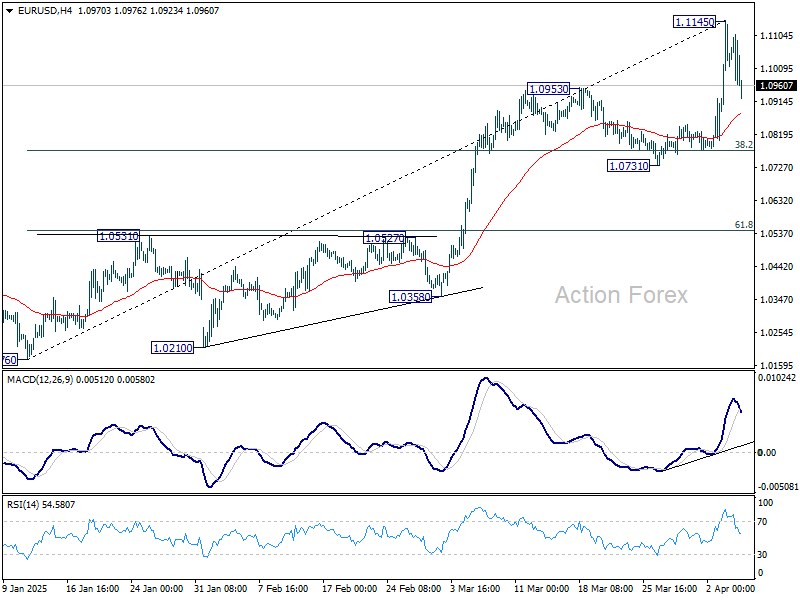
In the bigger picture, fall from 1.1274 (2024 high) has completed as a three wave correction to 1.0176. Rise from 0.9534 ready to resume. Decisive break of 1.1274 will target 100% projection of 0.9534 to 1.1274 from 1.0176 at 1.1916. Also, that will send EUR/USD through the multi-decade channel resistance will carries larger bullish implication. This will now be the favored case as long as 1.0731 support holds.
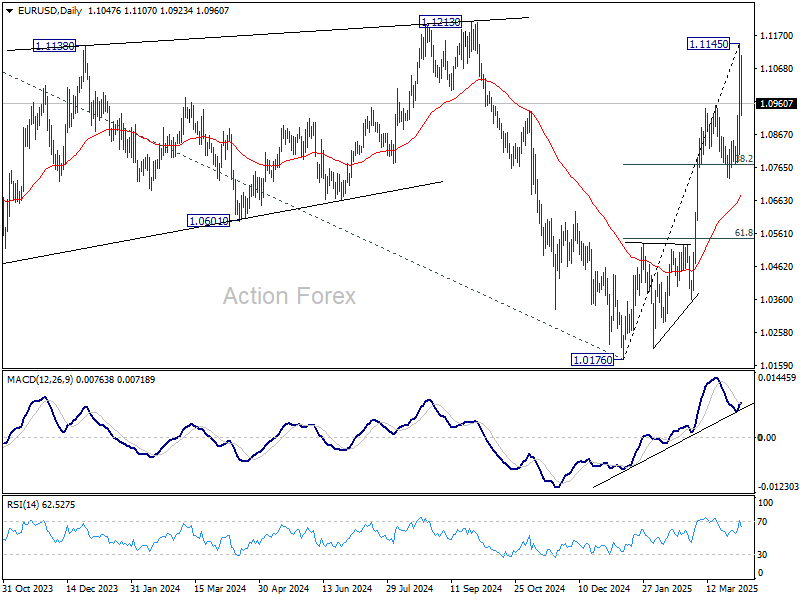
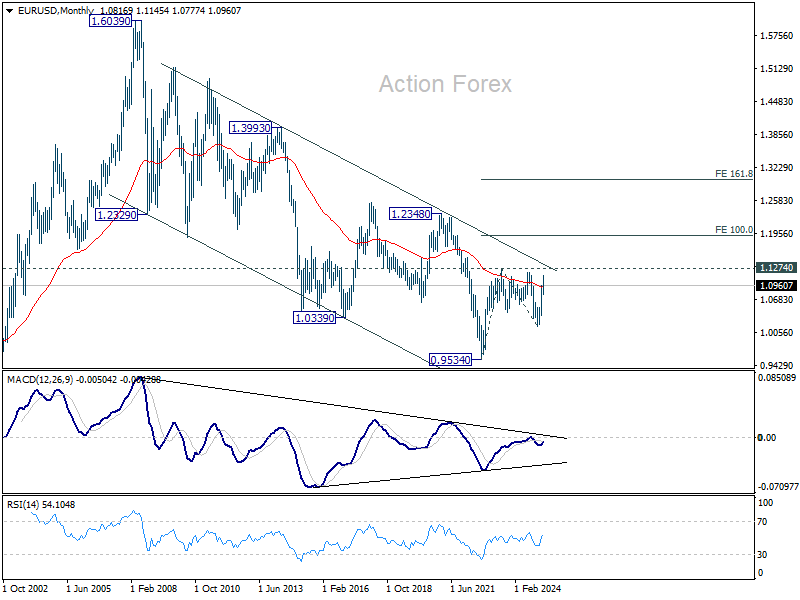
In the long term picture, the case of long term bullish reversal is building up. Sustained break of falling channel resistance (now at around 1.1350) will argue that the down trend from 1.6039 (2008 high) has completed at 0.9534. A medium term up trend should then follow even as a corrective move. Nevertheless, rejection by the channel resistance will keep outlook bearish.