Sample Category Title
Week Ahead – US CPI and RBNZ Decision on Tap Amidst Tariff Mayhem
- Dollar traders await US CPI data amid global trade turbulence.
- RBNZ to cut by 25bps, could maintain dovish stance.
- China’s CPI and PPI to reveal tariff impact on inflation.
- Strong UK GDP data could help the pound climb higher.
Trump’s “Liberation Day” increases recession fears
The dollar suffered against all its major peers this week, while equites extended their bloodbath after US President Donald Trump announced more aggressive-than-anticipated tariffs on US trading partners.
Trump stated that his administration will proceed with a 10% baseline tariff on all imports to the US, while higher duties will be imposed on some of the nation’s biggest trading partners. For example, China was hit with a new 34% levy on top of the already imposed 20%, while closer allies like Japan and the UK were not exempted, with the former facing a 24% tariff rate and the latter the baseline 10%. The European Union will be subject to a 20% rate. The base 10% tariffs will go into effect on April 5 and the higher reciprocal rates on April 9, and both China and the EU were quick to respond that if those tariffs take effect, they will retaliate.
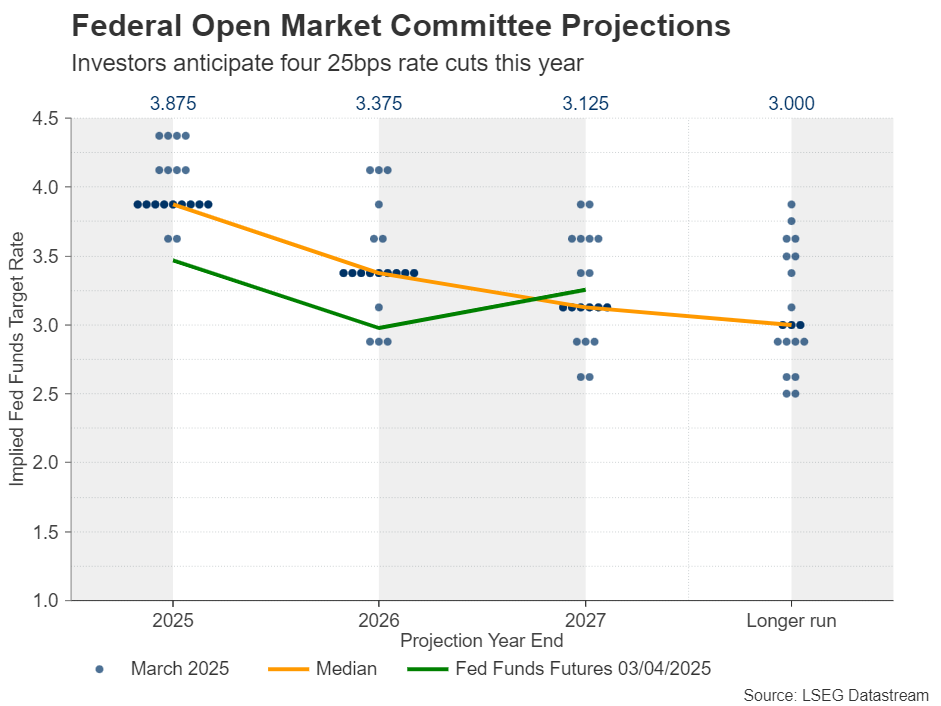
With the Atlanta Fed GDPNow model already pointing to a severe 3.7% contraction of the US economy, investors have become even more fearful about a potential recession this year, which is also evident by the fact that they have ramped up their Fed rate cut bets, despite the central bank sticking to its prior projection of 50bps worth of reductions for this year. Currently, investors are pricing in nearly 100bps worth of cuts by December, which translates into four quarter-point cuts.
Will sticky inflation complicate the Fed’s job
With all that in mind, dollar traders will fix their attention on the US CPI data for March, due out on Thursday. Tariffs are not only posing a threat to economic activity but also presenting an upside risk to inflation. Inflation in the US has been proving more persistent than expected, even before tariffs on steel and aluminium were incorporated into the calculation, with the core PCE index for February rising to 2.8% y/y.
This further complicates the Fed’s work as it may find itself between a rock and a hard place – trying to safeguard economic activity on the one hand and prevent inflation from spiralling out of control on the other. With the prices subindex of the ISM manufacturing PMI for March climbing to 69.4 from 62.4, the risks of the CPIs appear skewed to the upside.
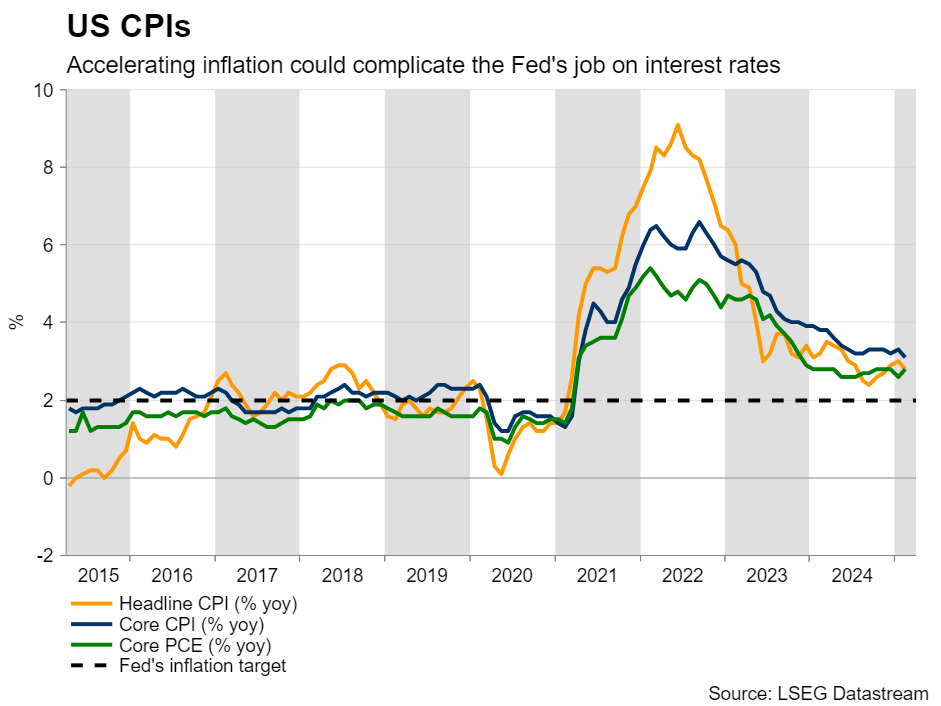
Further acceleration may prompt traders to scale back some of their rate cut bets, and the dollar may stage a modest rebound alongside US Treasury yields. However, higher borrowing costs for longer could risk an even deeper recession down the line. Thus, with recession fears still elevated, any recovery in the US dollar could prove both limited and short-lived.
The minutes from the March 18-19 FOMC decision will be published on Wednesday, the PPI numbers for March on Thursday, and the preliminary University of Michigan (UoM) consumer sentiment index for April on Friday. Given that the latest Fed meeting took place before the April 2 tariff announcements – and bearing in mind that new economic projections, including a new dot plot, were released – the minutes may not draw significant market attention. Investors may instead focus more on additional signs of where inflation may be headed. Thus, beyond the CPI numbers, the PPI data and the UoM inflation expectations could also act as key market movers.
RBNZ set to cut rates, focus to fall on guidance
There is also a central bank deciding on monetary policy next week and that’s the Reserve Bank of New Zealand (RBNZ). At its latest gathering on February 19, this central bank lowered its benchmark interest rate by 50bps, signalling the likelihood of more reductions in the coming months and projecting that rates will be around 3% by year-end – 75bps below the current level of 3.75%. Officials also cited global uncertainties and domestic economic risks relating to US President Trump’s trade policies.
Since then, the only noteworthy economic data released from New Zealand have been the retail sales and GDP prints for Q4, both of which exceeded expectations. Yet, investors believe that the Bank should implement an additional 90bps in rate cuts before the end of the year.
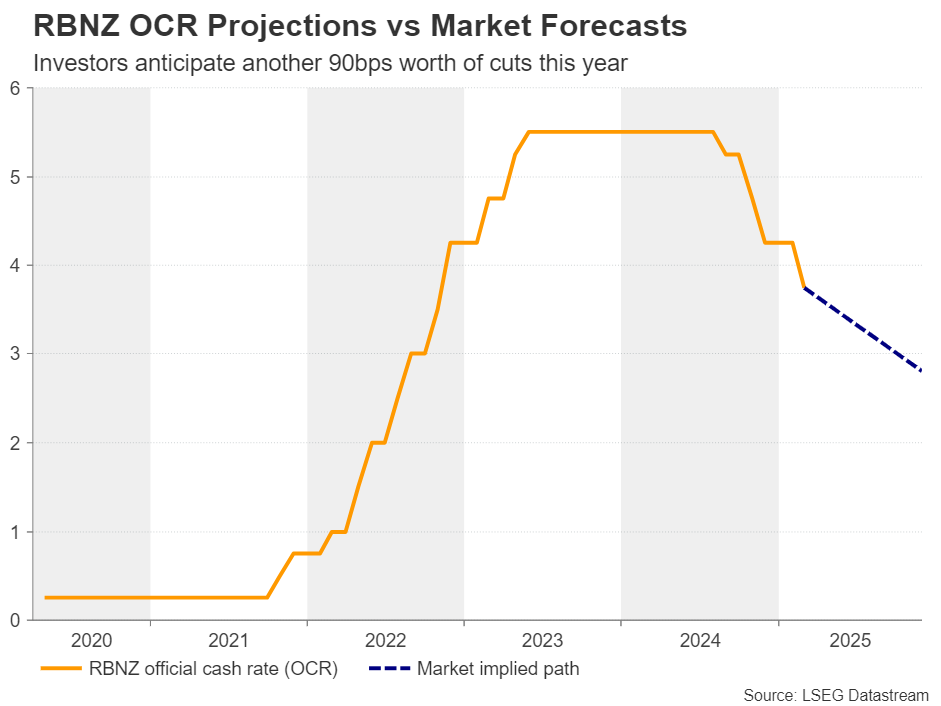
With China, New Zealand’s main trading partner, being Trump’s primary focus when it comes to tariffs, it is difficult to envision a scenario where the RBNZ adopts a less dovish tone than it did previously. Market participants are nearly certain about a 25bps cut at this gathering, with the probability of a back-to-back quarter-point reduction in May standing at 75%.
Taking all this into account and considering the heightened risk that the trade war between the US and China could further escalate if China retaliates, the RBNZ may once again accompany its rate decision with a clear signal of its readiness to continue easing. This would likely encourage kiwi sellers to extend their positions.
China inflation and UK GDP also on the agenda
Speaking of China, during the Asian morning on Thursday, the world’s second-largest economy will release its CPI and PPI numbers for March and traders may be eagerly waiting to see the impact of the tariffs announced back on March 4 on consumer prices.
From the UK, the monthly GDP for February is due to be released on Friday, alongside the industrial and manufacturing production figures for the same month. UK data has been coming in slightly better than expected, with GDP for Q4 revealing moderate expansion despite forecasts of contraction. However, the monthly reading for January showed negative growth. The composite PMI improved in March, and retail sales for February significantly exceeded expectations.
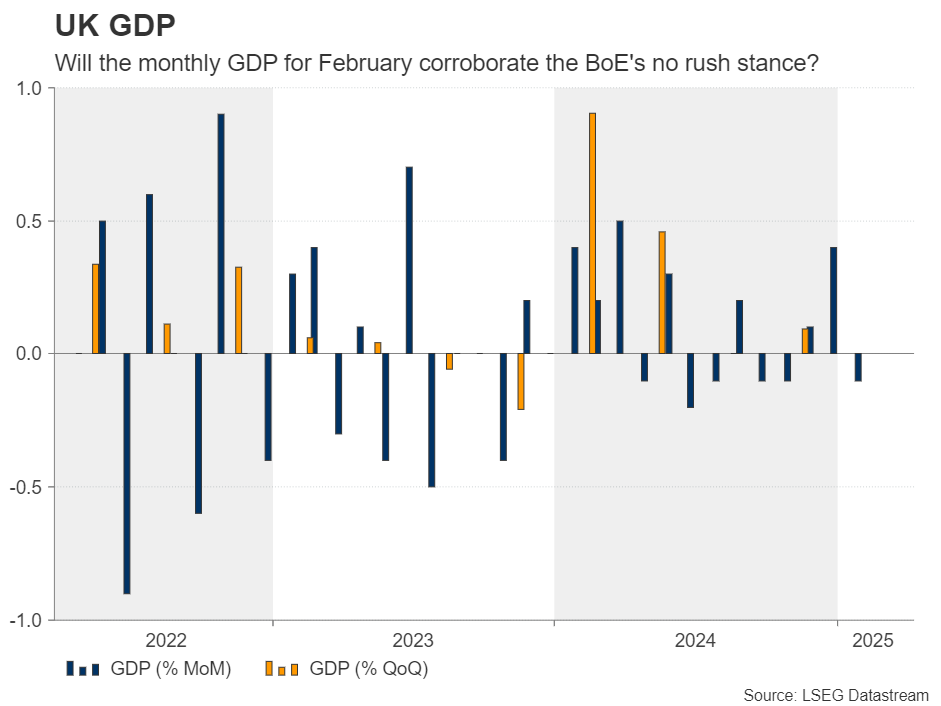
Combined with the fact that UK inflation remains elevated despite slowing somewhat in February, the overall economic outlook supports the Bank of England’s stance that there is no urgency to cut rates aggressively, especially after the UK was subject only to the US baseline 10% tariff. However, market participants are still assigning a high 85% probability to a 25bps reduction at the next decision on May 8. Therefore, a strong set of data may be required to reduce that probability and allow the pound to gain further ground.
Weekly Focus – Promising Macro Data Drowns in Trade War Chaos
Liberation Day was the dominant theme in markets and the key driver this week. The escalation of the trade war turned out to be more extensive than what was expected by most analysts and priced in by investors. As a result, global equities nosedived with the US deepest in red, yields declined and oil prices took a big hit, not just from the perspectives of a demand shock but also more supply as OPEC+ announced an output hike in May.
Betting markets now price above 50% probability of a US recession in 2025. This is also reflected in the FX market where the fear of recession overshadows the technical USD strengthening from increased tariffs. As a result, EUR/USD traded back above 1.10 for the first time since early October. JPY and CHF were the two natural outperformers.
The reciprocal tariff on EU goods will be 20%. Using estimates from the ECB-GLOBAL 2.0 model we estimate that the increase in tariffs will shave off 0.2-0.4 percentage points of euro area GDP in the coming year assuming that recent tariffs are unchanged in the entire period on all countries and there is retaliation. Retaliatory tariffs will of course be inflationary in Europe, but we expect the negative shock to the global economy will offset this, leading to lower prices, if anything. March HICP inflation declined to 2.2% as the underlying price pressure remains largely in line with the inflation target. The labour market still shows no signs of cracking as unemployment hit a new record low of 6.1% despite obvious German weakness. Even if ECB hawks did push back on ECB pricing, we still think conditions are in place for another rate cut in April. No scheduled data has the potential to move that picture much.
US tariffs on China are set to move to 65-70% on average according to our calculations, which will deal a serious hit to Chinese growth. This comes as both official and private PMIs indicate that stimulus is starting to kick in with manufacturing activity picking up in March.
Elsewhere in Asia, sthe Japanese Tankan business survey aimed nicely with Bank of Japan's cautious hiking cycle as non-manufacturing business conditions hit its highest since 1991. Inflation expectations edged higher on all horizons as the outlook for wage growth this year continues to look strong. A next hike already by the end of the month should be off the table for now, though, with the new tariffs, which will be particularly tough on Japanese car manufacturers.
Next week, we will continue to keep a close eye on the trade war, including potential deals or retaliation plans. The trade war escalation will to some extent be reflected in Euro Sentix, released on Monday and to a larger extent in US consumer sentiment released on Friday, where inflation expectations, which are already sky-high, will take key focus. We also get actual March US inflation data, which follows the comforting February release after a January price spike. Of course, US inflation will attract much attention going forward.
Sunset Market Commentary
Markets
Day two of the ‘US liberation era‘ was much like day one. The global risk-off continued unabatedly as investors try to the make-up their mind on the multiple consequences/further fall-out from the US profoundly recalibrating the global framework on free trade by announcing reciprocal tariffs. Almost zero visibility on how this process will continue keeps investors looking for shelter. European equities extended losses and investors assumed that mounting recession risks will force central banks to again come to the rescue, with core yields on a firm downtrend. At the least the assumption that further negative dominoes were likely to fall, was confirmed almost immediately. Around noon CET, China announced retaliation for the 34% US ‘base-line’ tariff on Chinese imports, matching it with a similar levy on US imports. In addition, the country announced export restrictions on rare earths and launched an anti-dumping probe, amongst other measures. The risk sell-off accelerated. Usually, on the first Friday of a new month, the US payrolls reports takes center stage. Today, it was no more than a footnote for trading. The US economy in March added a solid 228k jobs, admittedly with a 48k downward revision for the previous to months. The unemployment rate rose from 4.1% to 4.2%, but this was due to a higher participation rate. Average hourly earnings was close to expectations (0.3% M/M, 3.8% Y/Y). More than analyzing the payrolls, the market focus was on the cash open of US equity markets and on a first US reaction to the China retaliation. The market photo just after the open op US equity markets reads: US equities decline about 3.0 % for the major indices. The Eurostoxx 50 is also ceding about 4.0%. Treasuries and Bunds continue their assent, betting of CB help. US yield decline 9-10 bps across the curve. US money markets are discounting (more than) a full 25 bps Fed rate cut in June and a cumulative 100 bps EOY 2025. Bunds even outperform Treasuries with German yields declining from 15 bps (2-y) to 10 bps (30-y). Something to keep an eye on: After a period of extreme calm on intra-EMU government bond markets, 10-y spreads vs Bunds for the likes of Italy and Greece are widening about 6 bps. The USD sell-off is talking a breather. DXY (re)gains marginal ground (102.25). The EUR/USD rally also takes a pauze (1.103). The retaliation of China against the US also has further negative fall-out on the likes of the Aussie (AUD/USD 0.6125 from 0.6325) and kiwi dollar (NZD/USD 0.565 from 0.5795). To close this hectic week, markets still have at least one wildcard to look out for. Fed Chair Powell is scheduled to speaks on the economy around the close of European markets. Will he already give any hints on how the Fed assesses evolving risks between growth and inflation?
News & Views
The FAO Food Price Index was nearly unchanged in March, averaging at a 127.1 points, to be 6.9% lower y/y and down 20.7% from the peak exactly three years ago. On a headline basis, declines in cereals and sugar price offset increases of meat and vegetable oils. The dairy price index remained stable. Going more into detail, dropping wheat and maize prices amid improving crop conditions pushed down the cereals price index. Rice prices fell too on weak import demand and ample exportable supplies. Sugar prices generally fell on signs of weaker global demand and easing concerns over tight supplies. Meat prices increased primarily thanks to pig meat on rising demand. Ovine meat prices also increased, supported by strong global demand ahead of the Easter holidays. Meanwhile, poultry meat prices remained largely stable. The continued increase in the oil price index was driven by higher prices of palm (supply driven), soy (international demand driven), rapeseed and sunflower (both demand and supply) oils.
Canadian employment fell by 32.6k in March, driven exclusively by full time jobs (-62k). Part time employment still added 29.5k jobs. The decline in March followed little change in February and three consecutive months of growth in November, December and January totaling 211k. Employment declined in wholesale and retail trade (-29k), as well as information, culture and recreation (-20k). There were increases in the 'other services', such as personal and repair services (+12k) and utilities (+4.2k). The employment rate declined to 60.9% while the unemployment rate rose to 6.7%. The latter has now been above the pre-Covid average of 6% for exactly a year. Hourly wages grew by 3.5% y/y, easing from 4% in February. Overall, Canadian payrolls were sub-par and adds to the existing downward CAD pressure today. USD/CAD reverses much of yesterday’s steep decline to return north of 1.42. Money markets expect the Bank of Canada to continue cutting rates from the current 2.75% to around 2% by end this year.
Tariff Wars Made Dollar a Risky Asset
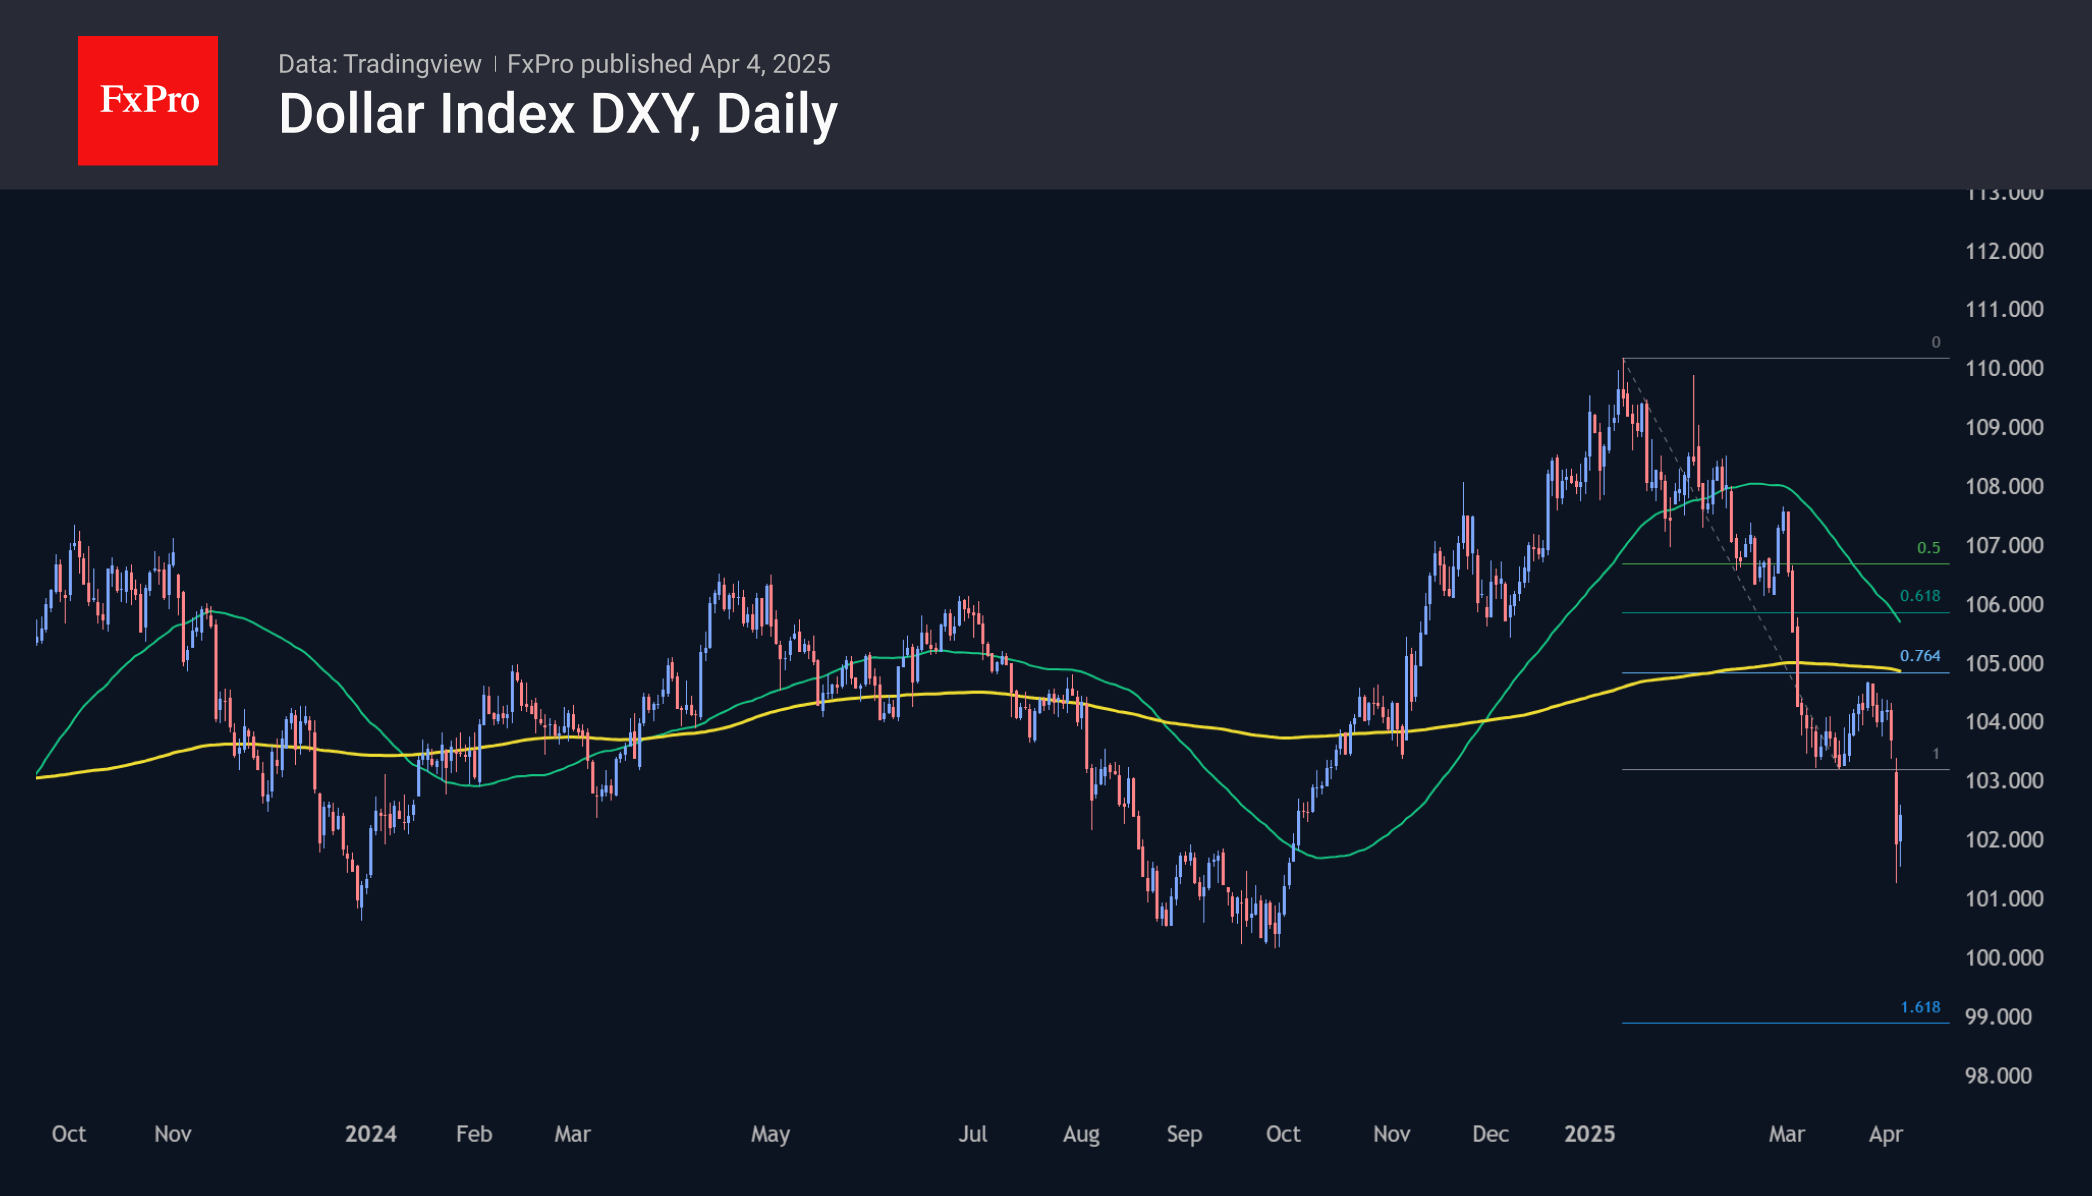
The fall in the U.S. dollar accelerated at the start of April as the shock of trade tariffs caused capital flight from U.S. assets. We don’t know yet how long this trend will be. In finance, it is often said, “America sneezes, and the world gets a fever.” Even if the problems originated in the US, the impact on the markets of other countries will be more substantial.
Dollar Index confirmed the prevailing downtrend.
The dollar index moved sharply below its previous support, confirming the prevailing downtrend. The technical target of the current drop now looks like the area from 99 to 100. The lower boundary represents the Fibonacci extension of the first impulse. The upper boundary passes through the psychologically significant round level, which stopped the dollar’s decline in September-October last year.
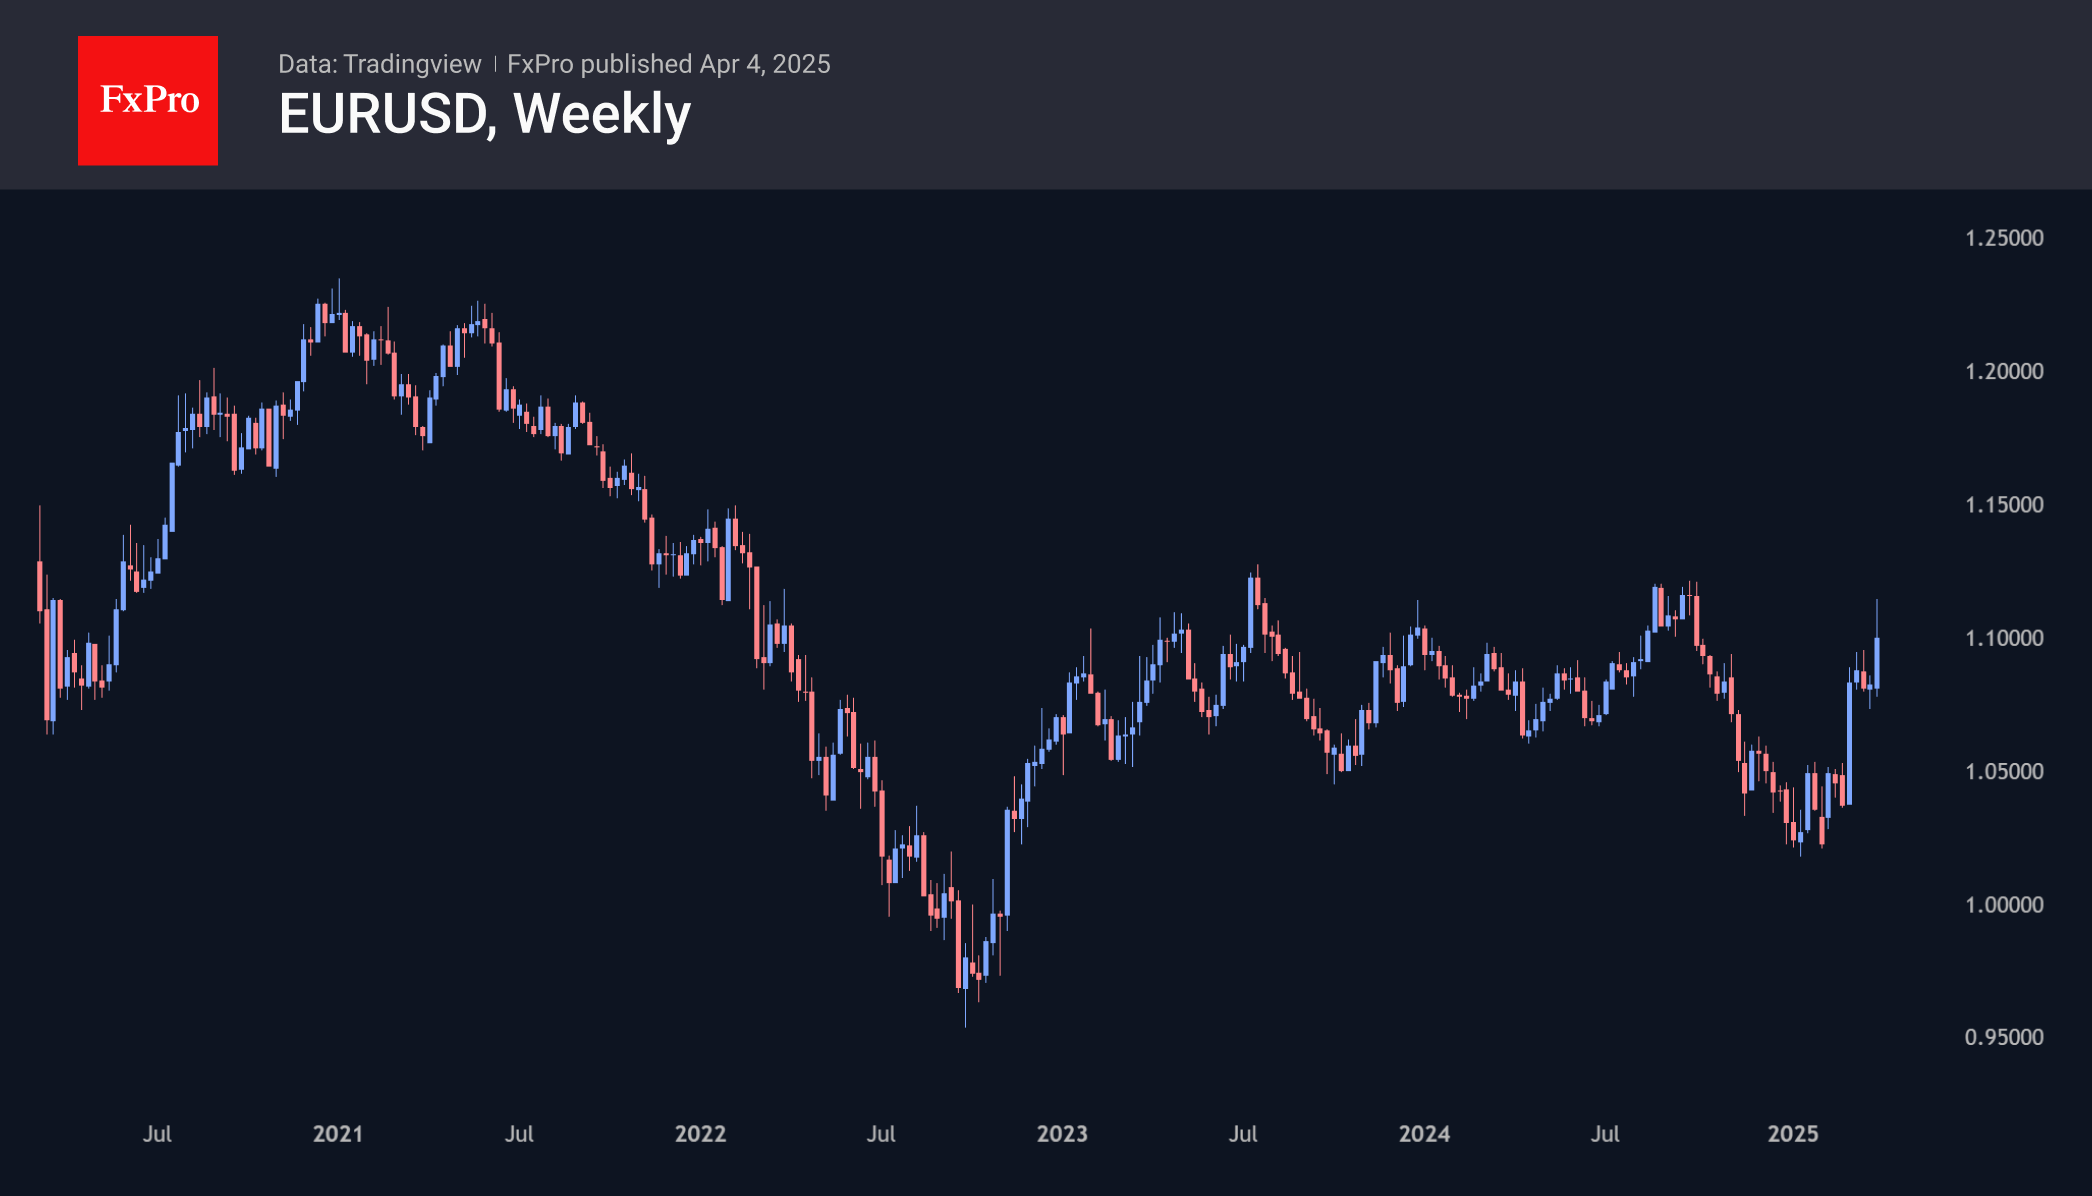
Among the dollar’s competitors, the euro and the yen are the biggest gainers so far. These are the next two largest capital markets after the dollar, where investors are hoping to weather the storm. The euro returned to local highs against the dollar and the pound. EURUSD has also been near the upper boundary of the trading range for the last three years, and it is ready to break it and move further up.
Canada Sheds Jobs in March as Tariffs Issue Their First Blow
The Canadian labour market shed 32.6k positions in March, driven by a decline full-time positions (-62k).
Job losses pushed the unemployment rate up 0.1 percentage point (ppt) to 6.7%. The labour force participation rate decreased by 0.1 ppt to 65.2%.
Employment by sector showed declines in trade exposed wholesale and retail trade sector (-29k), as well as culture and recreation (-20k). Personal and repair services saw a decent job gain of +12k.
Lastly, total hours worked recovered from a bad weather-induced fall in February (+0.4% on the month, from -1.3%). Meanwhile wages were up a stable 3.6% year-on-year (from 3.8% in February).
Key Implications
Has it begun? The impact of trade tariffs appears to be working its way through the economy. Businesses and consumers are naturally hesitant in the face of heightened political uncertainty. Today's report reflects this, with full-time jobs in the cyclically sensitive private sector driving the losses. Those that lose their jobs are also taking longer to find work, a sign that the Canadian labour market is starting to loosen in response to the imposition of tariffs.
The Bank of Canada is increasingly likely to cut its policy rate further. While pricing for April is still undecided, we think the bank should keep cutting by at least another 50 bps (cumulative) over the coming months in order to cushion the blow from tariffs. Today's discouraging jobs report showcases the downside risks to the economy, which warrants further action from the BoC.
US: Payrolls Jump in March, While Unemployment Rate Ticks Up to 4.2%
The U.S. economy added 228k jobs in March, well above the consensus forecast of 140k. Payroll figures for the prior two months were revised lower by a total of 48k jobs.
- For the first quarter, payrolls gained 456k, down from Q4-2024's 656k pace.
Private payrolls rose 209k – well above February's 117k – with the largest gains seen in health care & social assistance (+78k), leisure & hospitality (+43k), transportation & warehousing (+22.9k), retail trade (+23.7k). Government hiring added 19k new positions last month, but all were concentrated at the state & local level. Federal hiring was lower by 4k.
In the household survey, civilian employment (+201k) rose by slightly less than the labor force (+232k), pushing the unemployment rate up to its post-pandemic high of 4.2% (from 4.1% in February). Meanwhile, the broader U-6 measure of unemployment, which includes those working part-time for economic reasons and who are marginally attached to the labor force, fell to 7.9%, after reaching a three-year high of 8.0% in February.
Average hourly earnings (AHE) rose 0.3% month-on-month (m/m) – up from a downwardly revised 0.2% m/m gain in February. The twelve-month change slipped to 3.8% (from 4.0% the month prior).
Aggregate weekly hours rose 0.2% m/m, following a gain of 0.3% m/m in February.
Key Implications
Non-farm payrolls surprised all expectations, coming in well above the consensus forecast and surpassing each of the two prior months job gains by a little over 100k. Some of this is likely payback from January/February, where bad weather and the wildfires in California may have weighed on hiring activity. But given the ongoing efforts to shrink the federal government and rising trade uncertainty, we suspect that job growth is likely to soften over the coming months.
This week's reciprocal tariff announcement marks a significant escalation in trade tensions, and has sparked fears that the U.S. economy is headed for a recession. Longer-term Treasury yields have fallen by over 35 basis points in recent days, with the 10-year currently sitting at 3.93%. Since releasing our Quarterly Forecast on March 18th, we've already marked down our 2025 GDP forecast by 0.6 percentage points to 1.3%. But this assumes the current tariffs are only in effect for six-months, after which most countries/regions see some reprieve. Should the tariffs remain elevated for longer, the odds of the U.S. economy slipping into a recession start to increase. Fed Chair Powell is on deck to speak later this morning, let's see if he can help to calm unnerved financial markets.
EUR/USD Mid-Day Outlook
Daily Pivots: (S1) 1.0855; (P) 1.1001; (R1) 1.1196; More...
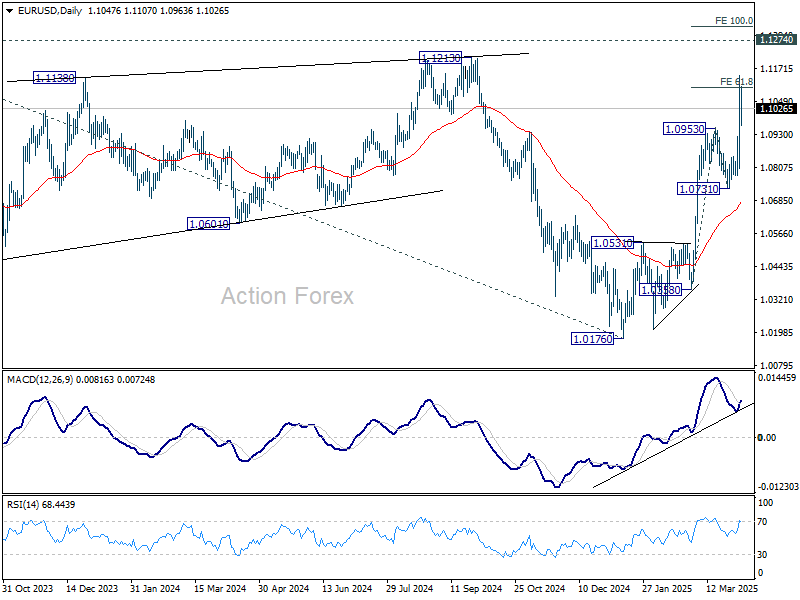
Intraday bias in EUR/USD is turned neutral with current retreat and some consolidations would be seen first. Downside of retreat should be contained above 1.0731 support to bring another rally. Break of 1.1145 temporary top will target 1.1274 key resistance, and probably further to 100% projection of 1.0358 to 1.0953 from 1.0731 at 1.1326.
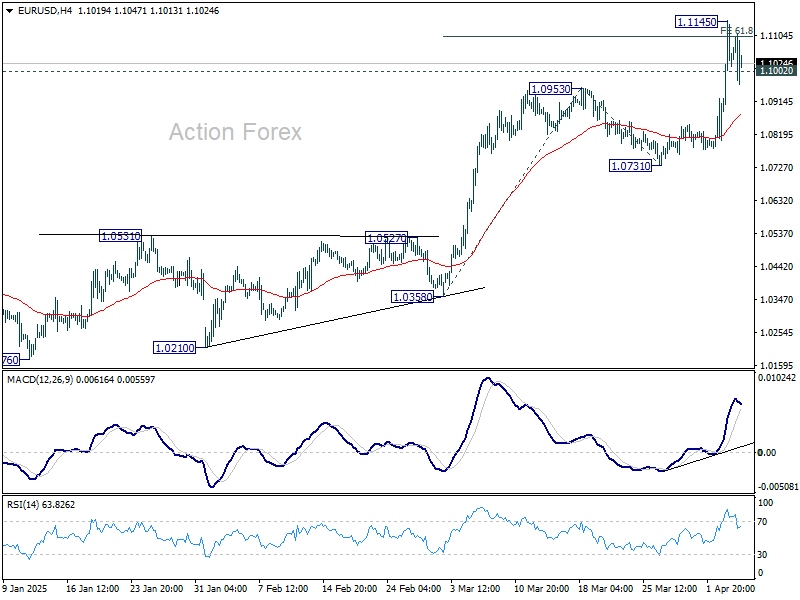
In the bigger picture, prior strong break of 55 W EMA (now at 1.0692) suggests that fall from 1.1274 (2024 high) has completed as a three wave correction to 1.0176. Rise from 0.9534 is still intact, and might be ready to resume. Decisive break of 1.1274 will target 100% projection of 0.9534 to 1.1274 from 1.0176 at 1.1916. Also, that will send EUR/USD through a multi-decade channel resistance will carries larger bullish implication. This will now be the favored case as long as 1.0731 support holds.
GBP/USD Mid-Day Outlook
Daily Pivots: (S1) 1.2980; (P) 1.3094; (R1) 1.3215; More...
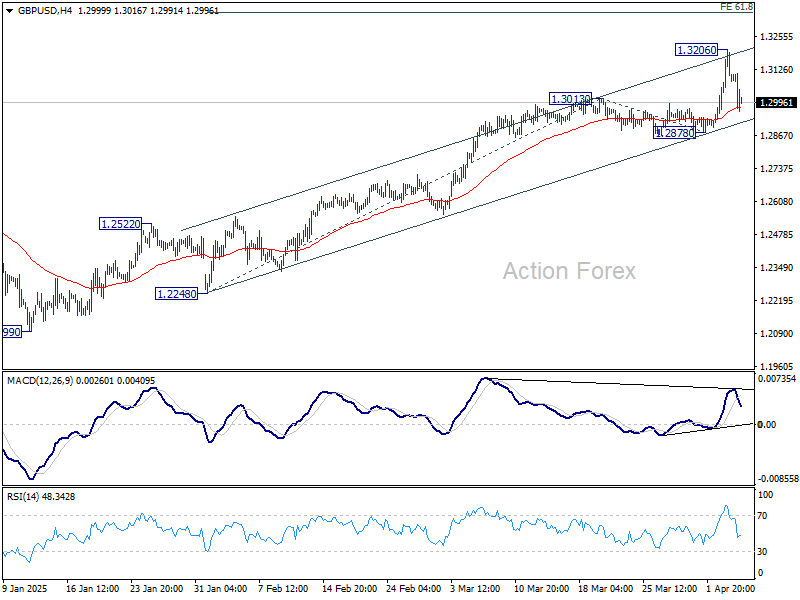
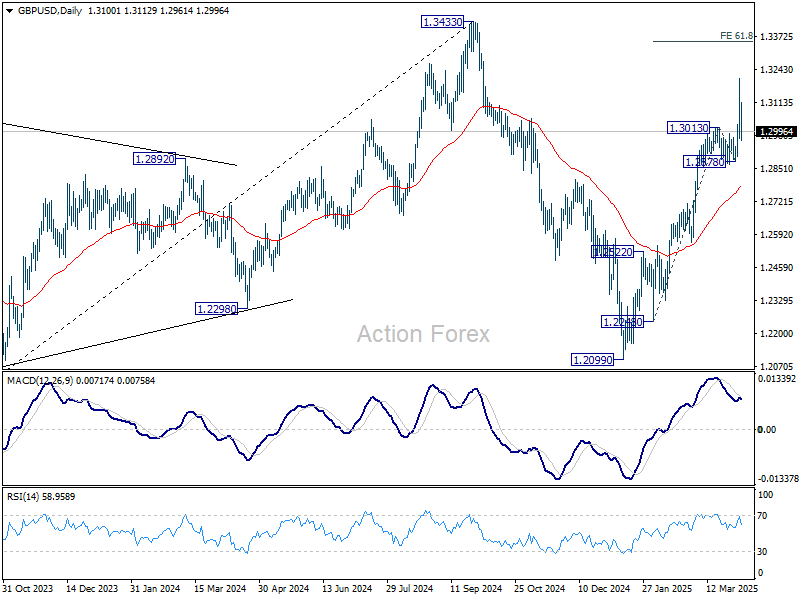
Intraday bias in GBP/USD remains neutral first and more consolidations would be seen below 1.3206. Downside of retreat should be contained above 1.2878 support to bring another rally. Break of 1.3206 will resume the rise from 1.2099 to 61.8% projection of 1.2248 to 1.3013 from 1.2878 at 1.3351.another rally. However, considering bearish divergence condition in 4H MACD, break of 1.2878 will indicate short term topping, and turn bias back to the downside.
In the bigger picture, up trend from 1.3051 (2022 low) is not completed. Resumption is expected after corrective pattern from 1.3433 completes. Next target will be 1.4248 key resistance (2021 high). This will now remain the favored case as long as 1.2099 support holds.
USD/CHF Mid-Day Outlook
Daily Pivots: (S1) 0.8483; (P) 0.8658; (R1) 0.8769; More…
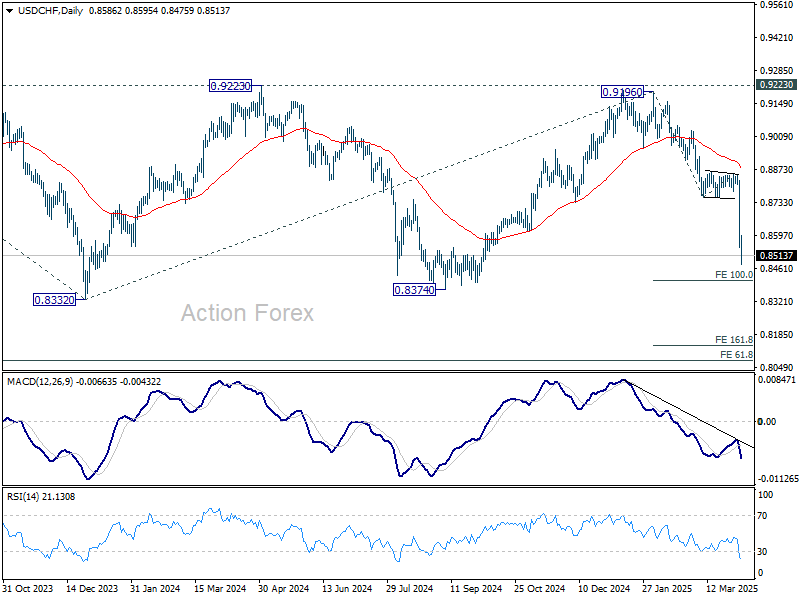
Intraday bias in USD/CHF remains on the downside for the moment. Current fall from 0.9196 is in progress for 100% projection of 0.9196 to 0.8757 from 0.8854 at 0.8415. On upside, above 0.8617 minor resistance will turn intraday bias neutral and bring consolidations. But recovery should be limited below 0.8757 support turned resistance to bring another fall.
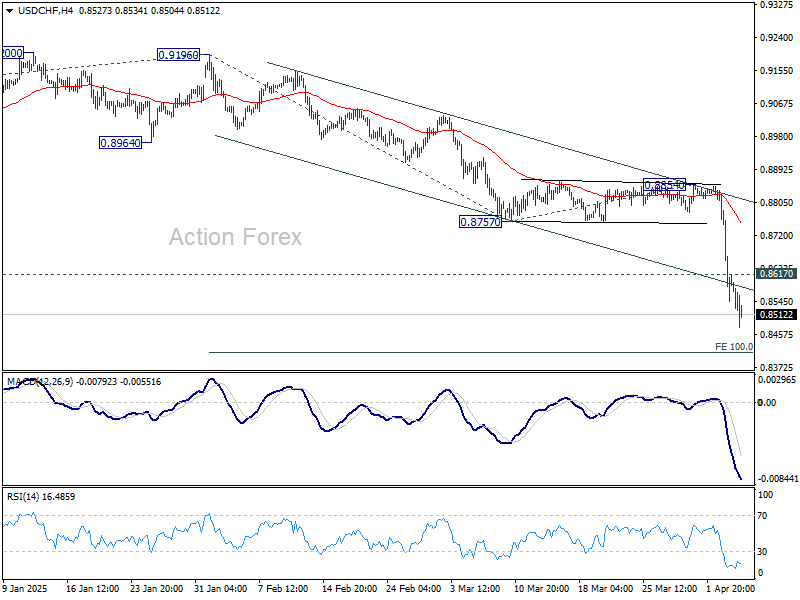
In the bigger picture, rejection by 0.9223 key resistance keep medium term outlook bearish. That is, larger fall from 1.0342 (2017 high) is not completed yet. Firm break of 0.8332 (2023 low) will confirm down trend resumption. Next target is 61.8% projection of 1.0146 (2022 high) to 0.8332 from 0.9196 at 0.8075.
USD/JPY Mid-Day Outlook
Daily Pivots: (S1) 144.41; (P) 146.86; (R1) 148.53; More...
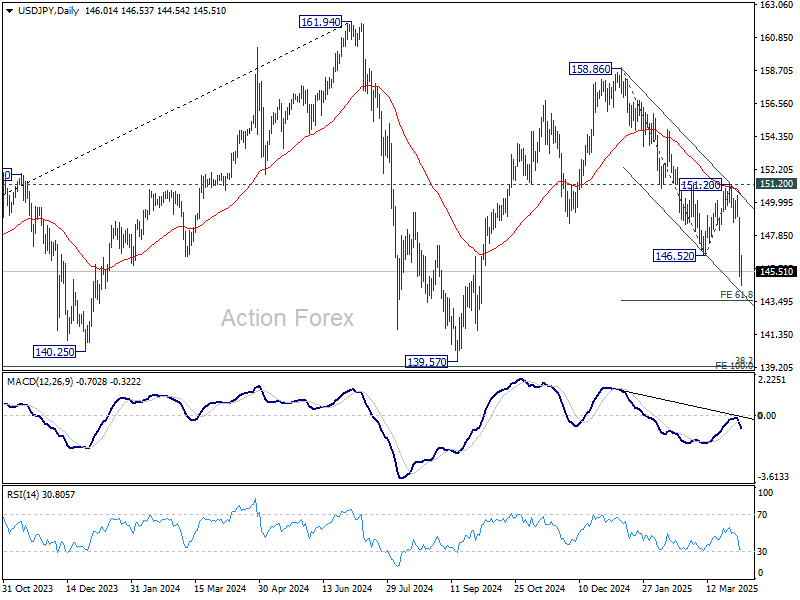
No change in USD/JPY's outlook and intraday bias stays on the downside. Current fall from 158.86 is in progress for 61.8% projection of 158.86 to 146.52 from 151.20 at 143.57. On the upside, above 146.76 minor resistance will turn intraday bias neutral and bring consolidations first. But recovery should be limited below 151.20 resistance to bring another fall.
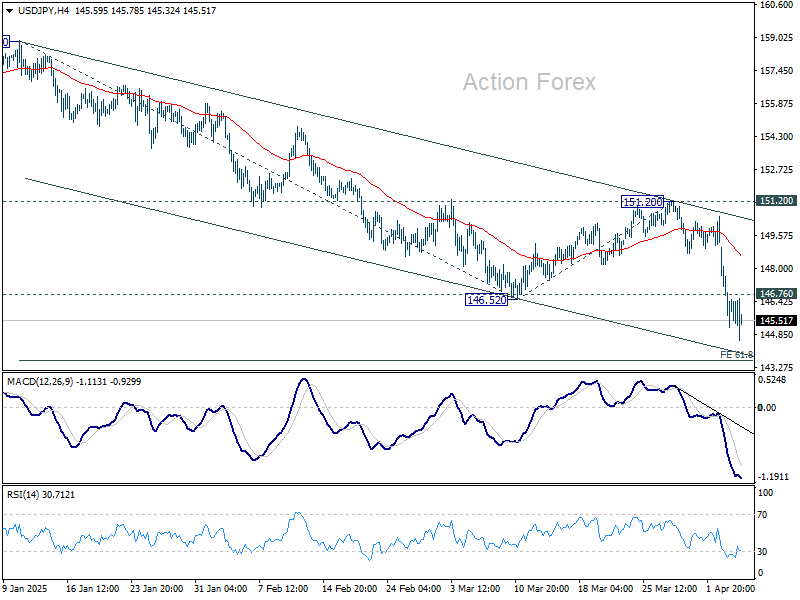
In the bigger picture, price actions from 161.94 are seen as a corrective pattern to rise from 102.58 (2021 low), with fall from 158.86 as the third leg. Strong support should be seen from 38.2% retracement of 102.58 to 161.94 at 139.26 to bring rebound. However, sustained break of 139.26 would open up deeper medium term decline to 61.8% retracement at 125.25.