Sample Category Title
AUD/USD Top Loser of Asian/Early European Trading on Friday
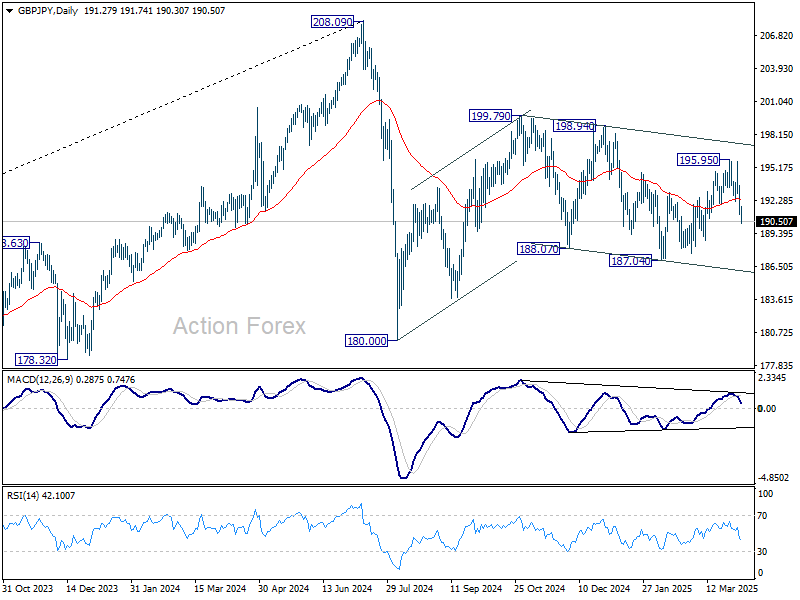
AUDUSD was sharply down during Asian / early European sessions on Friday, falling over 2% so far and being the top loser of the day.
The Ausie dollar remains under strong pressure from risk aversion that continue to weaken stocks and commodities, with stronger dollar on Friday morning, adding to negative near term outlook.
Today’s bearish acceleration has so far retraced over 61.8% of 0.6087/0.6408 and pressuring pivotal support at 0.6187 (Mar 4 low) with firm break here to generate fresh bearish signal.
Daily studies turned to full bearish configuration and contribute to growing risk of further losses (Australian dollar is on track for the biggest daily drop since 10 Apr 2024).
Broken daily cloud base at 0.6248 (also broken 50% retracement of 0.6087/0.6408) reverted to solid resistance which should cap upticks and keep bears in play.
We look for fresh signals from the US labor data (due later today).
Res: 0.6210; 0.6248; 0.6284; 0.6300.
Sup: 0.6187; 0.6163; 0.6131; 0.6100.
USD/JPY Collapses to a 6-month Low: Safe-Haven Assets in Demand
USD/JPY is at a six-month low near 145.57 on Friday after posting a 2% gain in the previous session.
Key factors driving the USD/JPY movement
US President Donald Trump’s sweeping duties have fuelled demand for safe-haven assets. This week, Trump announced a 10% base tariff on all imports, set to take effect on 5 April. Around 60 countries are expected to face higher duties, including China (54% tariff), the EU (20%), Japan (24%), India (27%) and Vietnam (46%).
The market reacted quickly and powerfully. A new wave of tariff measures signals potentially uncontained inflation and sluggish global GDP growth. At the same time, demand increased across the full spectrum of safe-haven assets, including the yen.
Statistics from Japan showed that personal spending fell less than expected in February, suggesting some resilience in the economy.
The 2025 baseline scenario suggests that the Bank of Japan will raise interest rates this year, although uncertainty surrounding global trade and domestic economic conditions casts a shadow over the outlook.
Technical outlook: USD/JPY
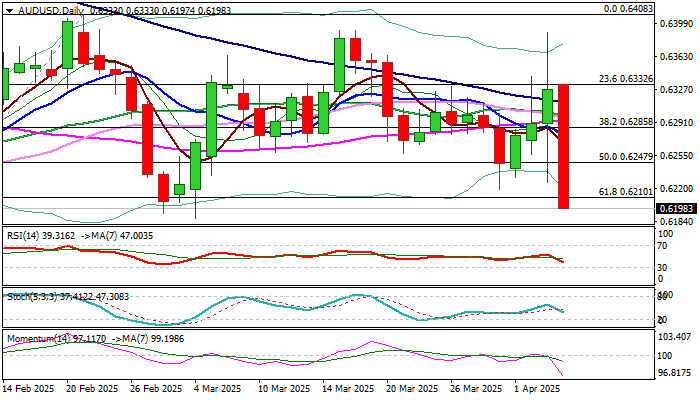
On the H4 chart, the USD/JPY pair has breached the 147.60 level to the downside and continues to form a wave towards the 144.76 level. The target is local. After reaching it, a correction to 147.60 is possible. Once the correction is complete, a further wave down to 144.12 is likely. Technically, this scenario is confirmed by the MACD indicator. Its signal line is below the zero level and is pointing sharply downwards.
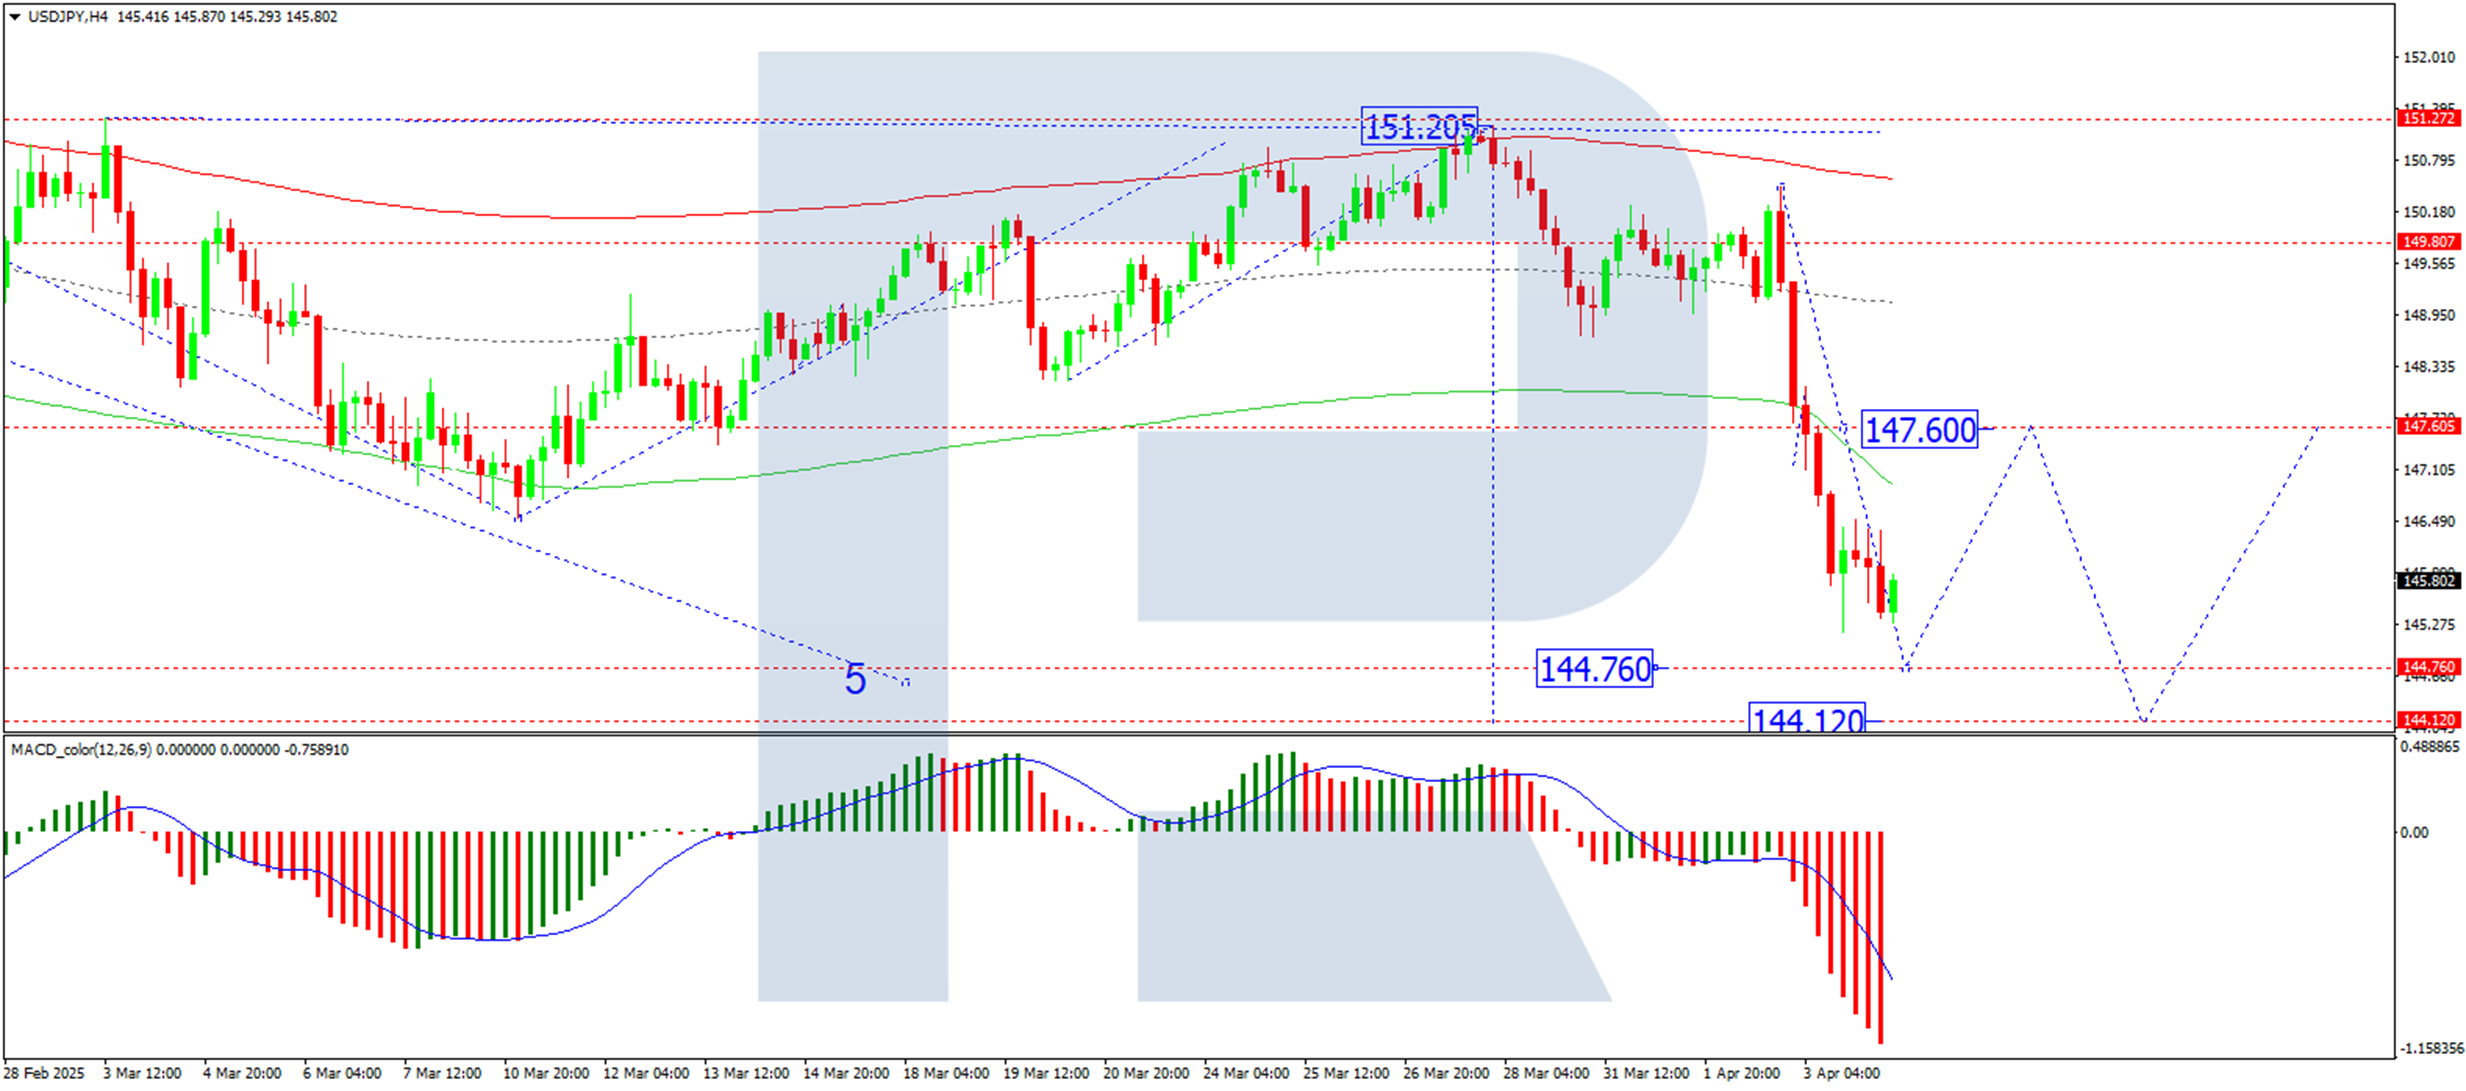
On the H1 chart, USD/JPY has formed a consolidation range around 147.60. Following the downside breakout, the development of the third wave is underway. The target is at 144.76. Once this is reached, a corrective wave is likely. The first correction target is at 146.06. Technically, this scenario is confirmed by the Stochastic oscillator. Its signal line is below 50 and heading directly towards 20.
Conclusion
With trade war fears escalating and demand for safe-haven assets surging, USD/JPY remains under pressure. Technical indicators suggest further downside, though a short-term correction is possible. Traders should monitor 144.76 as the next key support, with BoJ policy signals and global trade developments likely to determine the pair’s next significant move.
Bitcoin (BTCUSD) Elliott Wave : Calling the Decline After 3 Waves Bounce
Hello fellow traders. In this technical article we’re going to look at the Elliott Wave charts of Bitcoin (BTCUSD) published in members area of the website. As our members know, Bitcoin is currently correcting its short-term cycle from the 76,612 low. In the following analysis, we will break down the Elliott Wave forecast and identify the key target area.
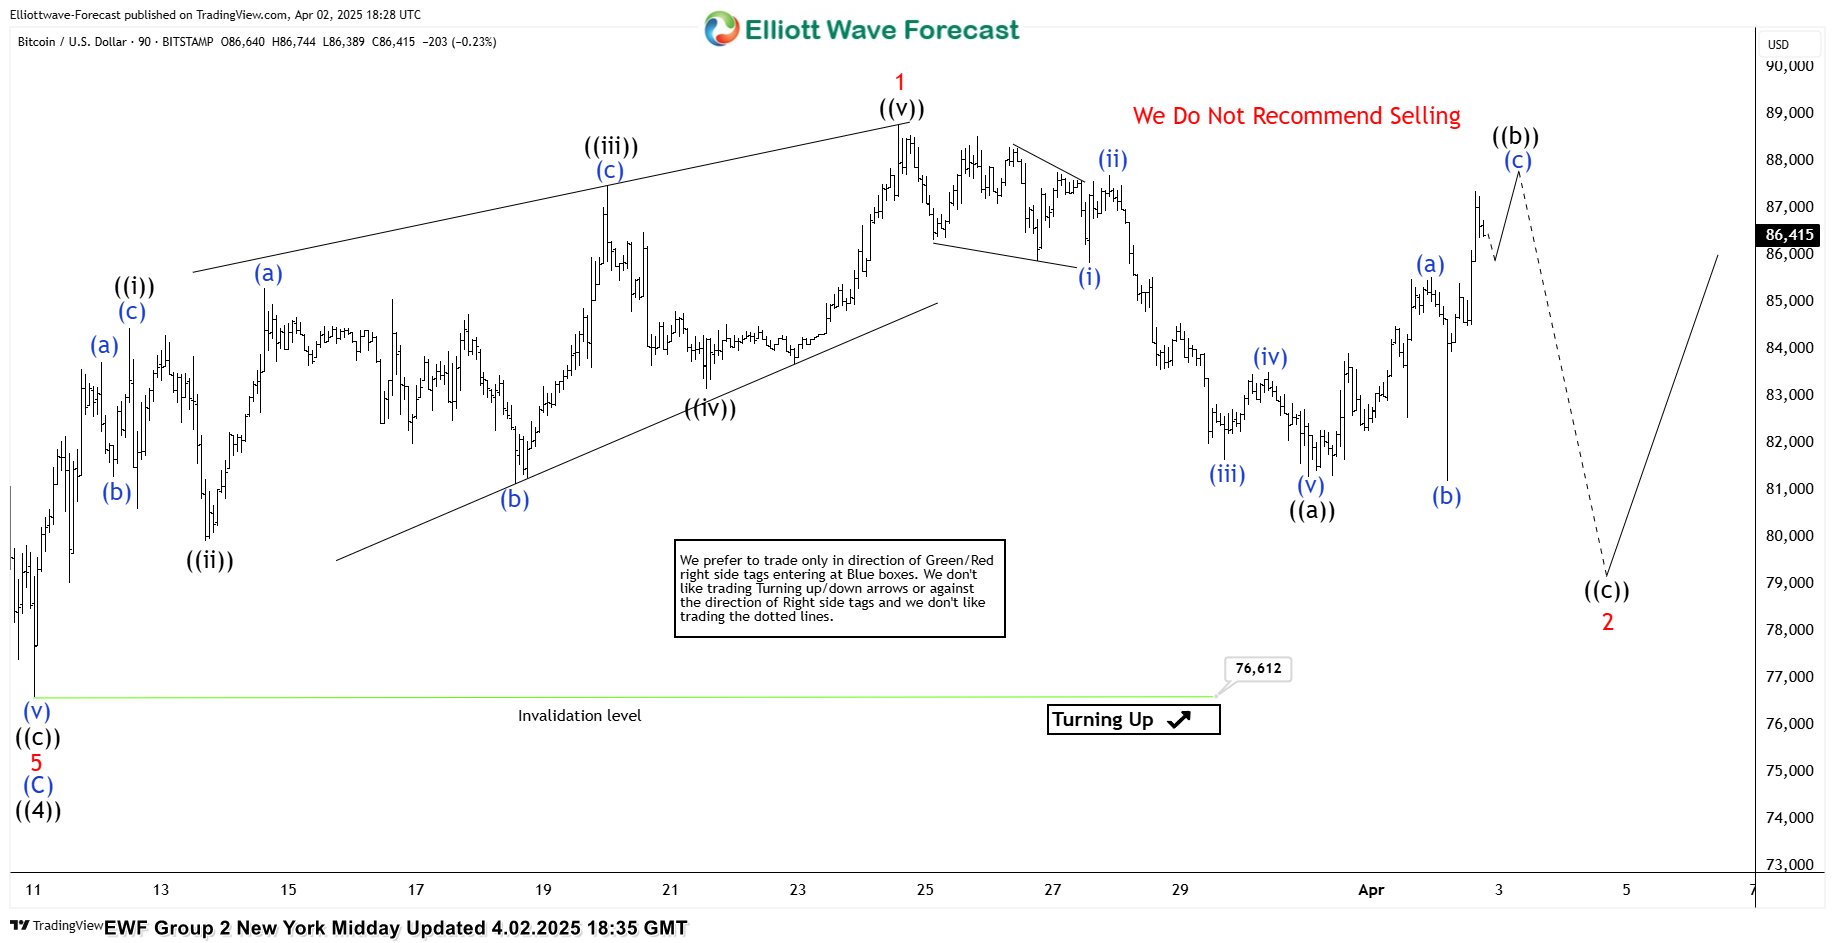
BTCUSD Elliott Wave 1 Hour Chart 04.02.2025
The pullback still looks incomplete at the moment. We count five waves down from the peak, suggesting we have only the first leg ((a)) of wave 2 which is unfolding as a Zig Zag pattern. As long as the price remains below 88760 peak , we anticipate another leg down as proposed on the chart.
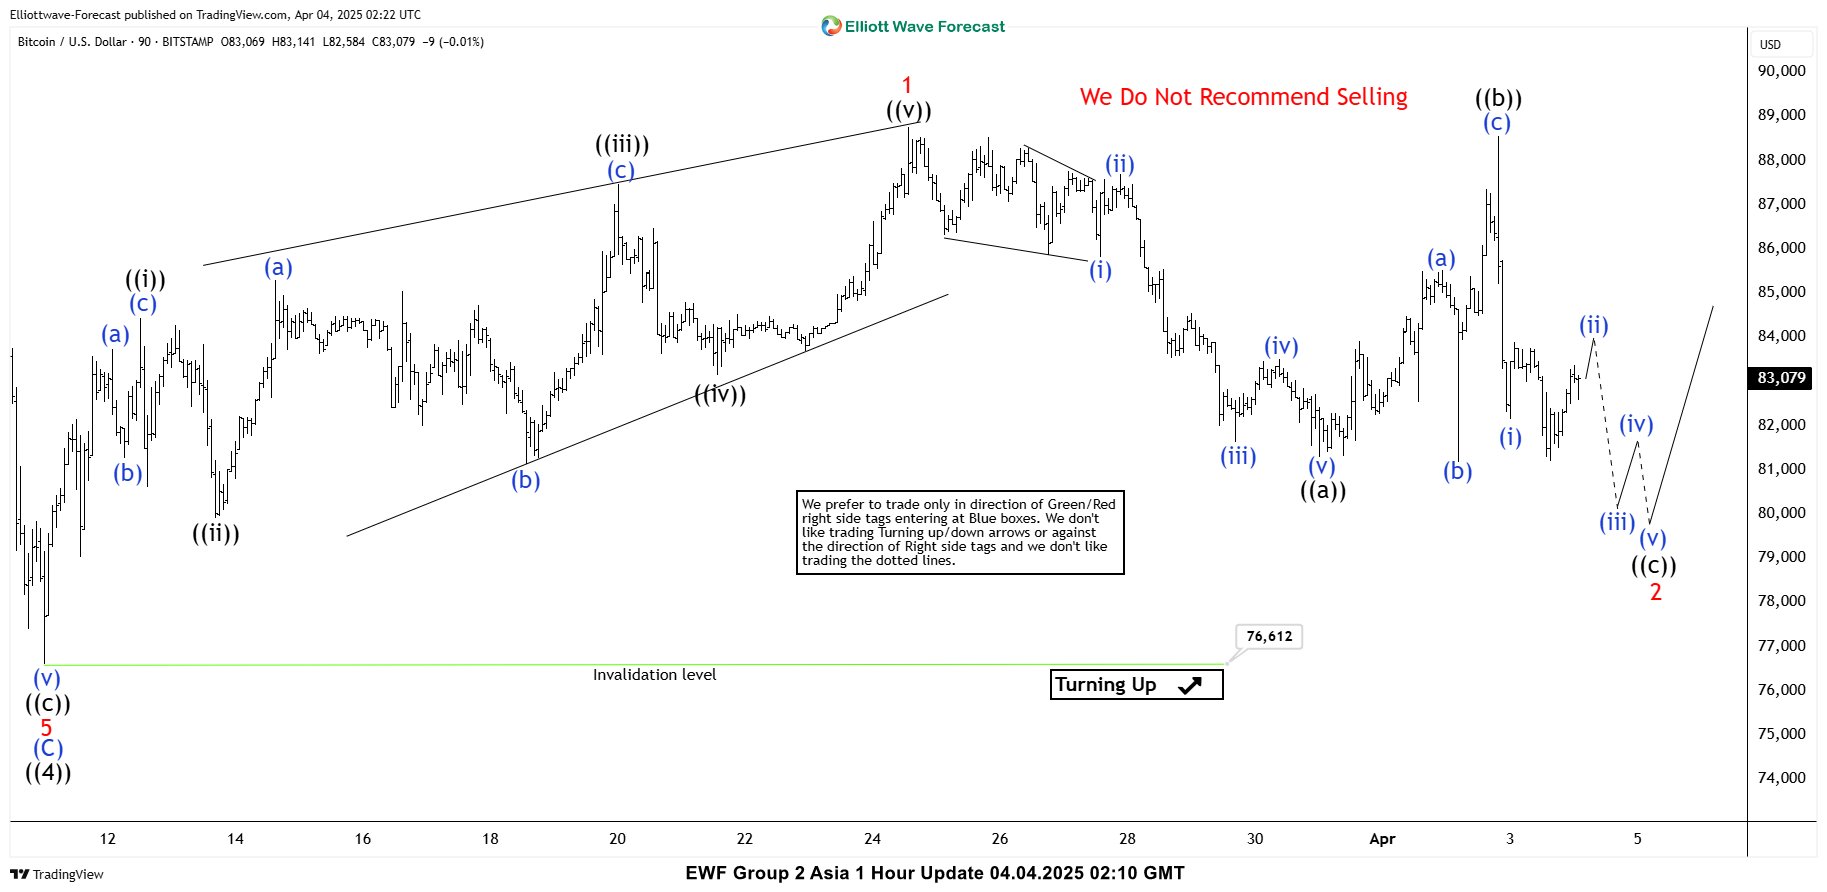
BTCUSD Elliott Wave 1 Hour Chart 04.04.2025
The price has remained below the 88,760 peak, and the expected decline has followed. BTCUSD has yet to reach the extreme zone. There may be further short-term weakness, with potential support between 80,967 and 79,159. At this stage, we do not recommend selling.
BTC/USD Analysis: Bitcoin Price at a Critical Support Level
In our 28 January report, "Bitcoin Price Holds Above $100k. For Now?", we highlighted the heightened volatility surrounding Trump’s inauguration. We speculated that major market players might have capitalized on this surge to lock in profits from long positions, potentially preparing for a bearish market phase. Since then, Bitcoin's price has dropped by approximately 20%.
BTC/USD Chart Analysis Today
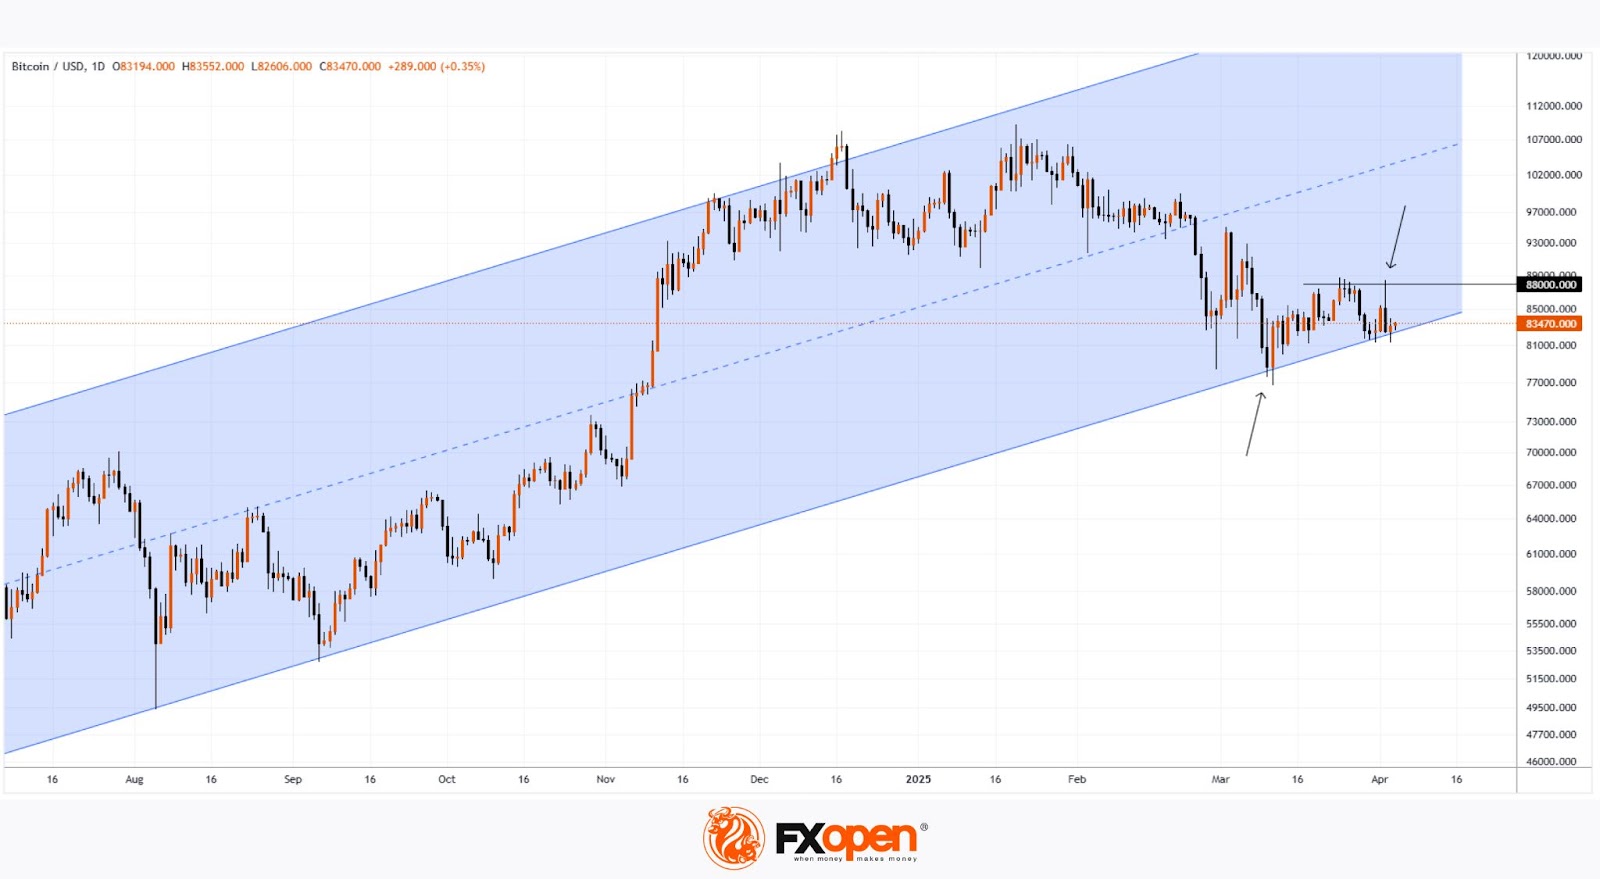
Fresh price data allows for a refined trend channel (marked in blue), capturing several bullish factors for cryptocurrency investors. These include capital inflows into Bitcoin ETFs and Trump’s fulfilled promise to establish a National Cryptocurrency Reserve.
However, Bitcoin is now testing the lower boundary of this critical channel. Notably, bulls have made two attempts to reclaim the uptrend:
→ The first attempt (marked by an arrow) took place on 11 March, but the $88,000 level proved to be strong resistance, pushing Bitcoin’s price back to the lower channel boundary.
→ The second attempt occurred this week but also appears unsuccessful, as the price once again failed to break above $88,000. BTC/USD has now retreated back to the lower boundary of the trend channel.
A long upper wick (marked by an arrow) signals bearish aggression, triggered by news of Trump’s tariffs. This development raises the risk of a bearish breakout from the long-term ascending channel.
FXOpen offers the world's most popular cryptocurrency CFDs*, including Bitcoin and Ethereum. Floating spreads, 1:2 leverage — at your service. Open your trading account now or learn more about crypto CFD trading with FXOpen.
*Important: At FXOpen UK, Cryptocurrency trading via CFDs is only available to our Professional clients. They are not available for trading by Retail clients. To find out more information about how this may affect you, please get in touch with our team.
This article represents the opinion of the Companies operating under the FXOpen brand only. It is not to be construed as an offer, solicitation, or recommendation with respect to products and services provided by the Companies operating under the FXOpen brand, nor is it to be considered financial advice.
NFP Preview April 2025: NFP Forecast, Dollar & Dow Jones Analysis (DJIA)
- US Nonfarm Payrolls data for March 2025 is released April 4th, with expected job growth of 135K-140K.
- Market reaction is heavily influenced by recent tariff announcements and expectations of Federal Reserve policy changes.
- Fed Chair Powell's speech following the data release is crucial for market direction and potential rate cuts.
- Technical analysis of Dow Jones shows bullish divergence, while the US Dollar Index (DXY) is oversold.
The US Bureau of Labor Statistics is set to release the non-farm payroll and jobs data for March 2025 on Friday, April 4th, 2025.
Job Market Expectations for February
Analysts are projecting a more subdued pace of job creation this time, with consensus estimates of 135K–140K new jobs added in March, down from February’s tally of 151K. The unemployment rate is anticipated to hold steady at 4.1%, while average hourly earnings are forecast to rise 0.3% month-over-month, maintaining an annual growth rate of 4.0%.
These expectations reflect concerns around economic headwinds, including trade-related uncertainties and inflation pressures stemming from recent global tariff disputes.
Key Estimates for the March Report:
- Nonfarm Payrolls: 135K–140K (consensus)
- Unemployment Rate: 4.1% (unchanged)
- Average Hourly Earnings (MoM): 0.3%
- Labor Force Participation Rate: Consensus data not released, but prior levels stood at 62.4%.

Market reaction and implications of the data
Markets are no doubt still reeling and coming to terms with President Trump's liberation day tariff announcements. The US Dollar and equity markets have both faced significant selloffs with the Magnificent 7 Index now down over -30% from its all time high seen on December 18th.
The S&P 500 is down -7.5% year-to-date with large cap tech beyond bear market territory.
The impact of the tariff announcements also saw the Nasdaq 100 record its largest single-day point loss in HISTORY. The index lost a total of -1060 points and came just 1.5% away from triggering the first circuit breaker since March 2020.
Given the impact tariffs are having on markets and what we have seen in the lead up to the announcement, how important will the NFP and jobs data be?
This is where it gets intriguing to say the least. There is a school of thought that given recent developments the role of the Federal Reserve will be crucial moving forward. The uncertainties created by tariffs and potential slowdown of growth may be offset by Federal Reserve policy and rate cuts.
Another sign of this comes from the behavior of bond markets and the US dollar in the face of the recent selloff. Behavior suggests that markets are hoping the Federal Reserve will step in to provide relief by accelerating rate cuts to help absorb the shock.
After the jobs data today we have a speech by Fed Chair Powell which could prove crucial. If he speaks with more urgency, stock markets might stabilize. If not, more selling is likely. Either way, it seems rate cuts will happen sooner, leading to lower yields, higher bond prices, and a weaker dollar.
With that in mind, the NFP release today takes on a new dimension altogether.
Potential impact on the us dollar index (DXY), S&P 500 and Dow Jones (DJIA)
Here’s how the market might respond to different outcomes in March’s job numbers:
Potential Impact on the US Dollar, US Indices Based on the Data Released
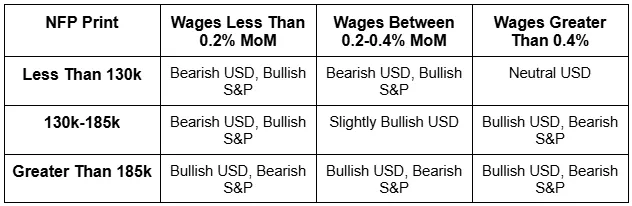
Source: LSEG, TradingEconomics. Table Created by Zain Vawda
The US Dollar Index (DXY) is heavily oversold while indexes like the S&P and Dow Jones are also nearing similar territory. Given the strong bearish momentum caused by the tariff announcement, it's hard to see them bouncing back unless the upcoming NFP report significantly beats expectations.
Will that help alleviate growth fears and help the stock market as well or just the US Dollar? This and many questions will be what market participants grapple with heading into today's data releases.
I think we could get more clarity from Fed Chair Powell's remarks rather than the actual data print and this is where I will be keeping a close watch.
Technical Analysis - Dow Jones (DJIA)
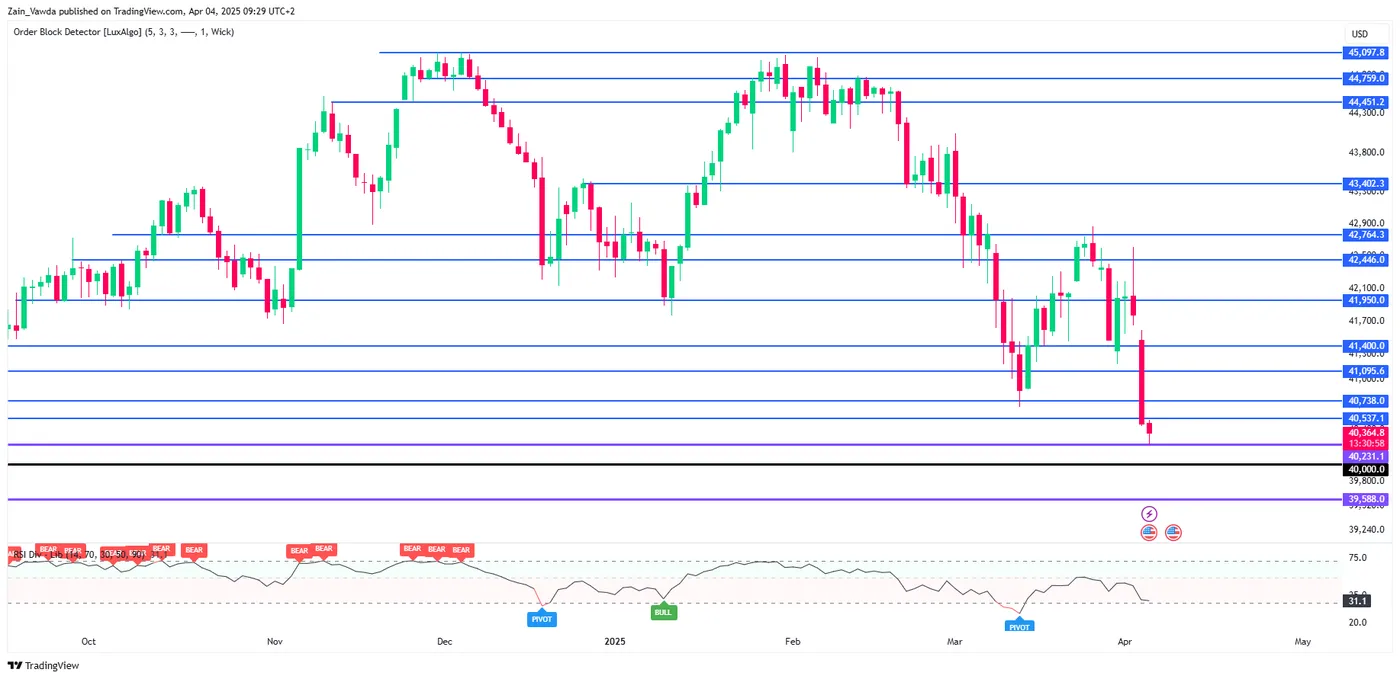
Looking at the Dow Jones which is hovering just above oversold territory having printed fresh YTD lows yesterday.
The index has one silver lining in the face of the current market dynamics in that the technical picture does offer a sliver of hope.
There is bullish divergence in play on the Dow Jones daily chart as price makes lower lows, but the RSI makes higher lows. This can signal that the downward momentum is weakening, and a price reversal to the upside might be coming.
There is also the psychological 40000 level just hovering below the current price level. If this level is broken then the 39588 handle may provide support.
A recovery from here however may face resistance at 40537, 40738,41095 and 41400.
Of course, the countless dynamics at play and current sentiment remains tilted to further downside. Whether the NFP can arrest this slump remains to be seen.
US Dollar Index (DXY) Daily Chart, April 4, 2025
Source: TradingView (click to enlarge)
Support
- 40231
- 40000
- 39588
Resistance
- 40537
- 41095
- 41400
Nikkei (NKD) Appears Poised to Continue Broader Corrective Trend
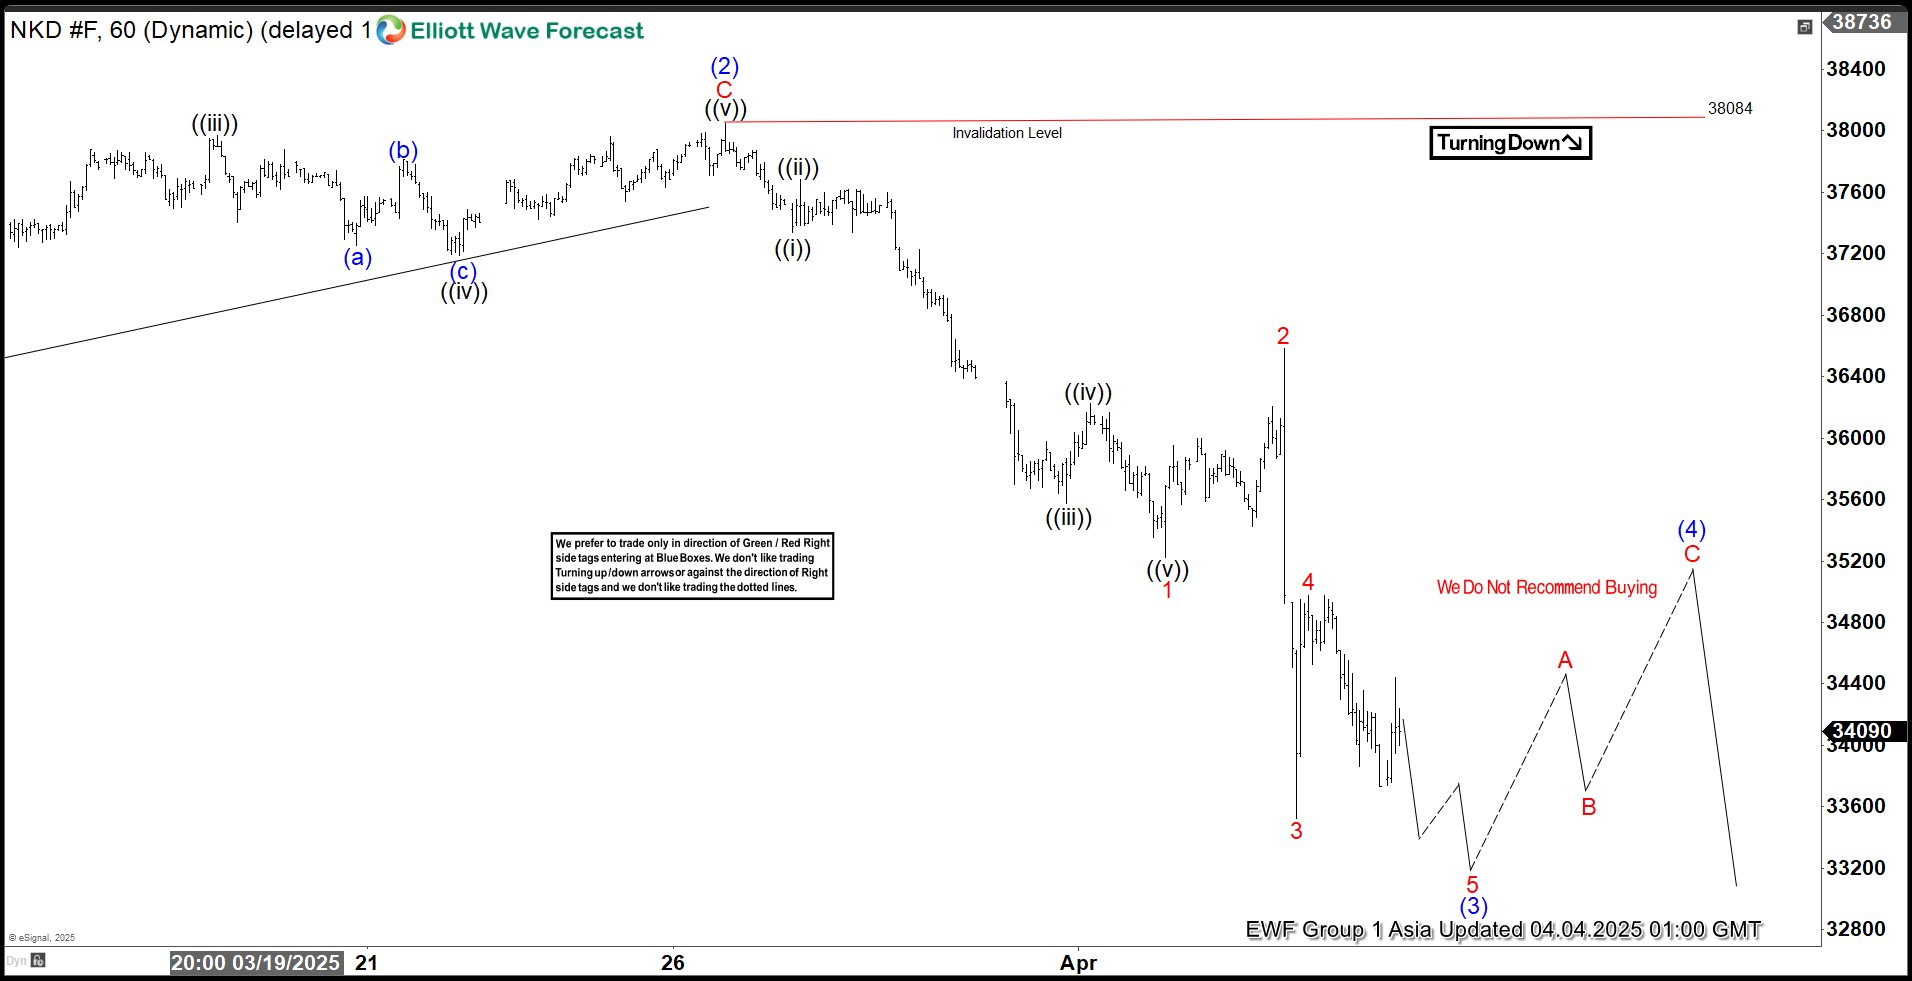
The Nikkei (NKD) has been trending lower since its peak on July 8, 2024. We indicate this decline follows a “double three” Elliott Wave pattern, characterized by a series of distinct movements. After reaching that high, the index fell to 30,720, rebounded to 40,675, and is now progressing downward in a zigzag formation as the internal within “wave y.” The index dropped to 36,275, rose to 38,029 with intermediate fluctuations, and has since resumed its downward trajectory.
This ongoing move lower has already reached 33,525, followed by a recovery to 34,975. We anticipate the index will extend further downward to complete this phase. Afterwards, a temporary rally is expected to provide a correction before the next decline resumes. We anticipate the index will extend further downward to complete this phase. Afterwards, a temporary rally is expected to provide a correction before the next decline resumes.
In the near term, as long as the high of 38,029 remains intact, any upward movements are likely to be limited, setting the stage for additional downside. Investors should monitor these developments closely as the Nikkei continues to navigate this pattern
Nikkei 60 Minute Elliott Wave Chart
NKD Video
https://www.youtube.com/watch?v=eCWtSXB_IeA
EUR/CHF Daily Outlook
Daily Pivots: (S1) 0.9445; (P) 0.9517; (R1) 0.9567; More....
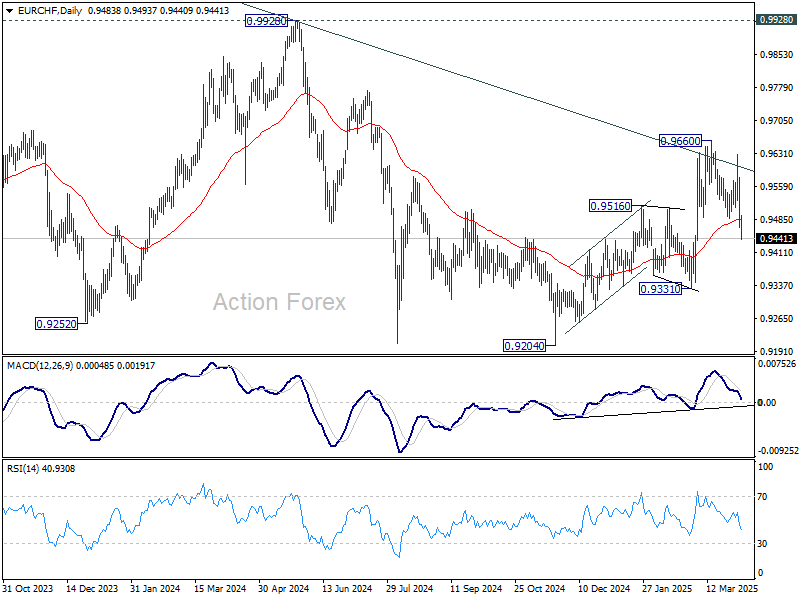
EUR/CHF's fall from 0.9660 resumed with downside acceleration. Current development suggests that rise from 0.9204 has completed as a three-wave correction, after rejection by long-term falling channel resistance. Intraday bias is back on the downside for 0.9331 support first. On the upside, above 0.9486 support turned resistance will turn intraday bias neutral again first.
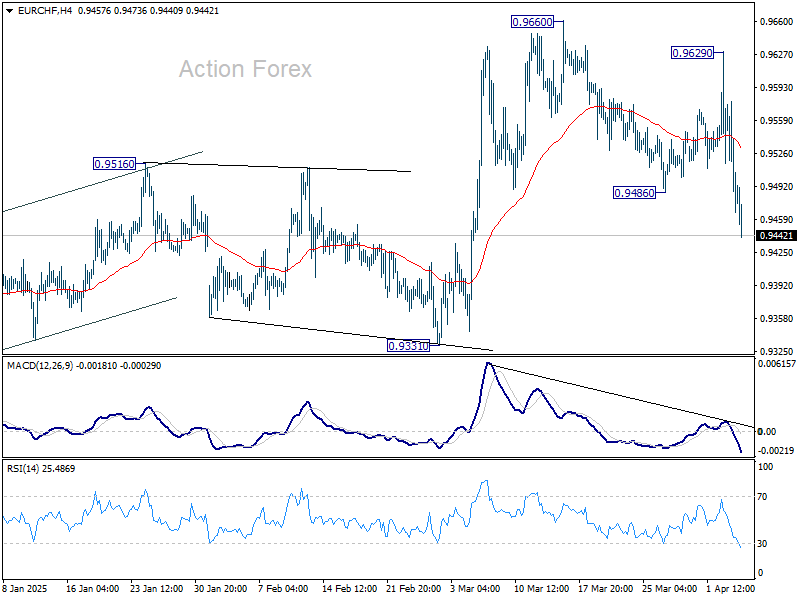
In the bigger picture, rejection by long-term falling channel resistance (now at 0.9600) retains medium term bearishness. That is, down trend from 1.2004 (2018 high) is still in progress. Downside breakout through 0.9204 low is in favor at a later stage.
EUR/GBP Daily Outlook
Daily Pivots: (S1) 0.8352; (P) 0.8401; (R1) 0.8483; More...
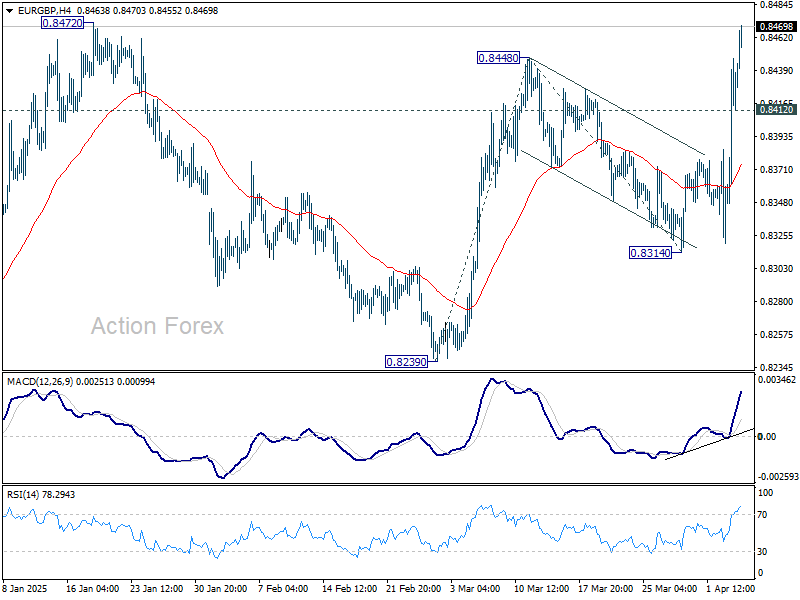
Intraday bias in EUR/GBP stays on the upside for medium term channel resistance (now at 0.8490). Firm break there will target 100% projection of 0.8239 to 0.8448 from 0.8314 at 0.8523. On the downside, below 0.8412 minor support will turn intraday bias neutral and bring consolidations first.
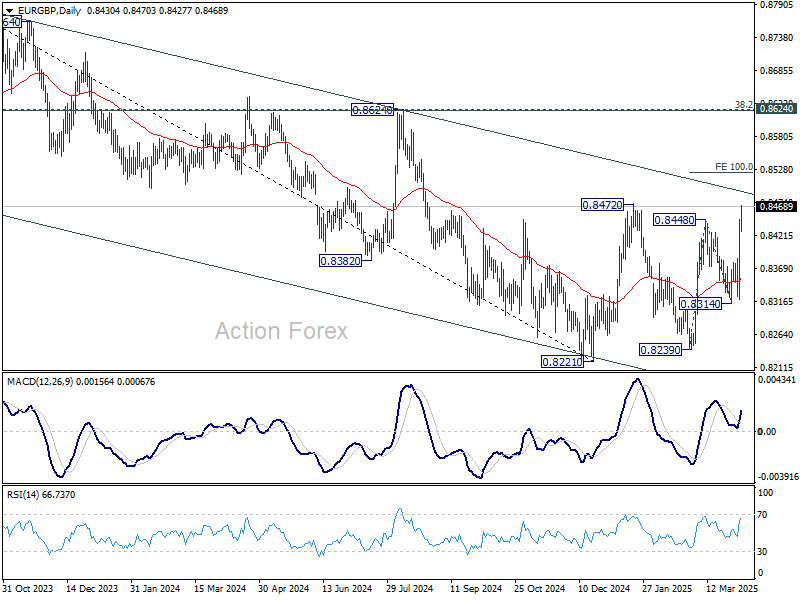
In the bigger picture, EUR/GBP is still bounded inside medium term falling channel. While rebound from 0.8221 might extend higher, it could still develop into a corrective pattern. Overall outlook will be neutral at best and down trend from 0.9267 (2022 high) could extend, at least until decisive break of channel resistance (now at 0.8490).
EUR/AUD Daily Outlook
Daily Pivots: (S1) 1.7279; (P) 1.7405; (R1) 1.7587; More...
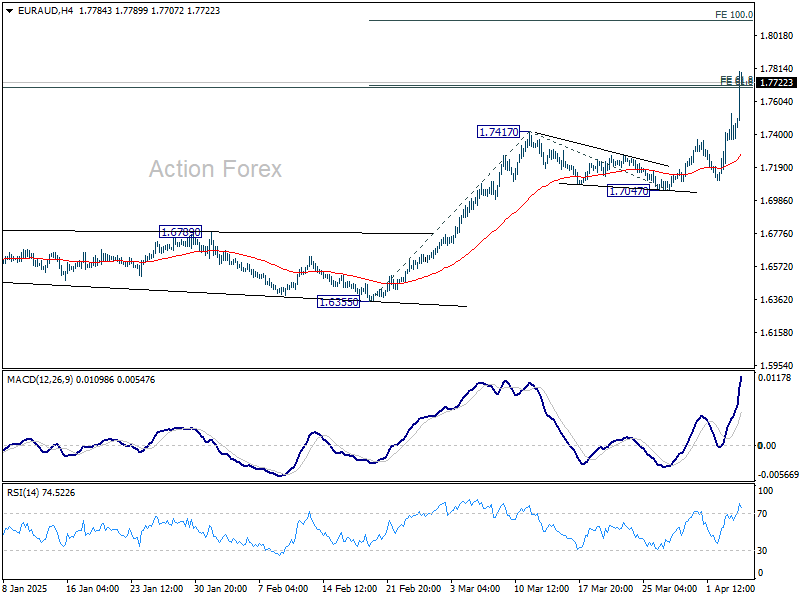
EUR/AUD's up trend resumed through 1.7417 and met 61.8% projection of 1.6355 to 1.7417 from 1.7047 at 1.7703 already. There is no sign of topping yet. Intraday bias stays on the upside. Sustained trading above 1.7703 will target 100% projection at 1.8109. For now, outlook will stay bullish as long as 1.7047 support holds, in case of retreat.
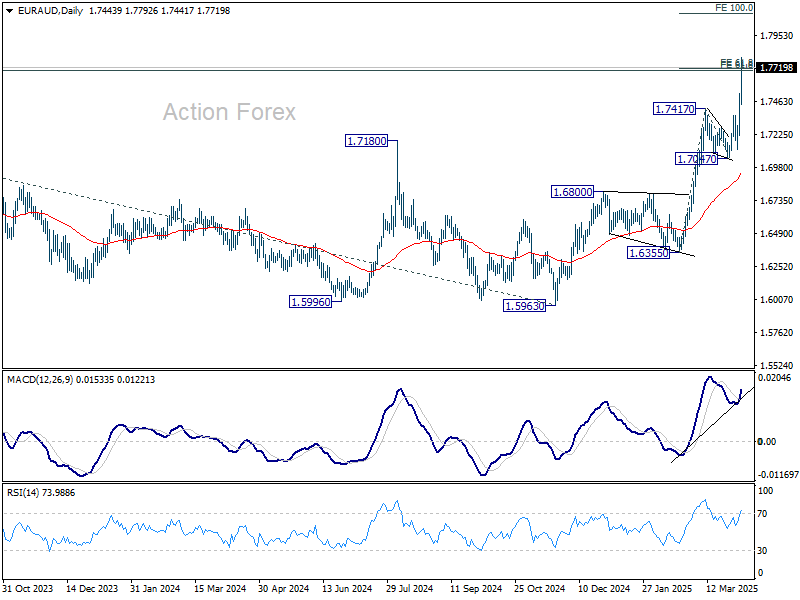
In the bigger picture, up trend from 1.4281 (2022 low) is in progress and has met 61.8% projection of 1.4281 to 1.7062 from 1.5963 at 1.7682 already. Sustained trading above 1.7682 will pave the way to 100% projection at 1.8744. Outlook will remain bullish as long as 1.7062 resistance turned support holds (2023 high) even in case of deep pullback.
GBP/JPY Daily Outlook
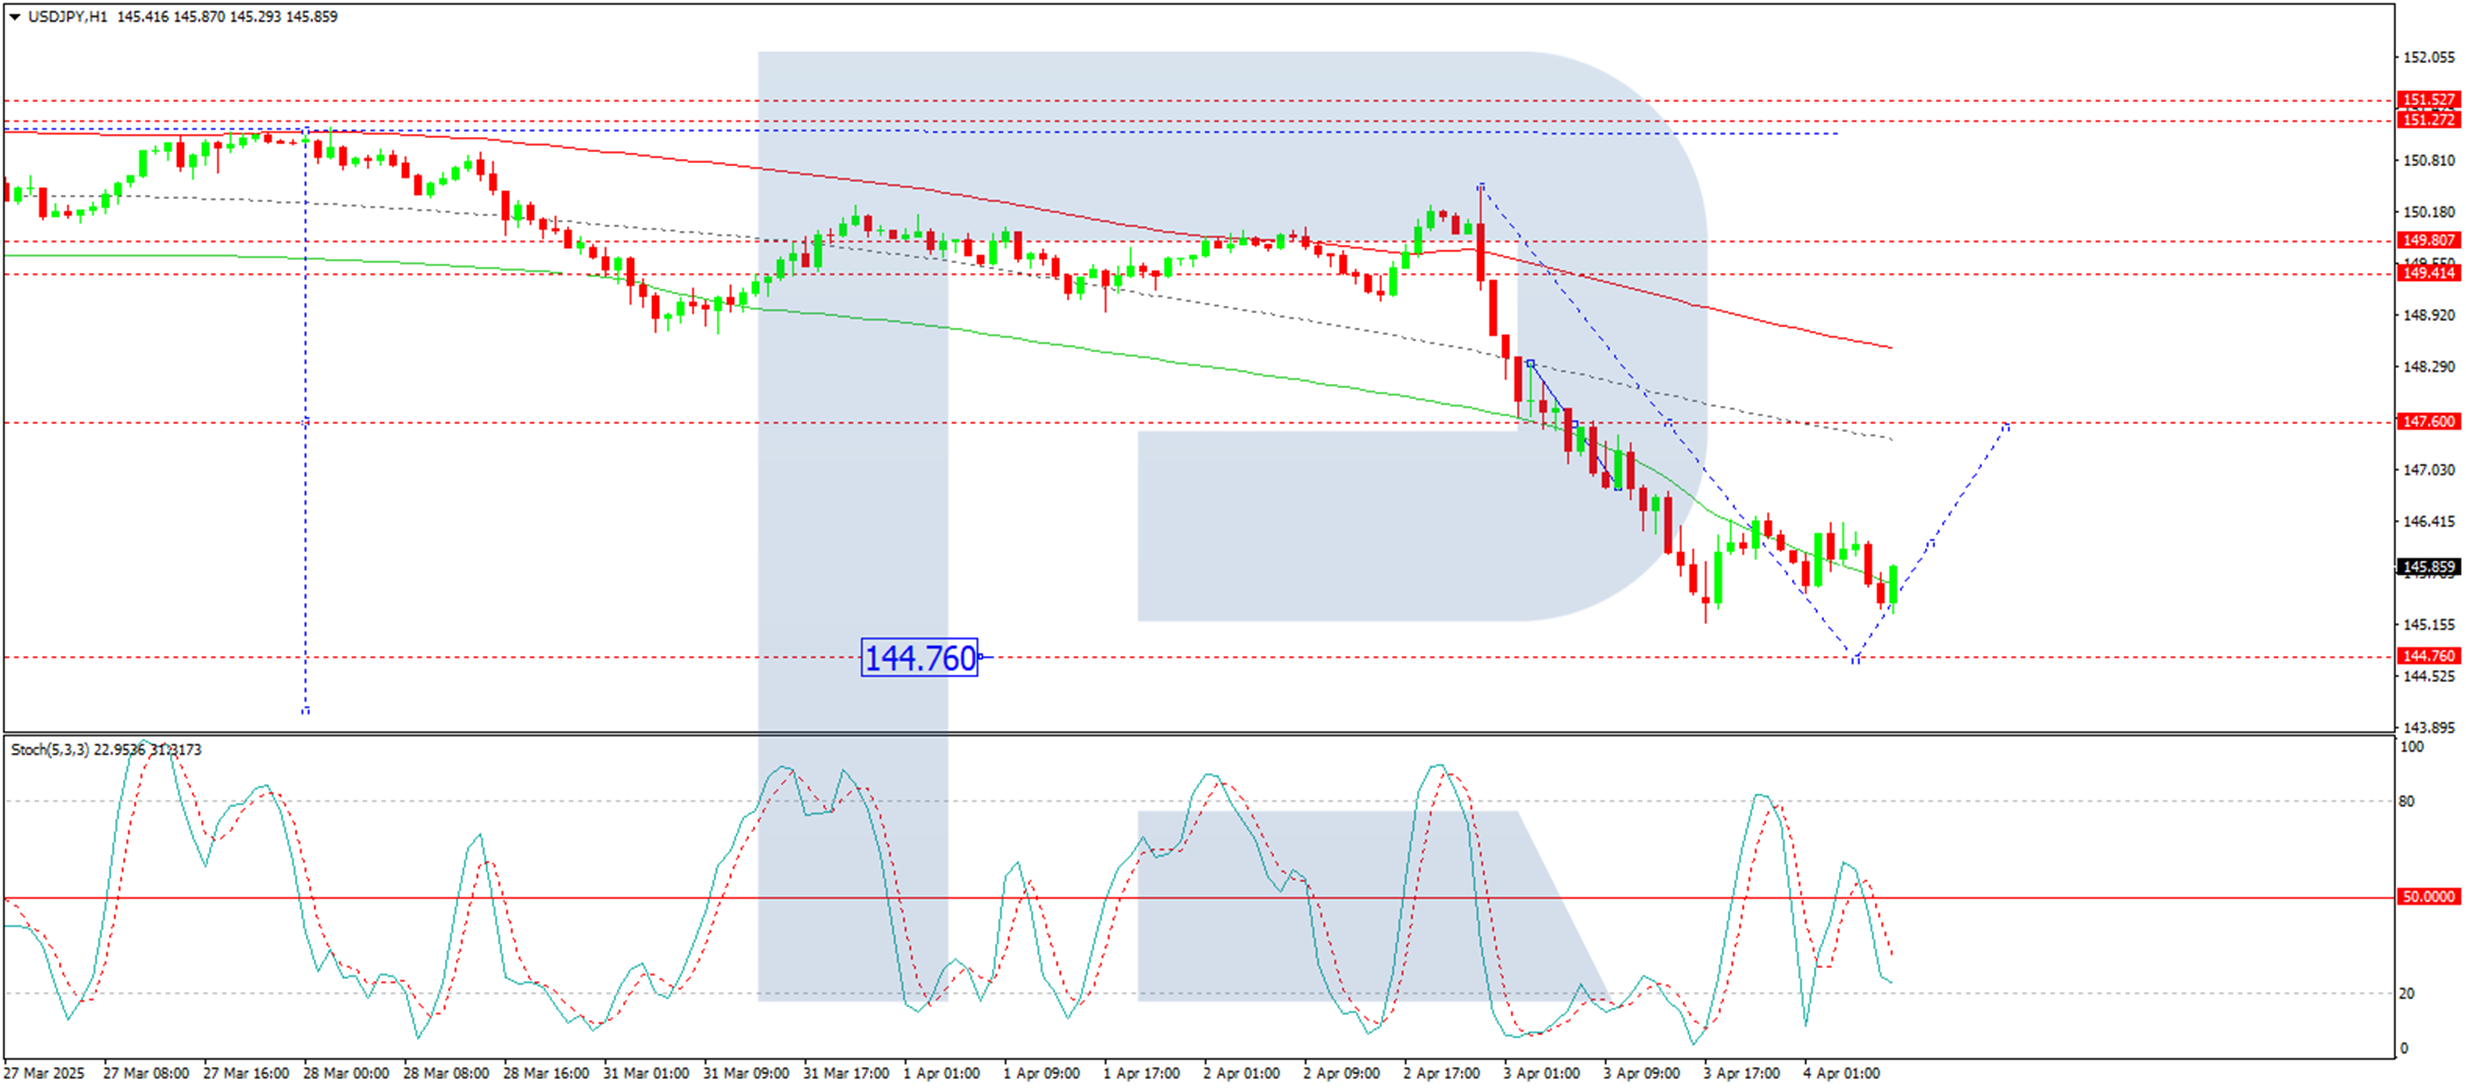
Daily Pivots: (S1) 190.32; (P) 192.20; (R1) 193.26; More...
Break of 192.00 support suggests that GBP/JPY rebound from 107.04 has completed at 195.95. Intraday bias is back on the downside for 188.77 support first. Break there target 187.04. Overall, corrective pattern from 180.00 is still extending. Another rise might still be seen as long as 187.04 support holds.
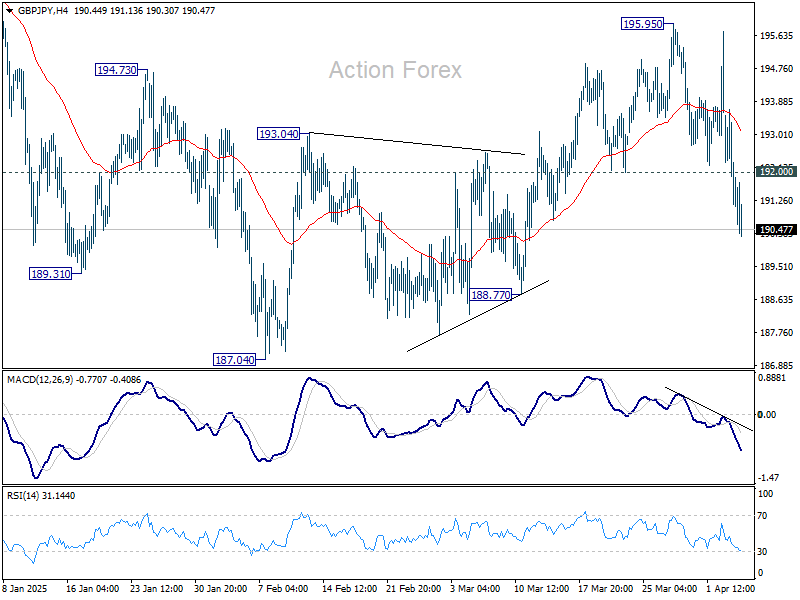
In the bigger picture, price actions from 208.09 are seen as a correction to rally from 123.94 (2020 low). Strong support should be seen from 38.2% retracement of 123.94 to 208.09 at 175.94 to contain downside. However, sustained break of 152.11 will bring deeper fall even still as a correction.