Sample Category Title
NFP unlikely to offer relief, miss could cement Q2 Fed cut
Today’s US non-farm payrolls report comes as the markets are already reeling from this week’s tariff shock. With consensus expecting a 128k rise in jobs for March and the unemployment rate holding steady at 4.1%, the print itself may not do much to lift sentiment or Dollar, even if it exceeds expectations.
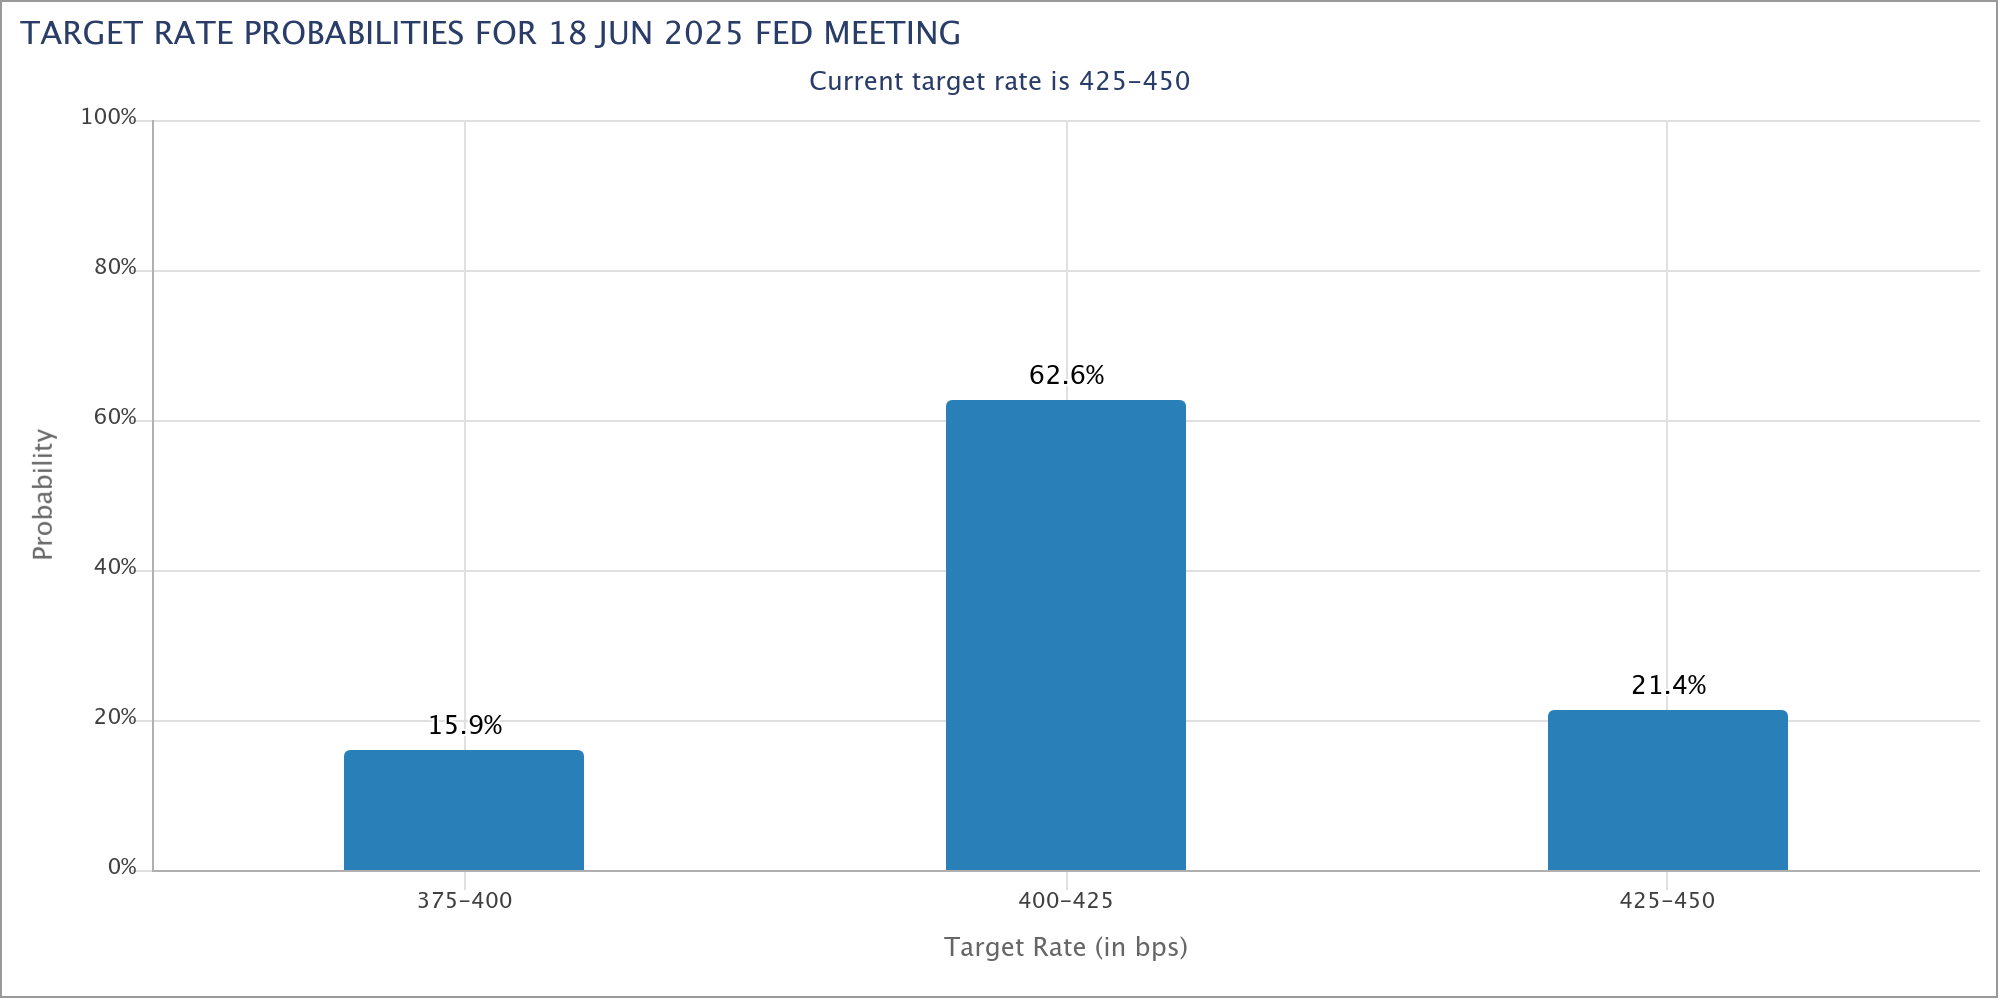
On the other hand, a downside surprise could further shift the odds in favor of a Fed rate cut in Q2. Currently, fed funds futures suggest nearly an 80% probability of a 25bps reduction in June.
While Fed has signaled patience, deteriorating jobs data may leave policymakers with little choice but to move sooner rather than later. Such development would in turn apply further pressure on Dollar.
Recent data paints a murky picture: the employment components in both ISM manufacturing (44.7) and services (46.2) surveys fell deep into contraction in March. ADP report came in at a modest 155k growth.
Whether today's NFP captures the full extent of that weakness as indicated by ISM data remains to be seen, but the underlying trend is clearly deteriorating.
Cliff Notes: Tariff Trauma
Key insights from the week that was.
Starting in Australia, it was unsurprising to see the RBA Monetary Policy Board leave the cash rate unchanged at 4.10%. The decision statement was little changed from February given the relatively quiet and well behaved data flow. In the subsequent press conference, Governor Bullock once again noted that the Board still does not “endorse” the market path for future cash rate reductions.
Post-meeting communications were centred on the considerable two-sided risks at hand. On consumption, the Board notes “there is a risk that any pick-up… is slower than expected” which softer growth in retail sales in February gives credence to – our take on the broader household spending indicator will be released later today on Westpac IQ. However, the Board also stated that “labour market outcomes may prove stronger than expected”, a risk highlighted by the latest job vacancies data which shows that the labour market remains relatively tight. “Uncertainty about the outlook abroad” was certainly seen in the latest trade data, even though it pre-dates this week’s developments.
Given the highly uncertain backdrop and competing risks, the Board will remain focused on actual inflation outcomes. Our Q1 CPI preview provides more detail behind our forecast for trimmed mean inflation to move back into the target band on an annual basis (2.8%), and below the mid-point on a six-month annualised basis (2.3%). If inflation prints as we expect, we are confident that the RBA Board will deliver another 25bp rate cut in May.
Before moving offshore, a final note on housing. The post rate cut bounce in dwelling prices looks to have extended into March, up 0.4% following a 0.3% gain in February. While we still expect momentum to remain positive this year, we doubt there is much scope for the current pace to strengthen further. Longer-term prospects depend critically on the outlook for supply; the latest data dwelling approvals is mildly constructive on this front, having risen 26% over the past year, though this is still well short of the required pace to reach the Housing Accord target.
Offshore, the focus remained on US tariffs all week. On April 2, “Liberation Day”, US President Donald Trump announced the immediate implementation of reciprocal tariffs. While Trump described these rates as being based on the US' country-by-country estimates of monetary and non-monetary barriers US firms face in other countries, economists were quick to calculate the tariffs are half of each nation’s trade surplus with the US divided by total imports to the US. For China and Taiwan, it will be 34% and 32%; for India 26%; for Europe 20%; and for the UK, Australia and New Zealand, 10% – the lowest possible rate, regardless of if a country imposes any barriers to US firms or not.
While of limited significance for global growth, small developing markets will be particularly hard hit; Cambodia as an example faces a 49% tariff rate. It is expected that these tariffs will boost revenues and entice manufacturing investment in the US, but the cost of doing so and immense uncertainty over the policy outlook is likely to hold many firms back.
In response to these tariffs, ECB member Nagel said the ECB needs to "reassess" the current situation, with "the US administration’s decision to impose tariffs endanger[ing] global economic stability." The European Commission President von der Leyen noted that that the EU is "prepared to respond" to US tariffs, "already finalising a first package of countermeasures in response to tariffs on steel…[and] now preparing for further countermeasures". China is also likely to respond swiftly – the response and counter-response by the US likely to prove a key theme next week.
We remain of the view that the US is most at risk from its own measures. Early signs of weakness in their economy can already be seen. The ISM manufacturing PMI index dropped 1.3pt to 49.0. The detail of the survey highlighted a rapid adjustment to demand, the new orders index falling 3.4pt to 45.2, the lowest level in almost two years, almost 10pts below January’s level. Companies also reported declining production volumes, falling headcount and rising inventories.
On the services side, the headline index declined from 53.5 to 50.8 in March. Business activity edged higher in the month, from 54.4 to 55.9; but new orders declined, from 52.2 to 50.4, and the backlog of orders were worked through aggressively, this index declining from 51.7 to 47.4. The decline in the employment index was most notable however, from 53.9 to 46.2. At face value, this result and that of the manufacturing sector points to outright declines in employment in coming months.
Tonight, the March employment report will be closely scrutinised. To date, it has been sentiment that has held back spending. If the labour market deteriorates, the US could find itself struggling through a persistent period of contraction, bearing in mind that the Atlanta Federal Reserve’s nowcast of GDP suggests activity declined 2.8% annualised in Q1, albeit largely as a result of a pull-forward of imports to get ahead of the impending tariffs.
Ending on a positive note, China and Asia have considerable capacity to offset the negative consequences of US trade policy in the short term through stimulus and by enticing private investment related to the region’s ongoing economic development. Into the medium-term, continued growth in the region’s population, industry and household incomes will deepen exposed nations’ export markets, reducing the significance of the US market to the world. Australia is well positioned to benefit from this growth and economic development.
USD/JPY Takes a Hit—Will Bears Extend Their Grip?
Key Highlights
- USD/JPY started a major decline from the 150.50 resistance zone.
- It traded below a key bullish trend line with support at 149.20 on the 4-hour chart.
- EUR/USD surged above the 1.1000 resistance zone.
- Gold prices corrected gains and traded below the $3,100 level.
USD/JPY Technical Analysis
The US Dollar faced a strong rejection near 150.50 against the Japanese Yen. USD/JPY started a major decline below the 149.50 and 148.80 levels.
Looking at the 4-hour chart, the pair settled below the 148.50 level, the 100 simple moving average (red, 4-hour), and the 200 simple moving average (green, 4-hour). It traded below a key bullish trend line with support at 149.20.
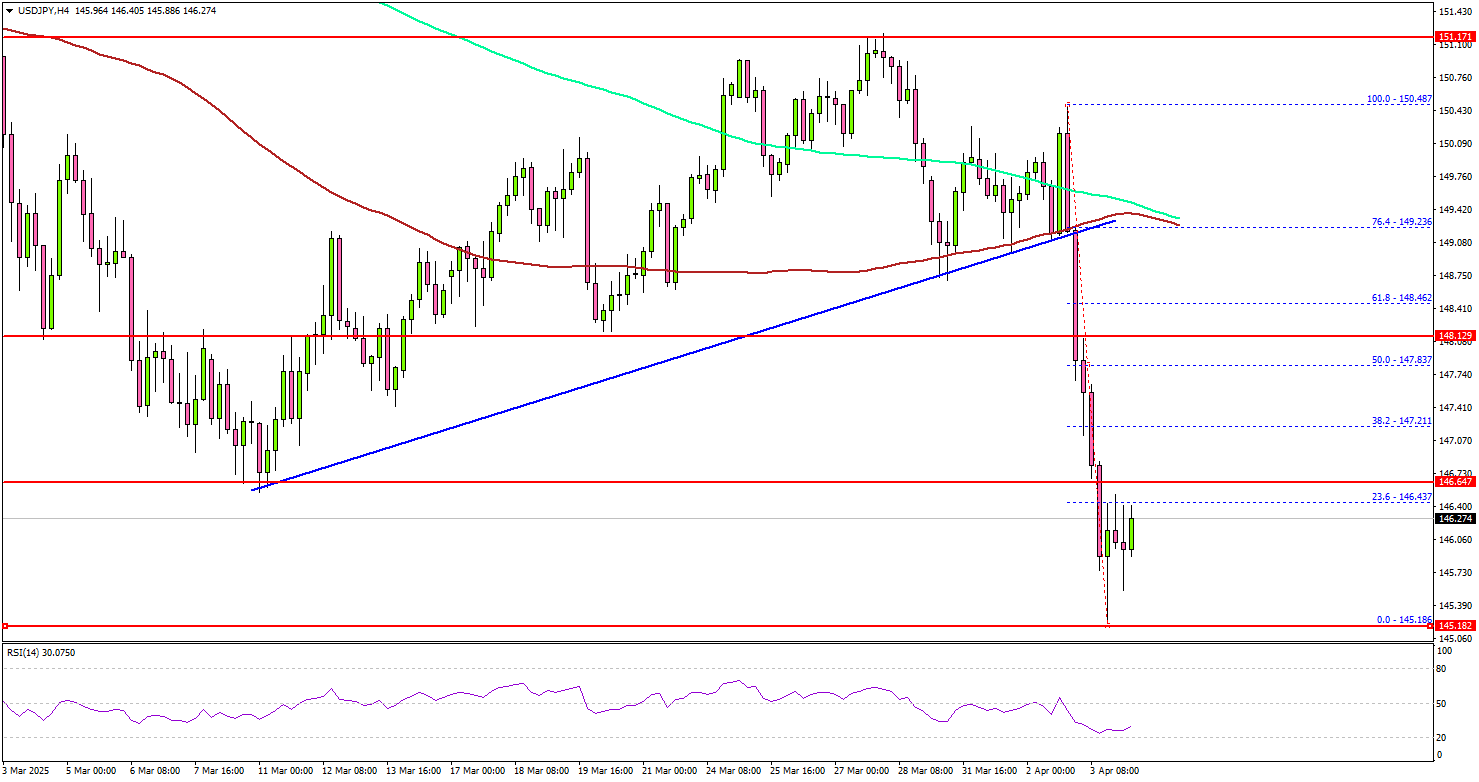
The pair even tested the 145.50 support. If there is a recovery wave, the pair could face resistance near the 146.65 level. The next major resistance is near the 147.20 level.
The main resistance is now forming near the 148.00 zone. A close above the 148.00 level could set the tone for another increase. In the stated case, the pair could even clear the 148.50 resistance.
On the downside, immediate support sits near the 145.50 level. The next key support sits near the 145.00 level. Any more losses could send the pair toward the 144.20 level.
Looking at Gold, the price started a sharp downside correction and there was a clear move below the $3,100 level.
Upcoming Economic Events:
- US nonfarm payrolls for March 2025 – Forecast 140K, versus 151K previous.
- US Unemployment Rate for March 2025 - Forecast 4.1%, versus 4.1% previous.
BoJ’s Ueda: US tariffs likely to pressure Japan’s economy
BoJ Governor Kazuo Ueda warned that the 24% tariffs imposed by the US on Japanese goods could have broad implications. He emphasized that heightened uncertainty over the economic outlook may weigh on corporate sentiment and trigger volatile market behavior. This, in turn, could place "downward pressure on global and Japanese economies".
Meanwhile, Ueda noted that the effect on inflation remains uncertain, as the tariffs could either suppress prices by weakening demand or push them higher through supply chain disruptions.
Despite these concerns, Ueda maintained a cautiously optimistic view on Japan’s economy. He pointed out that corporate sentiment remains positive, and capital expenditure plans are stronger than in the same period of prior years.
He referred to the latest Tankan survey as supportive of BoJ's baseline view that Japan’s economy is "recovering moderately". Still, Ueda noted that the survey, conducted from late February to March 31, may not have fully captured the impact of the US tariff announcements.
BoJ Deputy Governor Shinichi Uchida, also speaking at the session, reiterated that the central bank remains committed to adjusting rates if the likelihood of achieving its 2% inflation target increases.
Uchida emphasized that future policy decisions will be made on a meeting-by-meeting basis, based on updated forecasts, "without any preconception".
Fed’s Cook: Risks tilt toward high inflation and slower growth
Fed Governor Lisa Cook highlighted in a speech overnight that her baseline forecast sees the US economy will "slow moderately" this year, with a slight uptick in unemployment. Also, inflation progress will "stall in the near term", because of tariffs and other policy changes.
Cook acknowledged the potential for a more optimistic scenario in which new policies prove minimally disruptive and consumer demand holds up, allowing for stronger-than-expected growth.
However, she placed "more weight on scenarios where risks are skewed to the upside for inflation and to the downside for growth".
Given the elevated risks and uncertainty, Cook supports the case to keep interest rates unchanged for now. With both sides of the Fed’s dual mandate facing uncertainty and risks, she stressed that policymakers must remain "patient but attentive".
Fed’s Jefferson: Important to take time and think carefully amid sweeping policy shifts
Fed Vice Chair Philip Jefferson reiterated in a speech overnight that there is "no need to be in a hurry" to adjust policy further. Current policy settings are appropriately positioned amid a period of sweeping changes in trade, immigration, fiscal, and regulatory policies.
He stressed the importance of assessing the "cumulative effect" of these evolving policies before making any shifts in the monetary path.
Commenting on the new of import tariffs announced this week after the formal remarks, Jefferson acknowledged the heightened uncertainty such measures introduce, adding that they could weigh on household sentiment and business investment.
In this environment, Jefferson said it is important to “take our time and think carefully” as it evaluates the broader economic impact.
Strategic Implications of “Liberation Day”
Summary
Liberation Day in the United States came with extremely protectionist and inward-looking tariff policy aimed at just about all U.S. trading partners. In this report, we outline some of the more strategic implications of Liberation Day and developments we will be paying close attention to going forward.
Strategic Implications of “Liberation Day”
Liberation Day tariffs will provide perhaps the sternest test of our view that markets are experiencing “tariff fatigue.” Liberation Day tariffs were extremely protectionist, and while global equity markets are down sharply this morning, FX markets are not having the same “risk off” reaction. Just looking solely at FX market performance since Liberation Day announcements, one might think the Trump administration lifted all tariffs and provided a warm embrace to globalization and all U.S. trading partners. G10 currencies are rallying across the board, while the most risk-sensitive currencies in the emerging markets are, with only a few exceptions, stronger. In our last two International Economic Outlook publications we have discussed the possibility of FX markets settling into “tariff fatigue”, where market participants have digested the fact that tariffs are here but just shrug them off. Also, “tariff fatigue” in the sense that tariffs are creating a dynamic where post-COVID U.S. exceptionalism has finally run its course. Maybe not a perpetual end to U.S. exceptionalism, but at least for the time being, as U.S. policy uncertainty is elevated and until the economic impact becomes clearer. We have also highlighted that tariff fatigue is causing other economic and policy factors to re-emerge as currency market drivers—such as the possibility of more dovish Fed monetary policy or more expansive Eurozone fiscal policy. While we forecast dollar strength going forward, our tariff fatigue view has played a role in our view that the rise in the U.S. dollar will not be as pronounced as we previously envisaged. While foreign currency strength immediately following Liberation Day is perplexing, the next few weeks and months will be a good test of whether tariff fatigue is still taking hold. Looking ahead, even if tariff fatigue does appear to be sinking in, we still struggle with the idea that U.S. dollar should outright weaken. In that sense, we remain comfortable with our view that the greenback should strengthen in the current climate, but may adjust the overall magnitude of dollar strength lower again if we observe stronger signs of tariff fatigue.
Liberation Day will also be a strong test of our deglobalization and fragmentation view. If there is a view on which we hold particularly high conviction, it is our view that deglobalization is set to continue for the foreseeable future. President Trump may be looking to actively encourage deglobalization with tariffs and renegotiating free-trade deals, although we also believe a further reduction in the connectedness of the global economy will continue well after President Trump's second term ends. We have also observed clear signs of global economic fragmentation—our view that the global economy is fracturing into two distinct economic blocs: one led by the U.S. and one led by China—is a trend that is likely to gather momentum in the years ahead as a result of Liberation Day. Evidence suggests certain countries, particularly in the emerging and developing world, opted for the China bloc over the course of Trade War 1.0, a pattern that is likely to repeat in Trade War 2.0. One dynamic we will be focused on following Liberation Day is whether the momentum behind countries choosing to economically and geopolitically integrate with China as opposed to the U.S. picks up pace. Taking deglobalization and fragmentation a step further, in addition to a decisive shift away from China over the years, the Trump administration has also signaled a shift away from Europe this year. Tariffs on the EU signal an economic shift away from Europe, while Trump communicating reduced support for Ukraine and potentially a weaker commitment to the NATO defense pact also does not bode well for the U.S.-Europe relationship, and economic integration. Point being, Liberation Day could also mark an inflection point in fragmentation. Meaning, is the global economy shifting from a bi-polar world (U.S. vs. China) to a tri-polar world (U.S. vs. China vs. Europe)? This potential move to a tri-polar world, one defined by economic blocs with cross-tariffs on each other, is a scenario we now plan on exploring for the impact on the global economy.
Is Liberation Day still part of President Trump's “escalate to negotiate” strategy? Probably. As we noted two weeks into President Trump's administration, the “escalate to negotiate” strategy still seems to be the go-to approach to seek concessions. While the bar to find common ground on trade is high and elusive, tariffs are likely still negotiable. Granted, some countries are likely to impose retaliatory tariffs and be unwilling to negotiate (i.e., China, EU and Canada), while others, in particular countries with little leverage, may be more inclined to make a deal with the U.S. administration. Key elements of these deals are likely to be similar to the concessions President Trump has sought since day one: buy more U.S. product and improve/cheapen access to foreign markets. Make no mistake, we thoroughly believe one of President Trump's motivations is significantly reducing dependence on foreign countries (among other objectives) and tariff policies will net out to be a deglobalization force, but we would be far from shocked if countries ultimately decided to lower tariff rates imposed on the U.S. and make other commitments to appease the U.S. administration. But even if select tariff rates are lowered, tariff uncertainty is likely to linger. President Trump has used tariff threats to enforce immigration, drug control and coordinated containment on China already, and if those objectives are perceived as not being met, tariff rates could still ratchet higher. Overall, tariff rates could be adjusted in either direction, meaning tariff uncertainty is set to linger for an extended period of time.
Finally, the probability low-income developing market sovereign defaults appears to be increasing. Liberation Day tariffs extend to low-income countries across Southeast Asia and Africa, countries that struggle with a lack of economic diversification and are heavily reliant on trade with the United States. In recent years, after the worst of COVID, sovereign defaults have been avoided; but default probabilities for certain targeted countries are likely to rise significantly. Our emerging and frontier market sovereign default sensitivity framework already identify a few sovereigns that face repayment capacity issues, and tariffs are now likely to compound those challenges. While individual sovereign defaults in frontier Southeast Asia and African nations are likely not impactful enough to have a material impact on investor sentiment or the global economy, multiple and simultaneous defaults could have a more profound impact on market sentiment. Also, numerous defaults could also result in spillovers to other parts of the emerging world, while spillbacks on the U.S. economy cannot be ruled out either. For now, our framework looks at repayment capacity through the lens of cash flow metrics, the sovereign debt profile as well as reserve buffers—but with tariffs extending across regions and countries, we will update our framework to highlight tariff and U.S.-trade related vulnerabilities for new default candidates. Also, we will be keeping an eye on actions from rating agencies. Fitch already moved forward with a downgrade to China's sovereign rating—which was likely to happen irrespective of tariffs—although new and aggressive levies likely accelerated that downgrade action. Losing investment grade status for select sovereigns could result in capital outflows that pressure economies and also increase default probabilities.
EURUSD: Uncertain Inflation Creates Growth Risks
Technical Analysis
- Current ECB Interest Rate: 4.00%
- Rate Cut Probability (17th April Meeting): 90%
- Euro Performance: Surging in recent weeks
- Bond Yields & Energy Prices: Falling, easing inflation pressures
Fundamental Factors Affecting the Eurozone
- Impact of U.S. Tariffs
- It is expected to affect economic growth by disrupting trade and supply chains.
- Uncertainty increases the risk of undershooting the inflation target in the medium term.
- Retaliatory tariffs from the EU could cause short-term inflation spikes.
- ECB’s Policy Stance
- The bank has cut rates six times since June 2024.
- Open to further easing but cautious due to uncertain inflation outlook.
- Policymakers stress that caution does not mean gradual easing, suggesting potential decisive action if conditions worsen.
- Market Expectations for Rate Cuts
- Investors expect another rate cut on 17th April and two more later in 2025.
- Falling bond yields and energy prices support the case for easing.
- Geopolitical & Fiscal Uncertainty
- EU retaliation to U.S. tariffs could push inflation higher.
- Increased global fragmentation raises costs for businesses, adding inflationary pressures.
- Higher defense spending may boost demand and inflation.
Key Takeaway for Traders
- Short-term: The euro’s recent strength may stall if the ECB signals aggressive rate cuts.
- Medium-term: Trade disruptions & rate cuts could weaken the euro against major currencies.
- Long-term: If tariffs damage growth, the ECB may need to extend easing measures beyond 2025.
- FX Impact: A dovish ECB and economic slowdown could weigh on the euro, while a hawkish shift due to inflation risks could limit downside moves.
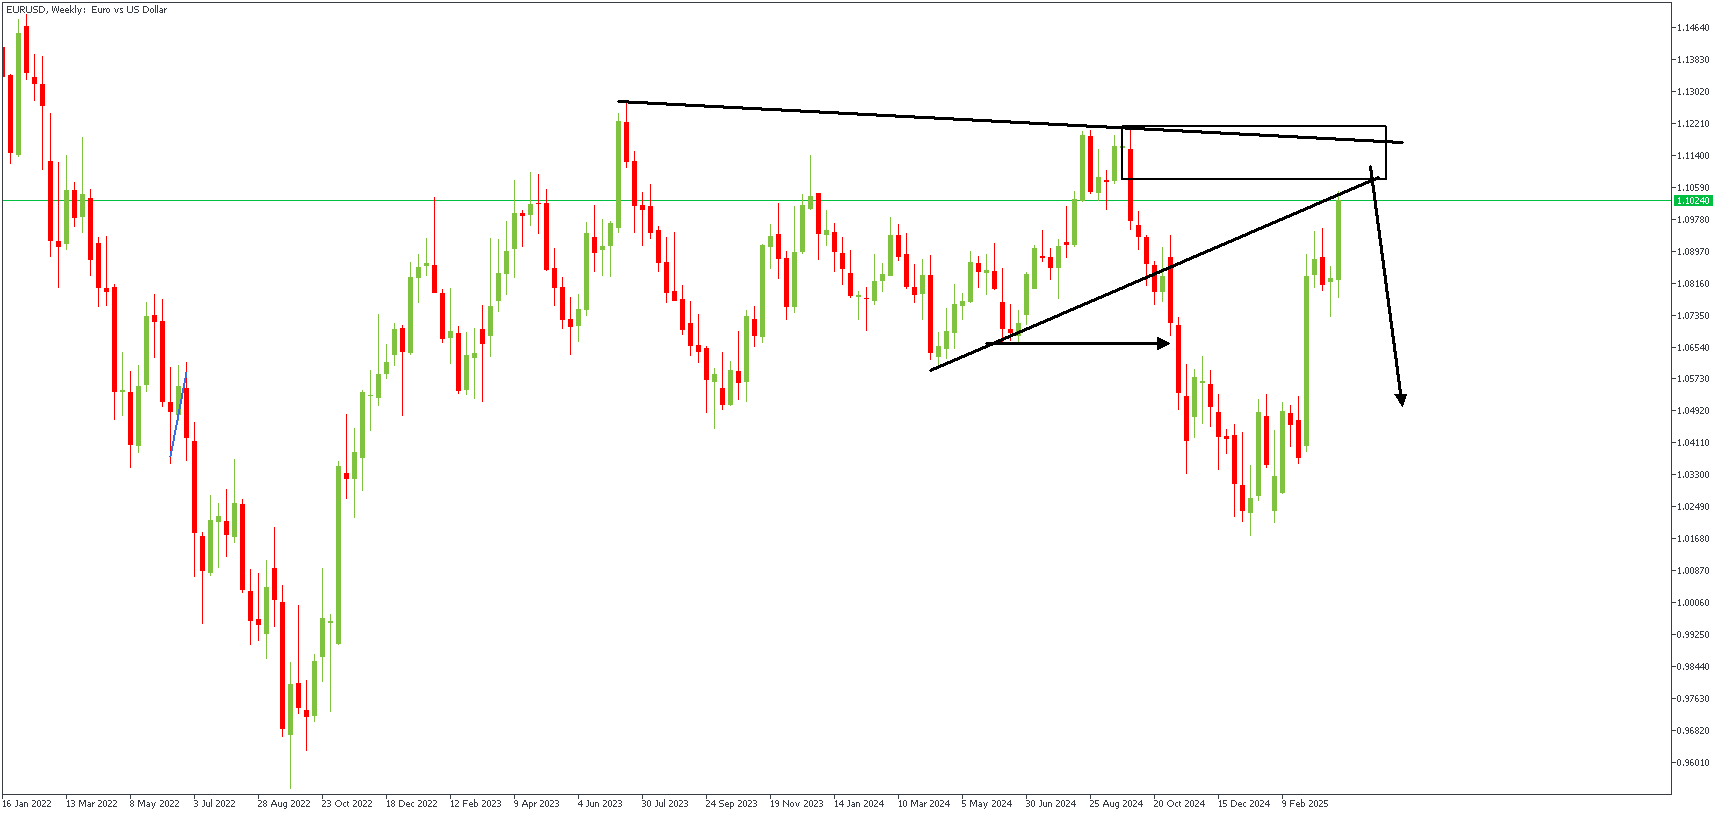
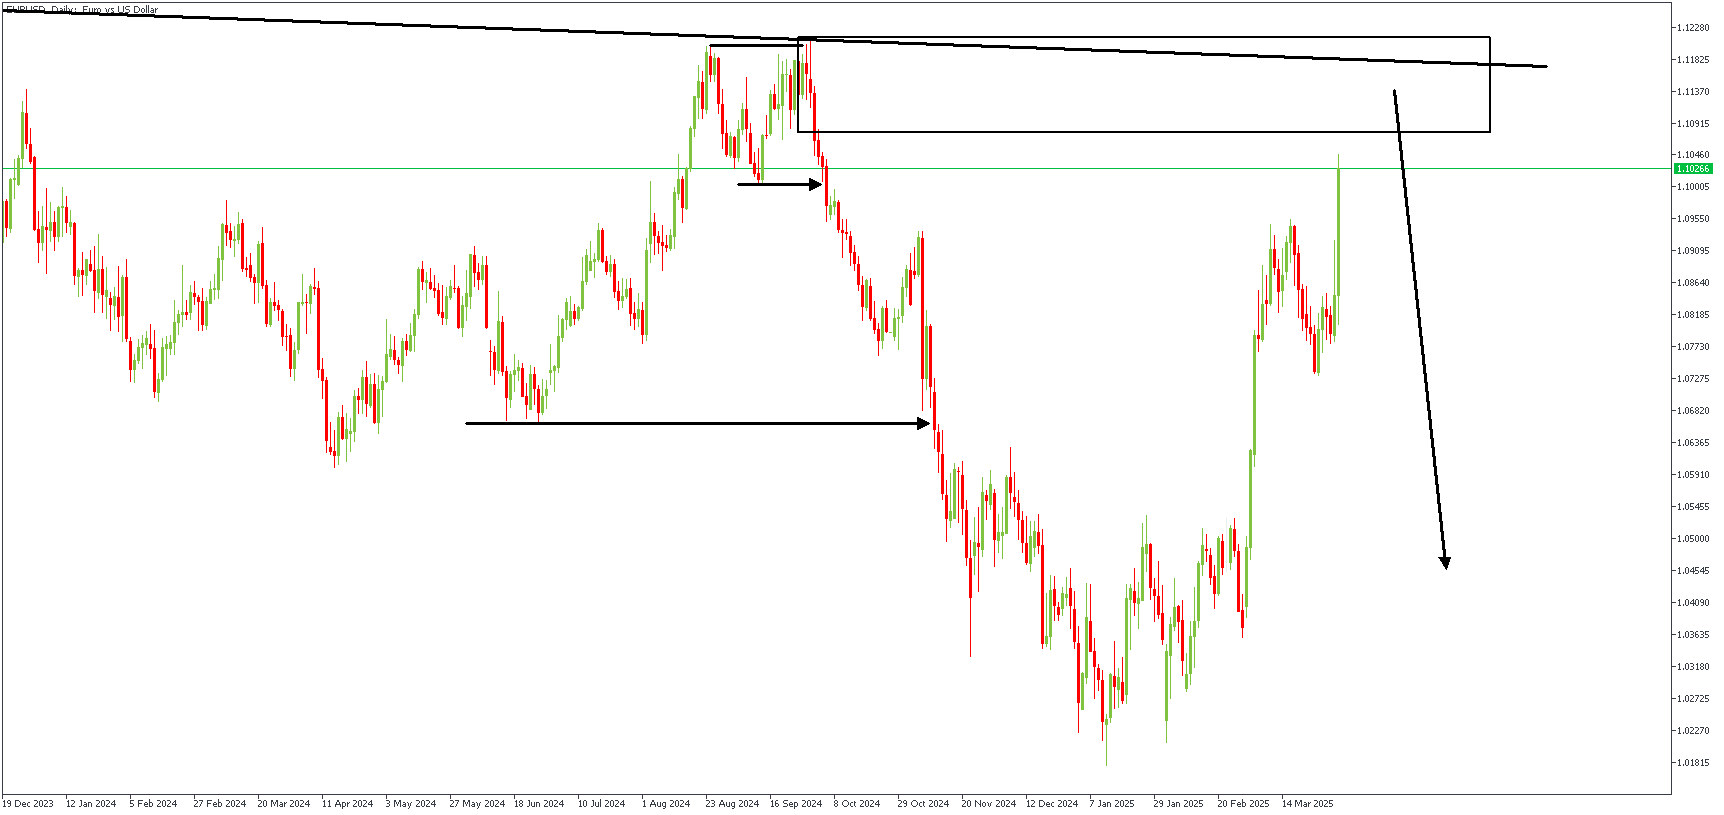
EURUSD – W1 Timeframe
The weekly timeframe chart of EURUSD shows the price currently resting within the supply region, with additional confluence from the double resistance trendlines. The Fibonacci retracement of the previous bearish impulse puts the supply zone at the 88% mark, setting the precedence for the bearish sentiment.
EURUSD – D1 Timeframe
On the daily timeframe chart of EURUSD, we see the SBR pattern formed at the tip of the swing high, with an FVG and inducement. The bearish sentiment is further justified by the presence of equal highs swept by the recent bullish leg of the retracement.
Analyst’s Expectations:
- Direction: Bearish
- Target- 1.04594
- Invalidation- 1.12712
EURUSD Wave Analysis
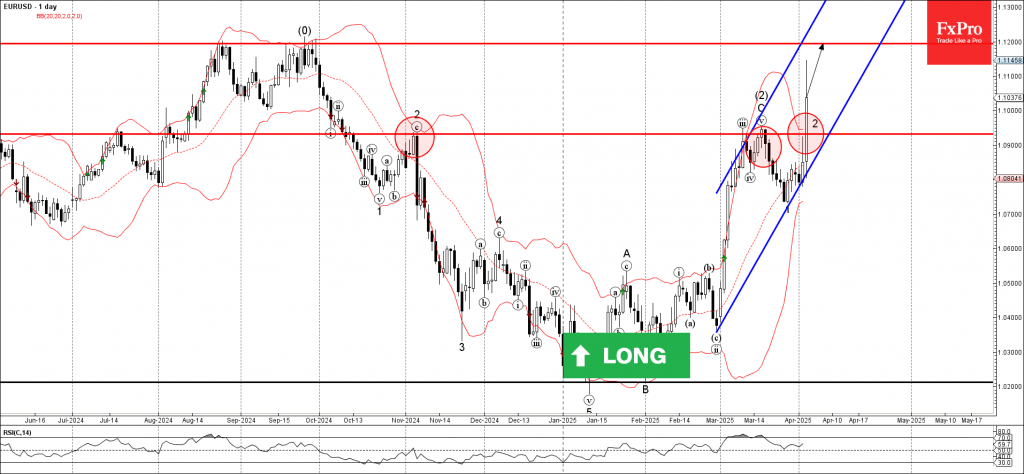
EURUSD: ⬆️ Buy
- EURUSD broke key resistance level 1.0930
- Likely to rise to the resistance level 1.1200
EURUSD currency pair recently broke the key resistance level 1.0930 (which has been reversing the price from November – having stopped the previous waves 2 and (2), as can be seen below).
The breakout of the resistance level 1.0930 continues the short-term correction 2 from the end of last month.
Given the strongly bearish US dollar sentiment seen today, EURUSD currency pair can be expected to rise to the next significant resistance level 1.1200 (the former monthly high from August and September).
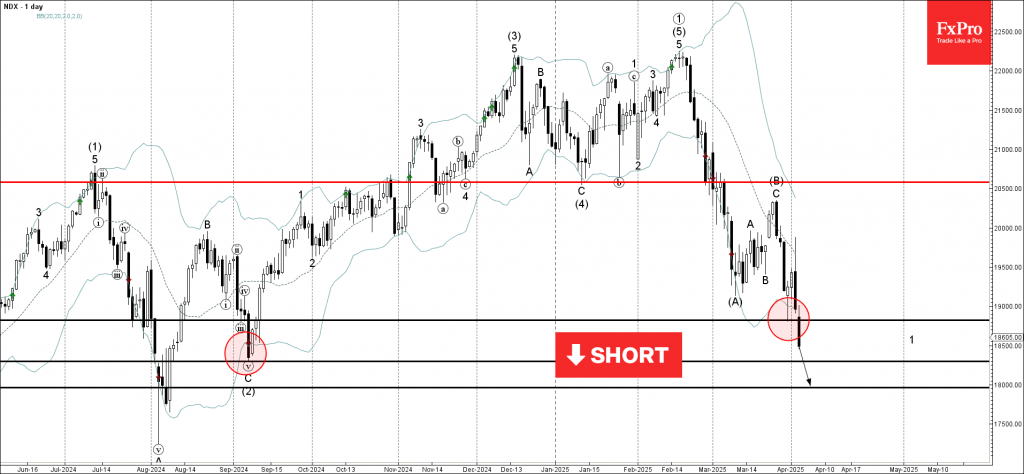
Nasdaq-100 Wave Analysis
Nasdaq-100: ⬇️ Sell
- Nasdaq-100 index broke support level 18820.00
- Likely to fall to support level 18295.00
Nasdaq-100 index recently broke the key support level 18820.00 (the previous monthly low from the end of March).
The breakout of this support level 18820.00 accelerated the minor impulse wave 1 of the intermediate impulse wave (C) from February.
Nasdaq-100 index can be expected to fall to the next support level 18295.00 (former monthly low from September) – the breakout of which can lead to further losses to 18000.00.