
Sample Category Title
USD/JPY Mid-Day Outlook
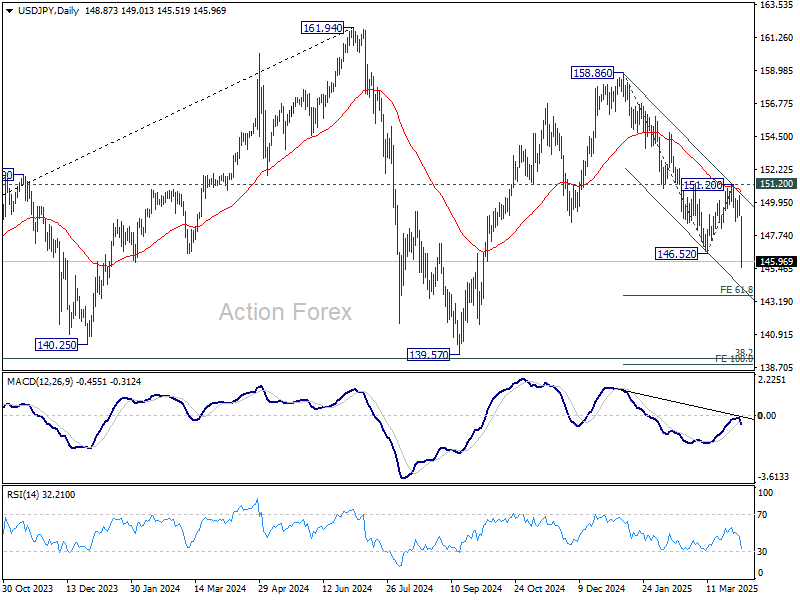
Daily Pivots: (S1) 148.80; (P) 149.64; (R1) 150.19; More...
Break of 146.52 support confirms resumption of decline from 158.86. Intraday bias remains on the downside for s 61.8% projection of 158.86 to 146.52 from 151.20 at 143.57. On the upside, above 147.45 minor resistance will turn intraday bias neutral and bring consolidations first, before staging another decline.
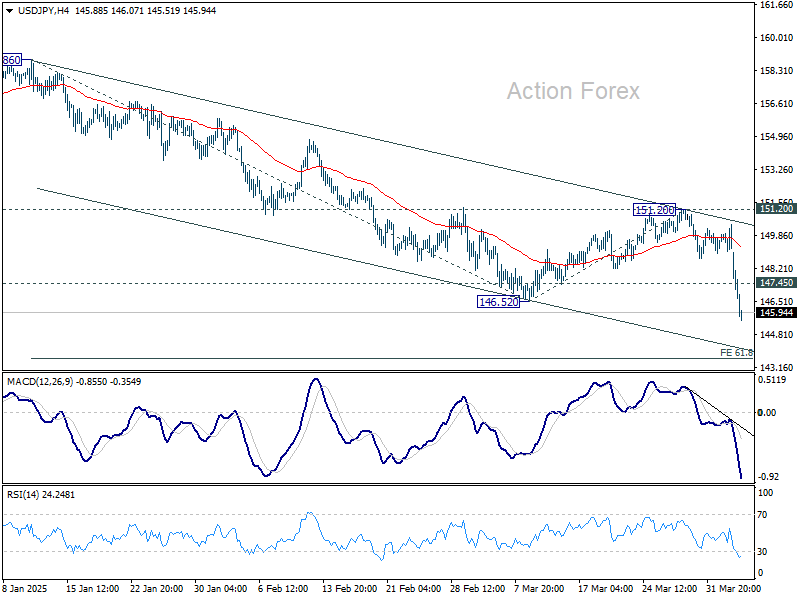
In the bigger picture, price actions from 161.94 are seen as a corrective pattern to rise from 102.58 (2021 low), with fall from 158.86 as the third leg. Strong support should be seen from 38.2% retracement of 102.58 to 161.94 at 139.26 to bring rebound. However, sustained break of 139.26 would open up deeper medium term decline to 61.8% retracement at 125.25.
USD/CHF Mid-Day Outlook
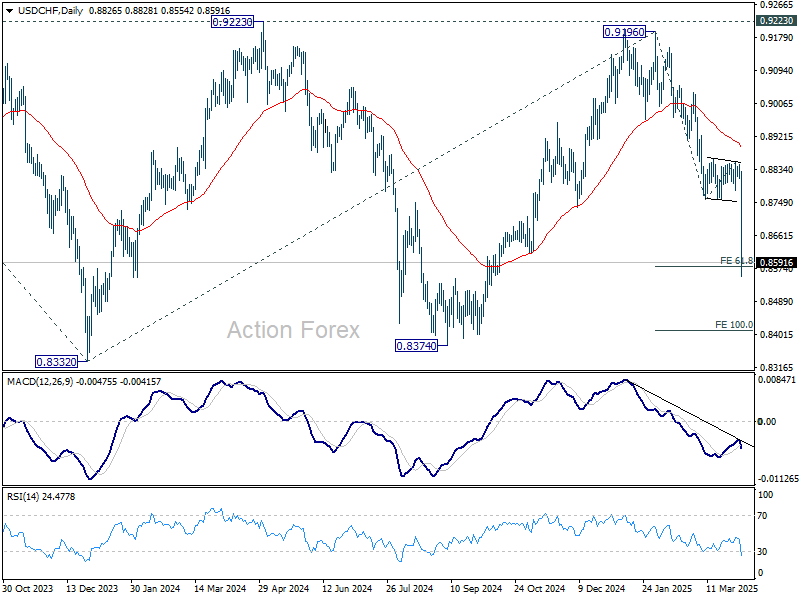
Daily Pivots: (S1) 0.8805; (P) 0.8827; (R1) 0.8841; More…
USD/CHF's decline accelerated to as low as 0.8554 so far today and met 61.8% projection of 0.9196 to 0.8757 from 0.8854 at 0.8583 already. Intraday bias stays on the downside. Sustained trading below 0.8583 will pave the way to 100% projection at 0.8415. On the upside, above 0.8663 minor resistance will turn intraday bias neutral and bring consolidations first. Before staging another fall.
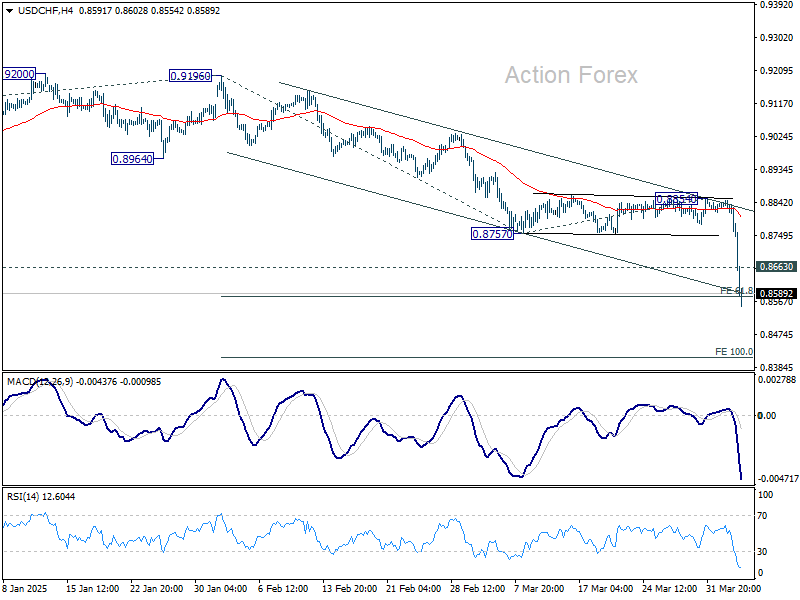
In the bigger picture, rejection by 0.9223 key resistance keep medium term outlook bearish. That is, larger fall from 1.0342 (2017 high) is not completed yet. Firm break of 0.8332 (2023 low) will confirm down trend resumption. Next target is 61.8% projection of 1.0146 (2022 high) to 0.8332 from 0.9196 at 0.8075.
GBP/USD Mid-Day Outlook
Daily Pivots: (S1) 1.2932; (P) 1.2979; (R1) 1.3056; More...
GBP/USD accelerates higher today and intraday bias stays on the upside. Current rally from 1.2099 will target 61.8% projection of 1.2248 to 1.3013 from 1.2878 at 1.3351. On the downside, below 1.3101 minor support will turn intraday bias neutral and bring consolidations first, before staging another rally.
In the bigger picture, up trend from 1.3051 (2022 low) is not completed. Resumption is expected after corrective pattern from 1.3433 completes. Next target will be 1.4248 key resistance (2021 high). This will now remain the favored case as long as 1.2099 support holds.
EUR/USD Mid-Day Outlook
Daily Pivots: (S1) 1.0785; (P) 1.0855; (R1) 1.0929; More...
EUR/USD's rally accelerates to as high as 1.1145 so far, and met 61.8% projection of 1.0358 to 1.0953 from 1.0731 at 1.1099 already. Intraday bias stays on the upside. Sustained trading above 1.1099 will pave the way 1.1274 key resistance, and probably further to o 100% projection at 1.1326. On the downside, below 1.1002 minor support will turn intraday bias neutral and bring consolidations, before staging another rise.
In the bigger picture, prior strong break of 55 W EMA (now at 1.0692) suggests that fall from 1.1274 (2024 high) has completed as a three wave correction to 1.0176. Rise from 0.9534 is still intact, and might be ready to resume. Decisive break of 1.1274 will target 100% projection of 0.9534 to 1.1274 from 1.0176 at 1.1916. Also, that will send EUR/USD through a multi-decade channel resistance will carries larger bullish implication. This will now be the favored case as long as 1.0731 support holds.
Tariff Sparks Risk Exodus; Euro Rises as Preferred Shelter
Risk-off sentiment swept across global financial markets today following the U.S. announcement of sweeping reciprocal tariffs. The sheer scale, complexity, and breadth of the trade measures surprised investors and rattled confidence. Equities in Europe and Japan suffered broad losses, but the brunt of the selloff appears to be landing squarely on US markets, where the mood has sharply deteriorated.
Now the spotlight turns to whether bargain hunters will step in to stabilize equity markets and provide some relief through the rest of the week. Without a decisive rebound, there is a real risk that the current slide could deepen into a prolonged selloff through the rest of April, especially if the anticipated retaliation from global trading partners begins to materialize in the coming days.
In currency markets, Dollar is being dumped across the board. Aussie is also among the weakest, likely suffering from its exposure to China. Surprisingly, Sterling joined the bottom three, mostly due to heavy selling against Euro and Swiss Franc.
The standout performers are clearly the traditional safe-havens: Yen, Swiss Franc. Notably, Euro is emerging as the key substitute for the greenback in terms of liquidity and market depth. Loonie and Kiwi are holding in the middle.
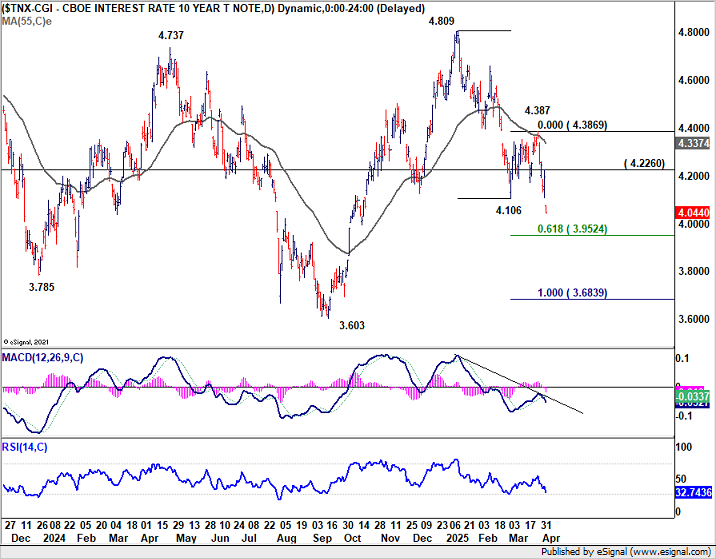
Technically, US 10-year yield's strong break of 4.106 support confirms resumption of the whole decline from 4.809. Risk will now stay heavily on the downside as long as 4.226 resistance holds. Next target is 61.8% projection of 4.809 to 4.106 from 4.387 at 3.952.
Strong support is anticipated there as it's close to 4% mark. However, firm break of 3.952, especially sustained trading below the critical 4% psychological threshold — would likely deal a heavy blow to sentiment and spark even deeper losses in risk assets.
In Europe, at the time of writing, FTSE is down -1.38%. DAX is down -2.13%. CAC is down -2.80%. UK 10-year yield is down -0.111 at 4.536. Germany 10-year yield is down -0.079 at 2.644. Earlier in Asia, Nikkei fell -2.77%. Hong Kong HSI fell -1.52%. China Shanghai SSE fell -0.24%. Singapore Strait Times fell -0.30%. Japan 10-year JGB yield fell -0.129 to 1.351.
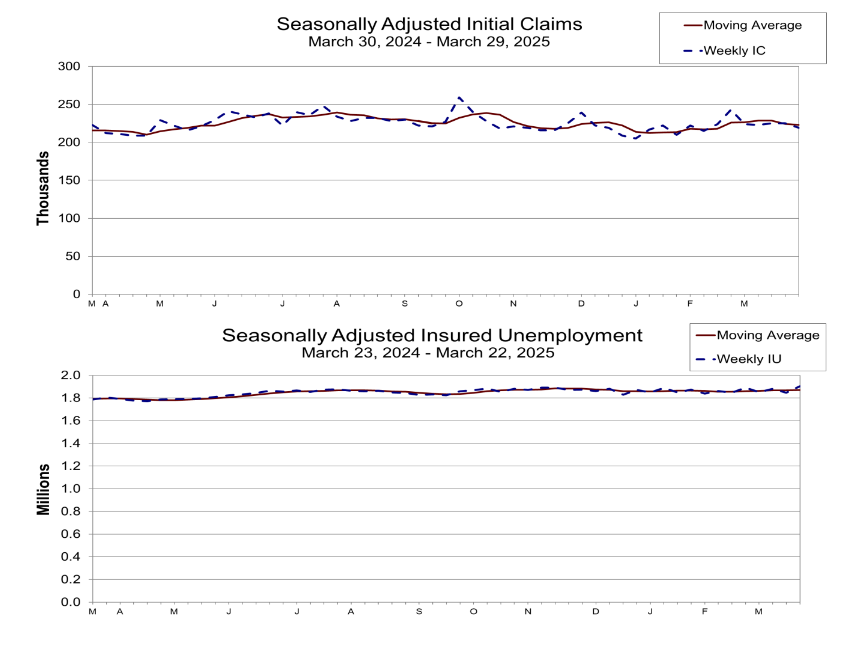
US initial jobless claims fall to 219k vs exp 225k
US initial jobless claims fell -6k to 219k in the week ending March 29, below expectation of 224k. Four-week moving average of initial claims fell -1k to 223k.
Continuing claims rose 56k to 1903k in the week ending March 22, highest since November 13, 2021. Four-week moving average of continuing claims rose 3k to 1871k.
ECB Accounts: March debate leaves April meeting open to cut or hold
ECB’s March 5-6 meeting accounts revealed a heated debate among Governing Council members over both the 25bps rate cut decision and the tone of accompanying communications.
With considerable uncertainty clouding the outlook—ranging from global trade policy to persistent services inflation—many policymakers urged caution, particularly in avoiding language that could be construed as forward guidance. The balance of risks, especially from tariff escalations and uneven disinflation, made it clear that any commitment to further cuts would be premature.
A few members were only willing to support the March rate cut on the condition that the policy statement "avoided any indication of future cuts or of the future direction of trave".
This led to a debate on whether to remove the phrase “monetary policy remains restrictive”. In the end, Chief Economist Philip Lane’s proposed compromise—“monetary policy is becoming meaningfully less restrictive”—was broadly accepted.
This phrasing was viewed as neutral enough to reflect the evolving inflation outlook without implying a preset path.
Crucially, the ECB emphasized that the revised language should not signal the outcome of April’s meeting. "Both a cut and a pause" are "on the table, depending on the incoming data.
ECB’s Nagel and Stournaras warn of economic fallout from US tariffs
Bundesbank President Joachim Nagel issued a strong warning today, saying the US administration's new tariff measures "endanger global economic stability."
Nagel emphasized the need for strong alliances and fewer trade barriers to tackle today’s global challenges, adding that the US is pursuing a "completely different direction" with economic policies that could leave many losers—especially within its own borders.
Echoing these concerns, Greek ECB Governing Council member Yannis Stournaras said the US tariffs are expected to weigh on Eurozone GDP growth rate by 0.3% to 0.4% in the first year, though he noted that the broader inflation outlook remains unaffected.
Stournaras added that the US tariffs were “not an obstacle” to an ECB rate cut in April.
Eurozone PPI rises 0.2% mom, 3.0% yoy in Feb
Eurozone PPI rose 0.2% mom and 3.0% yoy in February. The monthly gain was primarily driven by a 0.4% mom increase in prices for intermediate goods, alongside smaller rises in energy (0.2% mom) and capital goods (0.2% mom) prices. Prices for durable consumer goods slipped slightly, down -0.1% mom, while non-durable consumer goods posted a mild 0.1% mom uptick. Excluding energy, total industrial prices increased by 0.2% mom.
Across the broader EU, PPI rose 0.3% mom on the month and 3.1% yoy. The strongest monthly gains were recorded in Estonia (+9.5%), Romania (+4.8%), and Bulgaria (+2.5%), while declines were seen in Ireland (-4.9%), France, and Slovakia (both -0.8%).
Eurozone PMI composite finalized at 50.9, steady but shaky
Eurozone’s private sector continued to show signs of stabilization in March, with PMI Composite finalized at 50.9 — the highest in seven months — up from February's 50.2. PMI Services was finalized at 51.0, up from prior month's 50.6.
Among the major economies, Germany stood out with a 10-month high at 51.3, while France remained in contraction despite improving to a five-month high at 48.0.
Cyrus de la Rubia, Chief Economist at Hamburg Commercial Bank, acknowledged that recession fears that loomed late last year are now giving way to cautious optimism. The Eurozone has managed to stay in growth territory for three straight months.
Still, he warned that this fragile recovery could be easily thrown "off course again" by external shocks — namely, the newly announced US reciprocal tariffs.
UK PMI services finalized at 52.5, outlook and employment subdued
UK PMI Services was finalized at 52.5 in March, up from 51.0 in February, marking the highest level since August 2024. PMI Composite also improved to 51.5, a five-month high.
The modest recovery in overall business activity was driven primarily by strength in the technology and financial services sectors, according to Tim Moore at S&P Global. However, this was offset by notable weakness in manufacturing, which experienced its steepest decline in output since October 2023.
However, service providers expressed limited optimism about the near-term outlook, with confidence levels hovering near two-year lows. The labor market also continued to show signs of strain, with March marking the sixth consecutive month of job losses due to hiring freezes and redundancies.
Price pressures remain a concern. The inflation indicators within the survey suggest that cost and pricing pressures in the services sector are still running significantly hotter than the pre-pandemic decade.
Swiss CPI unchanged at 0.3% yoy in Mar, misses expectations
Swiss consumer inflation remained subdued in March, with headline CPI unchanged on the month, below the expected 0.1% mom rise. Core CPI (excluding fresh and seasonal products, energy and fuel) rose just 0.1% mom. The breakdown showed a -0.1% mom decline in domestic product prices, offset somewhat by a 0.5% mom rise in prices of imported products.
On an annual basis, headline CPI held steady at just 0.3% yoy, missing expectations for an uptick to 0.5% yoy. Core inflation also remained unchanged at 0.9% yoy. The slight increase in domestic product inflation from 0.9% yoy to 1.0% yoy suggests some persistence in local cost pressures. But overall imported inflation remains deeply negative at -1.7% yoy, down from -1.5% yoy.
Japan’s PMI composite finalized at 48.9, back in contraction
Japan’s services sector lost momentum in March, with the final PMI Services reading falling to the neutral mark of 50.0, down sharply from 53.7 in February. Composite PMI dropped to 48.9—its lowest since November 2022—signaling contraction in overall private sector activity.
S&P Global’s Annabel Fiddes noted that while new orders and export business in services remained in growth territory, market conditions had clearly softened.
Additionally, input costs across the private sector rose at the fastest pace in seven months, and output price inflation remained historically elevated.
Business sentiment also deteriorated, with overall optimism about the year-ahead outlook for output falling to its lowest since January 2021.
China’s Caixin PMI services rises to 51.9, but deflation and jobs remain concerns
China’s Caixin Services PMI ticked up to 51.9 in March from 51.4, while Composite PMI rose to 51.8 from 51.5, marking the 17th consecutive month of expansion.
According to Caixin Insight Group’s Wang Zhe, both supply and demand showed improvement, particularly in manufacturing. However, service sector employment dragged overall job growth, and price pressures remained weak.
Despite signs of recovery and a stable start to the year, persistent deflationary pressures and a sluggish job market continue to weigh on sentiment. Wang noted that weak domestic demand and cautious market expectations were limiting momentum.
EUR/USD Mid-Day Outlook
Daily Pivots: (S1) 1.0785; (P) 1.0855; (R1) 1.0929; More...
EUR/USD's rally accelerates to as high as 1.1145 so far, and met 61.8% projection of 1.0358 to 1.0953 from 1.0731 at 1.1099 already. Intraday bias stays on the upside. Sustained trading above 1.1099 will pave the way 1.1274 key resistance, and probably further to o 100% projection at 1.1326. On the downside, below 1.1002 minor support will turn intraday bias neutral and bring consolidations, before staging another rise.
In the bigger picture, prior strong break of 55 W EMA (now at 1.0692) suggests that fall from 1.1274 (2024 high) has completed as a three wave correction to 1.0176. Rise from 0.9534 is still intact, and might be ready to resume. Decisive break of 1.1274 will target 100% projection of 0.9534 to 1.1274 from 1.0176 at 1.1916. Also, that will send EUR/USD through a multi-decade channel resistance will carries larger bullish implication. This will now be the favored case as long as 1.0731 support holds.
US initial jobless claims fall to 219k vs exp 225k
US initial jobless claims fell -6k to 219k in the week ending March 29, below expectation of 225k. Four-week moving average of initial claims fell -1k to 223k.
Continuing claims rose 56k to 1903k in the week ending March 22, highest since November 13, 2021. Four-week moving average of continuing claims rose 3k to 1871k.
ECB Accounts: March debate leaves April meeting open to cut or hold
ECB’s March 5-6 meeting accounts revealed a heated debate among Governing Council members over both the 25bps rate cut decision and the tone of accompanying communications.
With considerable uncertainty clouding the outlook—ranging from global trade policy to persistent services inflation—many policymakers urged caution, particularly in avoiding language that could be construed as forward guidance. The balance of risks, especially from tariff escalations and uneven disinflation, made it clear that any commitment to further cuts would be premature.
A few members were only willing to support the March rate cut on the condition that the policy statement "avoided any indication of future cuts or of the future direction of trave".
This led to a debate on whether to remove the phrase “monetary policy remains restrictive”. In the end, Chief Economist Philip Lane’s proposed compromise—“monetary policy is becoming meaningfully less restrictive”—was broadly accepted.
This phrasing was viewed as neutral enough to reflect the evolving inflation outlook without implying a preset path.
Crucially, the ECB emphasized that the revised language should not signal the outcome of April’s meeting. "Both a cut and a pause" are "on the table, depending on the incoming data.
(ECB) Monetary policy accounts
Account of the monetary policy meeting of the Governing Council of the European Central Bank held in Frankfurt am Main on Wednesday and Thursday, 5-6 March 2025
3 April 2025
1. Review of financial, economic and monetary developments and policy options
Financial market developments
Ms Schnabel started her presentation by noting that, since the Governing Council's previous monetary policy meeting on 29-30 January 2025, euro area and US markets had moved in opposite directions in a highly volatile political environment. In the euro area, markets had focused on the near-term macroeconomic backdrop, with incoming data in the euro area surprising on the upside. Lower energy prices responding in part to the prospect of a ceasefire in Ukraine, looser fiscal policy due to increased defence spending and a potential relaxation of Germany’s fiscal rules had supported investor sentiment. This contrasted with developments in the United States, where market participants’ assessment of the new US Administration’s policy decisions had turned more negative amid fears of tariffs driving prices up and dampening consumer and business sentiment.
A puzzling feature of recent market developments had been the dichotomy between measures of policy uncertainty and financial market volatility. Global economic policy uncertainty had shot up in the final quarter of 2024 and had reached a new all-time high, surpassing the peak seen at the start of the COVID-19 pandemic in 2020. By contrast, volatility in euro area and US equity markets had remained muted, despite having broadly traced dynamics in economic policy uncertainty over the past 15 years. Only more recently, with the prospect of tariffs becoming more concrete, had stock market volatility started to pick up from low levels.
Risk sentiment in the euro area remained strong and close to all-time highs, outpacing the United States, which had declined significantly since the Governing Council's January monetary policy meeting. This mirrored the divergence of macroeconomic developments. The Citigroup Economic Surprise Index for the euro area had turned positive in February 2025, reaching its highest level since April 2024. This was in contrast to developments in the United States, where economic surprises had been negative recently.
The divergence in investor appetite was most evident in stock markets. The euro area stock market continued to outperform its US counterpart, posting the strongest year-to-date performance relative to the US index in almost a decade. Stock market developments were aligned with analysts’ earnings expectations, which had been raised for European firms since the start of 2025. Meanwhile, US earnings estimates had been revised down continuously for the past eleven weeks.
Part of the recent outperformance of euro area equities stemmed from a catch-up in valuations given that euro area equities had performed less strongly than US stocks in 2024. Moreover, in spite of looming tariffs, the euro area equity market was benefiting from potential growth tailwinds, including a possible ceasefire in Ukraine, the greater prospect of a stable German government following the country’s parliamentary elections and the likelihood of increased defence spending in the euro area. The share prices of tariff-sensitive companies had been significantly underperforming their respective benchmarks in both currency areas, but tariff-sensitive stocks in the United States had fared substantially worse.
Market pricing also indicated a growing divergence in inflation prospects between the euro area and the United States. In the euro area, the market’s view of a gradual disinflation towards the ECB’s 2% target remained intact. One-year forward inflation compensation one year ahead stood at around 2%, while the one-year forward inflation-linked swap rate one year ahead continued to stand somewhat below 2%. However, inflation compensation had moved up across maturities on 5 March 2025. In the United States, one-year forward inflation compensation one year ahead had increased significantly, likely driven in part by bond traders pricing in the inflationary effects of tariffs on US consumer prices. Indicators of the balance of risks for inflation suggested that financial market participants continued to see inflation risks in the euro area as broadly balanced across maturities.
Changing growth and inflation prospects had also been reflected in monetary policy expectations for the euro area. On the back of slightly lower inflation compensation due to lower energy prices, expectations for ECB monetary policy had edged down. A 25 basis point cut was fully priced in for the current Governing Council monetary policy meeting, while markets saw a further rate cut at the following meeting as uncertain. Most recently, at the time of the meeting, rate investors no longer expected three more 25 basis point cuts in the deposit facility rate in 2025. Participants in the Survey of Monetary Analysts, finalised in the last week of February, had continued to expect a slightly faster easing cycle.
Turning to euro area market interest rates, the rise in nominal ten-year overnight index swap (OIS) rates since the 11-12 December 2024 Governing Council meeting had largely been driven by improving euro area macroeconomic data, while the impact of US factors had been small overall. Looking back, euro area ten-year nominal and real OIS rates had overall been remarkably stable since their massive repricing in 2022, when the ECB had embarked on the hiking cycle. A key driver of persistently higher long-term rates had been the market’s reassessment of the real short-term rate that was expected to prevail in the future. The expected real one-year forward rate four years ahead had surged in 2022 as investors adjusted their expectations away from a “low-for-long” interest rate environment, suggesting that higher real rates were expected to be the new normal.
The strong risk sentiment had also been transmitted to euro area sovereign bond spreads relative to yields on German government bonds, which remained at contained levels. Relative to OIS rates, however, the spreads had increased since the January monetary policy meeting – this upward move intensified on 5 March with the expectation of a substantial increase in defence spending. One factor behind the gradual widening of asset swap spreads over the past two years had been the increasing net supply of government bonds, which had been smoothly absorbed in the market.
Regarding the exchange rate, after a temporary depreciation the euro had appreciated slightly against the US dollar, going above the level seen at the time of the January meeting. While the repricing of expectations regarding ECB monetary policy relative to the United States had weighed on the euro, as had global risk sentiment, the euro had been supported by the relatively stronger euro area economic outlook.
Ms Schnabel then considered the implications of recent market developments for overall financial conditions. Since the Governing Council's previous monetary policy meeting, a broad-based and pronounced easing in financial conditions had been observed. This was driven primarily by higher equity prices and, to a lesser extent, by lower interest rates. The decline in euro area real risk-free interest rates across the yield curve implied that the euro area real yield curve remained well within neutral territory.
The global environment and economic and monetary developments in the euro area
Mr Lane started his introduction by noting that, according to Eurostat’s flash release, headline inflation in the euro area had declined to 2.4% in February, from 2.5% in January. While energy inflation had fallen from 1.9% to 0.2% and services inflation had eased from 3.9% to 3.7%, food inflation had increased to 2.7%, from 2.3%, and non-energy industrial goods inflation had edged up from 0.5% to 0.6%.
Most indicators of underlying inflation suggested that inflation would settle at around the 2% medium-term target on a sustained basis. The Persistent and Common Component of Inflation had ticked down to 2.1% in January. Domestic inflation, which closely tracked services inflation, had declined by 0.2 percentage points to 4.0%. But it remained high, as wages and some services prices were still adjusting to the past inflation surge with a substantial delay. Recent wage negotiations pointed to a continued moderation in labour cost pressures. For instance, negotiated wage growth had decreased to 4.1% in the fourth quarter of 2024. The wage tracker and an array of survey indicators also suggested a continued weakening of wage pressures in 2025.
Inflation was expected to evolve along a slightly higher path in 2025 than had been expected in the Eurosystem staff’s December projections, owing to higher energy prices. At the same time, services inflation was expected to continue declining in early 2025 as the effects from lagged repricing faded, wage pressures receded and the impact of past monetary policy tightening continued to feed through. Most measures of longer-term inflation expectations still stood at around 2%. Near-term market-based inflation compensation had declined across maturities, likely reflecting the most recent decline in energy prices, but longer-term inflation compensation had recently increased in response to emerging fiscal developments. Consumer inflation expectations had resumed their downward momentum in January.
According to the March ECB staff projections, headline inflation was expected to average 2.3% in 2025, 1.9% in 2026 and 2.0% in 2027. Compared with the December 2024 projections, inflation had been revised up by 0.2 percentage points for 2025, reflecting stronger energy price dynamics in the near term. At the same time, the projections were unchanged for 2026 and had been revised down by 0.1 percentage points for 2027. For core inflation, staff projected a slowdown from an average of 2.2% in 2025 to 2.0% in 2026 and to 1.9% in 2027 as labour cost pressures eased further, the impact of past shocks faded and the past monetary policy tightening continued to weigh on prices. The core inflation projection was 0.1 percentage points lower for 2025 compared with the December projections round, as recent data releases had surprised on the downside, but they had been revised up by the same amount for 2026, reflecting the lagged indirect effects of the past depreciation of the euro as well as higher energy inflation in 2025.
Geopolitical uncertainties loomed over the global growth outlook. The Purchasing Managers’ Index (PMI) for global composite output excluding the euro area had declined in January to 52.0, amid a broad-based slowdown in the services sector across key economies. The discussions between the United States and Russia over a possible ceasefire in Ukraine, as well as the de-escalation in the Middle East, had likely contributed to the recent decline in oil and gas prices on global commodity markets. Nevertheless, geopolitical tensions remained a major source of uncertainty. Euro area foreign demand growth was projected to moderate, declining from 3.4% in 2024 to 3.2% in 2025 and then to 3.1% in 2026 and 2027. Downward revisions to the projections for global trade compared with the December 2024 projections reflected mostly the impact of tariffs on US imports from China.
The euro had remained stable in nominal effective terms and had appreciated against the US dollar since the last monetary policy meeting. From the start of the easing cycle last summer, the euro had depreciated overall both against the US dollar and in nominal effective terms, albeit showing a lot of volatility in the high frequency data. Energy commodity prices had decreased following the January meeting, with oil prices down by 4.6% and gas prices down by 12%. However, energy markets had also seen a lot of volatility recently.
Turning to activity in the euro area, GDP had grown modestly in the fourth quarter of 2024. Manufacturing was still a drag on growth, as industrial activity remained weak in the winter months and stood below its third-quarter level. At the same time, survey indicators for manufacturing had been improving and indicators for activity in the services sector were moderating, while remaining in expansionary territory. Although growth in domestic demand had slowed in the fourth quarter, it remained clearly positive. In contrast, exports had likely continued to contract in the fourth quarter. Survey data pointed to modest growth momentum in the first quarter of 2025. The composite output PMI had stood at 50.2 in February, unchanged from January and up from an average of 49.3 in the fourth quarter of 2024. The PMI for manufacturing output had risen to a nine-month high of 48.9, whereas the PMI for services business activity had been 50.6, remaining in expansionary territory but at its lowest level for a year. The more forward-looking composite PMI for new orders had edged down slightly in February owing to its services component. The European Commission’s Economic Sentiment Indicator had improved in January and February but remained well below its long-term average.
The labour market remained robust. Employment had increased by 0.1 percentage points in the fourth quarter and the unemployment rate had stayed at its historical low of 6.2% in January. However, demand for labour had moderated, which was reflected in fewer job postings, fewer job-to-job transitions and declining quit intentions for wage or career reasons. Recent survey data suggested that employment growth had been subdued in the first two months of 2025.
In terms of fiscal policy, a tightening of 0.9 percentage points of GDP had been achieved in 2024, mainly because of the reversal of inflation compensatory measures and subsidies. In the March projections a further slight tightening was foreseen for 2025, but this did not yet factor in the news received earlier in the week about the scaling-up of defence spending.
Looking ahead, growth should be supported by higher incomes and lower borrowing costs. According to the staff projections, exports should also be boosted by rising global demand as long as trade tensions did not escalate further. But uncertainty had increased and was likely to weigh on investment and exports more than previously expected. Consequently, ECB staff had again revised down growth projections, by 0.2 percentage points to 0.9% for 2025 and by 0.2 percentage points to 1.2% for 2026, while keeping the projection for 2027 unchanged at 1.3%. Respondents to the Survey of Monetary Analysts expected growth of 0.8% in 2025, 0.2 percentage points lower than in January, but continued to expect growth of 1.1% in 2026 and 1.2% in 2027, unchanged from January.
Market interest rates in the euro area had decreased after the January meeting but had risen over recent days in response to the latest fiscal developments. The past interest rate cuts, together with anticipated future cuts, were making new borrowing less expensive for firms and households, and loan growth was picking up. At the same time, a headwind to the easing of financing conditions was coming from past interest rate hikes still transmitting to the stock of credit, and lending remained subdued overall. The cost of new loans to firms had declined further by 12 basis points to 4.2% in January, about 1 percentage point below the October 2023 peak. By contrast, the cost of issuing market-based corporate debt had risen to 3.7%, 0.2 percentage points higher than in December. Mortgage rates were 14 basis points lower at 3.3% in January, around 80 basis points below their November 2023 peak. However, the average cost of bank credit measured on the outstanding stock of loans had declined substantially less than that of new loans to firms and only marginally for mortgages.
Annual growth in bank lending to firms had risen to 2.0% in January, up from 1.7% in December. This had mainly reflected base effects, as the negative flow in January 2024 had dropped out of the annual calculation. Corporate debt issuance had increased in January in terms of the monthly flow, but the annual growth rate had remained broadly stable at 3.4%. Mortgage lending had continued its gradual rise, with an annual growth rate of 1.3% in January after 1.1% in December.
Monetary policy considerations and policy options
In summary, the disinflation process remained well on track. Inflation had continued to develop broadly as staff expected, and the latest projections closely aligned with the previous inflation outlook. Most measures of underlying inflation suggested that inflation would settle at around the 2% medium-term target on a sustained basis. Wage growth was moderating as expected. The recent interest rate cuts were making new borrowing less expensive and loan growth was picking up. At the same time, past interest rate hikes were still transmitting to the stock of credit and lending remained subdued overall. The economy faced continued headwinds, reflecting lower exports and ongoing weakness in investment, in part originating from high trade policy uncertainty as well as broader policy uncertainty. Rising real incomes and the gradually fading effects of past rate hikes continued to be the key drivers underpinning the expected pick-up in demand over time.
Based on this assessment, Mr Lane proposed lowering the three key ECB interest rates by 25 basis points. In particular, the proposal to lower the deposit facility rate – the rate through which the Governing Council steered the monetary policy stance – was rooted in the updated assessment of the inflation outlook, the dynamics of underlying inflation and the strength of monetary policy transmission.
Moving the deposit facility rate from 2.75% to 2.50% would be a robust decision. In particular, holding at 2.75% could weaken the required recovery in consumption and investment and thereby risk undershooting the inflation target in the medium term. Furthermore, the new projections indicated that, if the baseline dynamics for inflation and economic growth continued to hold, further easing would be required to stabilise inflation at the medium-term target on a sustainable basis. Under this baseline, from a macroeconomic perspective, a variety of rate paths over the coming meetings could deliver the remaining degree of easing. This reinforced the value of a meeting-by-meeting approach, with no pre-commitment to any particular rate path. In the near term, it would allow the Governing Council to take into account all the incoming data between the current meeting and the meeting on 16-17 April, together with the latest waves of the ECB’s surveys, including the bank lending survey, the Corporate Telephone Survey, the Survey of Professional Forecasters and the Consumer Expectations Survey.
Moreover, the Governing Council should pay special attention to the unfolding geopolitical risks and emerging fiscal developments in view of their implications for activity and inflation. In particular, compared with the rate paths consistent with the baseline projection, the appropriate rate path at future meetings would also reflect the evolution and/or materialisation of the upside and downside risks to inflation and economic momentum.
As the Governing Council had advanced further in the process of lowering rates from their peak, the communication about the state of transmission in the monetary policy statement should evolve. Mr Lane proposed replacing the “level” assessment that “monetary policy remains restrictive” with the more “directional” statement that “our monetary policy is becoming meaningfully less restrictive”. In a similar vein, the Governing Council should replace the reference “financing conditions continue to be tight” with an acknowledgement that “a headwind to the easing of financing conditions comes from past interest rate hikes still transmitting to the stock of credit, and lending remains subdued overall”.
2. Governing Council’s discussion and monetary policy decisions
Economic, monetary and financial analyses
As regards the external environment, members took note of the assessment provided by Mr Lane. Global activity at the end of 2024 had been marginally stronger than expected (possibly supported by firms frontloading imports of foreign inputs ahead of potential trade disruptions) and according to the March 2025 ECB staff projections global growth was expected to remain fairly solid overall, while moderating slightly over 2025-27. This moderation came mainly from expected lower growth rates for the United States and China, which were partially compensated for by upward revisions to the outlook for other economies. Euro area foreign demand was seen to evolve broadly in line with global activity over the rest of the projection horizon. Compared with the December 2024 Eurosystem staff projections, foreign demand was projected to be slightly weaker over 2025-27. This weakness was seen to stem mainly from lower US imports. Recent data in the United States had come in on the soft side. It was highlighted that the March 2025 projections only incorporated tariffs implemented at the time of the cut-off date (namely US tariffs of 10% on imports from China and corresponding retaliatory tariffs on US exports to China). By contrast, US tariffs that had been suspended or not yet formally announced at the time of the cut-off date were treated as risks to the baseline projections.
Elevated and exceptional uncertainty was highlighted as a key theme for both the external environment and the euro area economy. Current uncertainties were seen as multidimensional (political, geopolitical, tariff-related and fiscal) and as comprising “radical” or “Knightian” elements, in other words a type of uncertainty that could not be quantified or captured well by standard tools and quantitative analysis. In particular, the unpredictable patterns of trade protectionism in the United States were currently having an impact on the outlook for the global economy and might also represent a more lasting regime change. It was also highlighted that, aside from specific, already enacted tariff measures, uncertainty surrounding possible additional measures was creating significant extra headwinds in the global economy.
The impact of US tariffs on trading partners was seen to be clearly negative for activity while being more ambiguous for inflation. For the latter, an upside effect in the short term, partly driven by the exchange rate, might be broadly counterbalanced by downside pressures on prices from lower demand, especially over the medium term. It was underlined that it was challenging to determine, ex ante, the impact of protectionist measures, as this would depend crucially on how the measures were deployed and was likely to be state and scale-dependent, in particular varying with the duration of the protectionist measures and the extent of any retaliatory measures. More generally, a tariff could be seen as a tax on production and consumption, which also involved a wealth transfer from the private to the public sector. In this context, it was underlined that tariffs were generating welfare losses for all parties concerned.
With regard to economic activity in the euro area, members broadly agreed with the assessment presented by Mr Lane. The overall narrative remained that the economy continued to grow, but in a modest way. Based on Eurostat’s flash release for the euro area (of 14 February) and available country data, year-on-year growth in the fourth quarter of 2024 appeared broadly in line with what had been expected. However, the composition was somewhat different, with more private and government consumption, less investment and deeply negative net exports. It was mentioned that recent surveys had been encouraging, pointing to a turnaround in the interest rate-sensitive manufacturing sector, with the euro area manufacturing PMI reaching its highest level in 24 months. While developments in services continued to be better than those in manufacturing, survey evidence suggested that momentum in the services sector could be slowing, although manufacturing might become less negative – a pattern of rotation also seen in surveys of the global economy. Elevated uncertainty was undoubtedly a factor holding back firms’ investment spending. Exports were also weak, particularly for capital goods.The labour market remained resilient, however. The unemployment rate in January (6.2%) was at a historical low for the euro area economy, once again better than expected, although the positive momentum in terms of the rate of employment growth appeared to be moderating.
While the euro area economy was still expected to grow in the first quarter of the year, it was noted that incoming data were mixed. Current and forward-looking indicators were becoming less negative for the manufacturing sector but less positive for the services sector. Consumer confidence had ticked up in the first two months of 2025, albeit from low levels, while households’ unemployment expectations had also improved slightly. Regarding investment, there had been some improvement in housing investment indicators, with the housing output PMI having improved measurably, thus indicating a bottoming-out in the housing market, and although business investment indicators remained negative, they were somewhat less so. Looking ahead, economic growth should continue and strengthen over time, although once again more slowly than previously expected. Real wage developments and more affordable credit should support household spending. The outlook for investment and exports remained the most uncertain because it was clouded by trade policy and geopolitical uncertainties.
Broad agreement was expressed with the latest ECB staff macroeconomic projections. Economic growth was expected to continue, albeit at a modest pace and somewhat slower than previously expected. It was noted, however, that the downward revision to economic growth in 2025 was driven in part by carry-over effects from a weak fourth quarter in 2024 (according to Eurostat’s flash release). Some concern was raised that the latest downward revisions to the current projections had come after a sequence of downward revisions. Moreover, other institutions’ forecasts appeared to be notably more pessimistic. While these successive downward revisions to the staff projections had been modest on an individual basis, cumulatively they were considered substantial. At the same time, it was highlighted that negative judgement had been applied to the March projections, notably on investment and net exports among the demand components. By contrast, there had been no significant change in the expected outlook for private consumption, which, supported by real wage growth, accumulated savings and lower interest rates, was expected to remain the main element underpinning growth in economic activity.
While there were some downward revisions to expectations for government consumption, investment and exports, the outlook for each of these components was considered to be subject to heightened uncertainty. Regarding government consumption, recent discussions in the fiscal domain could mean that the slowdown in growth rates of government spending in 2025 assumed in the projections might not materialise after all. These new developments could pose risks to the projections, as they would have an impact on economic growth, inflation and possibly also potential growth, countering the structural weakness observed so far. At the same time, it was noted that a significant rise in the ten-year yields was already being observed, whereas the extra stimulus from military spending would likely materialise only further down the line. Overall, members considered that the broad narrative of a modestly growing euro area economy remained valid. Developments in US trade policies and elevated uncertainty were weighing on businesses and consumers in the euro area, and hence on the outlook for activity.
Private consumption had underpinned euro area growth at the end of 2024. The ongoing increase in real wages, as well as low unemployment, the stabilisation in consumer confidence and saving rates that were still above pre-pandemic levels, provided confidence that a consumption-led recovery was still on track. But some concern was expressed over the extent to which private consumption could further contribute to a pick-up in growth. In this respect, it was argued that moderating real wage growth, which was expected to be lower in 2025 than in 2024, and weak consumer confidence were not promising for a further increase in private consumption. Concerning the behaviour of household savings, it was noted that saving rates were clearly higher than during the pre-pandemic period, although they were projected to decline gradually over the forecast horizon. However, the current heightened uncertainty and the increase in fiscal deficits could imply that higher household savings might persist, partly reflecting “Ricardian” effects (i.e. consumers prone to increase savings in anticipation of higher future taxes needed to service the extra debt). At the same time, it was noted that the modest decline in the saving rate was only one factor supporting the outlook for private consumption.
Regarding investment, a distinction was made between housing and business investment. For housing, a slow recovery was forecast during the course of 2025 and beyond. This was based on the premise of lower interest rates and less negative confidence indicators, although some lag in housing investment might be expected owing to planning and permits. The business investment outlook was considered more uncertain. While industrial confidence was low, there had been some improvement in the past couple of months. However, it was noted that confidence among firms producing investment goods was falling and capacity utilisation in the sector was low and declining. It was argued that it was not the level of interest rates that was currently holding back business investment, but a high level of uncertainty about economic policies. In this context, concern was expressed that ongoing uncertainty could result in businesses further delaying investment, which, if cumulated over time, would weigh on the medium-term growth potential.
The outlook for exports and the direct and indirect impact of tariff measures were a major concern. It was noted that, as a large exporter, particularly of capital goods, the euro area might feel the biggest impact of such measures. Reference was made to scenario calculations that suggested that there would be a significant negative impact on economic growth, particularly in 2025, if the tariffs on Mexico, Canada and the euro area currently being threatened were actually implemented. Regarding the specific impact on euro area exports, it was noted that, to understand the potential impact on both activity and prices, a granular level of analysis would be required, as sectors differed in terms of competition and pricing power. Which specific goods were targeted would also matter. Furthermore, while imports from the United States (as a percentage of euro area GDP) had increased over the past decade, those from the rest of the world (China, the rest of Asia and other EU countries) were larger and had increased by more.
Members overall assessed that the labour market continued to be resilient and was developing broadly in line with previous expectations. The euro area unemployment rate remained at historically low levels and well below estimates of the non-accelerating inflation rate of unemployment. The strength of the labour market was seen as attenuating the social cost of the relatively weak economy as well as supporting upside pressures on wages and prices. While there had been some slowdown in employment growth, this also had to be seen in the context of slowing labour force growth. Furthermore, the latest survey indicators suggested a broad stabilisation rather than any acceleration in the slowdown. Overall, the euro area labour market remained tight, with a negative unemployment gap.
Against this background, members reiterated that fiscal and structural policies should make the economy more productive, competitive and resilient. It was noted that recent discussions at the national and EU levels raised the prospect of a major change in the fiscal stance, notably in the euro area’s largest economy but also across the European Union. In the baseline projections, which had been finalised before the recent discussions, a fiscal tightening over 2025-27 had been expected owing to a reversal of previous subsidies and termination of the Next Generation EU programme in 2027. Current proposals under discussion at the national and EU levels would represent a substantial change, particularly if additional measures beyond extra defence spending were required to achieve the necessary political buy-in. It was noted, however, that not all countries had sufficient fiscal space. Hence it was underlined that governments should ensure sustainable public finances in line with the EU’s economic governance framework and should prioritise essential growth-enhancing structural reforms and strategic investment. It was also reiterated that the European Commission’s Competitiveness Compass provided a concrete roadmap for action and its proposals should be swiftly adopted.
In light of exceptional uncertainty around trade policies and the fiscal outlook, it was noted that one potential impact of elevated uncertainty was that the baseline scenario was becoming less likely to materialise and risk factors might suddenly enter the baseline. Moreover, elevated uncertainty could become a persistent fact of life. It was also considered that the current uncertainty was of a different nature to that normally considered in the projection exercises and regular policymaking. In particular, uncertainty was not so much about how certain variables behaved within the model (or specific model parameters) but whether fundamental building blocks of the models themselves might have to be reconsidered (also given that new phenomena might fall entirely outside the realm of historical data or precedent). This was seen as a call for new approaches to capture uncertainty.
Against this background, members assessed that even though some previous downside risks had already materialised, the risks to economic growth had increased and remained tilted to the downside. An escalation in trade tensions would lower euro area growth by dampening exports and weakening the global economy. Ongoing uncertainty about global trade policies could drag investment down. Geopolitical tensions, such as Russia’s unjustified war against Ukraine and the tragic conflict in the Middle East, remained a major source of uncertainty. Growth could be lower if the lagged effects of monetary policy tightening lasted longer than expected. At the same time, growth could be higher if easier financing conditions and falling inflation allowed domestic consumption and investment to rebound faster. An increase in defence and infrastructure spending could also add to growth. For the near-term outlook, the ECB’s mechanical updates of growth expectations in the first half of 2025 suggested some downside risk. Beyond the near term, it was noted that the baseline projections only included tariffs (and retaliatory measures) already implemented but not those announced or threatened but not yet implemented. The materialisation of additional tariff measures would weigh on euro area exports and investment as well as add to the competitiveness challenges facing euro area businesses. At the same time, the potential fiscal impulse had not been included either.
With regard to price developments, members largely agreed that the disinflation process was on track, with inflation continuing to develop broadly as staff had expected. Domestic inflation, which closely tracked services inflation, had declined in January but remained high, as wages and some services prices were still adjusting to the past inflation surge with a delay. However, recent wage negotiations pointed to an ongoing moderation in labour cost pressures, with a lower contribution from profits partially buffering their impact on inflation and most indicators of underlying inflation pointing to a sustained return of inflation to target. Preliminary indicators for labour cost growth in the fourth quarter of 2024 suggested a further moderation, which gave some greater confidence that moderating wage growth would support the projected disinflation process.
It was stressed that the annual growth of compensation per employee, which, based on available euro area data, had stood at 4.4% in the third quarter of 2024, should be seen as the most important and most comprehensive measure of wage developments. According to the projections, it was expected to decline substantially by the end of 2025, while available hard data on wage growth were still generally coming in above 4%, and indications from the ECB wage tracker were based only on a limited number of wage agreements for the latter part of 2025. The outlook for wages was seen as a key element for the disinflation path foreseen in the projections, and the sustainable return of inflation to target was still subject to considerable uncertainty. In this context, some concern was expressed that relatively tight labour markets might slow the rate of moderation and that weak labour productivity growth might push up the rate of increase in unit labour costs.
With respect to the incoming data, members reiterated that hard data for the first quarter would be crucial for ascertaining further progress with disinflation, as foreseen in the staff projections. The differing developments among the main components of the Harmonised Index of Consumer Prices (HICP) were noted. Energy prices had increased but were volatile, and some of the increases had already been reversed most recently. Notwithstanding the increases in the annual rate of change in food prices, momentum in this salient component was down. Developments in the non-energy industrial goods component remained modest. Developments in services were the main focus of discussions. While some concerns were expressed that momentum in services appeared to have remained relatively elevated or had even edged up (when looking at three-month annualised growth rates), it was also argued that the overall tendency was clearly down. It was stressed that detailed hard data on services inflation over the coming months would be key and would reveal to what extent the projected substantial disinflation in services in the first half of 2025 was on track.
Regarding the March inflation projections, members commended the improved forecasting performance in recent projection rounds. It was underlined that the 0.2 percentage point upward revision to headline inflation for 2025 primarily reflected stronger energy price dynamics compared with the December projections. Some concern was expressed that inflation was now only projected to reach 2% on a sustained basis in early 2026, rather than in the course of 2025 as expected previously. It was also noted that, although the baseline scenario had been broadly materialising, uncertainties had been increasing substantially in several respects. Furthermore, recent data releases had seen upside surprises in headline inflation. However, it was remarked that the latest upside revision to the headline inflation projections had been driven mainly by the volatile prices of crude oil and natural gas, with the decline in those prices since the cut-off date for the projections being large enough to undo much of the upward revision. In addition, it was underlined that the projections for HICP inflation excluding food and energy were largely unchanged, with staff projecting an average of 2.2% for 2025 and 2.0% for 2026. The argument was made that the recent revisions showed once again that it was misleading to mechanically relate lower growth to lower inflation, given the prevalence of supply-side shocks.
With respect to inflation expectations, reference was made to the latest market-based inflation fixings, which were typically highly sensitive to the most recent energy commodity price developments. Beyond the short term, inflation fixings were lower than the staff projections. Attention was drawn to a sharp increase in the five-year forward inflation expectations five years ahead following the latest expansionary fiscal policy announcements. However, it was argued that this measure remained consistent with genuine expectations broadly anchored around 2% if estimated risk premia were taken into account, and there had been a less substantial adjustment in nearer-term inflation compensation. Looking at other sources of evidence on expectations, collected before the fiscal announcements (as was the case for all survey evidence), panellists in the Survey of Monetary Analysts saw inflation close to 2%. Consumer inflation expectations from the ECB Consumer Expectations Survey were generally at higher levels, but they showed a small downtick for one-year ahead expectations. It was also highlighted that firms mentioned inflation in their earnings calls much less frequently, suggesting inflation was becoming less salient.
Against this background, members saw a number of uncertainties surrounding the inflation outlook. Increasing friction in global trade was adding more uncertainty to the outlook for euro area inflation. A general escalation in trade tensions could see the euro depreciate and import costs rise, which would put upward pressure on inflation. At the same time, lower demand for euro area exports as a result of higher tariffs and a re-routing of exports into the euro area from countries with overcapacity would put downward pressure on inflation. Geopolitical tensions created two-sided inflation risks as regards energy markets, consumer confidence and business investment. Extreme weather events, and the unfolding climate crisis more broadly, could drive up food prices by more than expected. Inflation could turn out higher if wages or profits increased by more than expected. A boost in defence and infrastructure spending could also raise inflation through its effect on aggregate demand. But inflation might surprise on the downside if monetary policy dampened demand by more than expected. The view was expressed that the prospect of significantly higher fiscal spending, together with a potentially significant increase in inflation in the event of a tariff scenario with retaliation, deserved particular consideration in future risk assessments. Moreover, the risks might be exacerbated by potential second-round effects and upside wage pressures in an environment where inflation had not yet returned to target and the labour market remained tight. In particular, it was argued that the boost to domestic demand from fiscal spending would make it easier for firms to pass through higher costs to consumers rather than absorb them in their profits, at a time when inflation expectations were more fragile and firms had learned to rapidly adapt the frequency of repricing in an environment of high uncertainty. It was argued that growth concerns were mainly structural in nature and that monetary policy was ineffective in resolving structural weaknesses.
Turning to the monetary and financial analysis, market interest rates in the euro area had decreased after the Governing Council’s January meeting, before surging in the days immediately preceding the March meeting. Long-term bond yields had risen significantly: for example, the yield on ten-year German government bonds had increased by about 30 basis points in a day – the highest one-day jump since the surge linked to German reunification in March 1990. These moves probably reflected a mix of expectations of higher average policy rates in the future and a rise in the term premium, and represented a tightening of financing conditions. The revised outlook for fiscal policy – associated in particular with the need to increase defence spending – and the resulting increase in aggregate demand were the main drivers of these developments and had also led to an appreciation of the euro.
Looking back over a longer period, it was noted that broader financial conditions had already been easing substantially since late 2023 because of factors including monetary policy easing, the stock market rally and the recent depreciation of the euro until the past few days. In this respect, it was mentioned that, abstracting from the very latest developments, after the strong increase in long-term rates in 2022, yields had been more or less flat, albeit with some volatility. However, it was contended that the favourable impact on debt financing conditions of the decline in short-term rates had been partly offset by the recent significant increase in long-term rates. Moreover, debt financing conditions remained relatively tight compared with longer-term historical averages over the past ten to 15 years, which covered the low-interest period following the financial crisis. Wider financial markets appeared to have become more optimistic about Europe and less optimistic about the United States since the January meeting, although some doubt was raised as to whether that divergence was set to last.
The ECB’s interest rate cuts were gradually contributing to an easing of financing conditions by making new borrowing less expensive for firms and households. The average interest rate on new loans to firms had declined to 4.2% in January, from 4.4% in December. Over the same period the average interest rate on new mortgages had fallen to 3.3%, from 3.4%. At the same time, lending rates were proving slower to turn around in real terms, so there continued to be a headwind to the easing of financing conditions from past interest rate hikes still transmitting to the stock of credit. This meant that lending rates on the outstanding stock of loans had only declined marginally, especially for mortgages. The recent substantial increase in long-term yields could also have implications for lending conditions by affecting bank funding conditions and influencing the cost of loans linked to long-term yields. However, it was noted that it was no surprise that financing conditions for households and firms still appeared tight when compared with the period of negative interest rates, because longer-term fixed rate loans taken out during the low-interest rate period were being refinanced at higher interest rates. Financing conditions were in any case unlikely to return to where they had been prior to the COVID-19 pandemic and the inflation surge. Furthermore, the most recent bank lending survey pointed to neutral or even stimulative effects of the general level of interest rates on bank lending to firms and households. Overall, it was observed that financing conditions were at present broadly as expected in a cycle in which interest rates would have been cut by 150 basis points according to the proposal, having previously been increased by 450 basis points.
As for lending volumes, loan growth was picking up, but lending remained subdued overall. Growth in bank lending to firms had risen to 2.0% in January, up from 1.7% in December, on the back of a moderate monthly flow of new loans. Growth in debt securities issued by firms had risen to 3.4% in annual terms. Mortgage lending had continued to rise gradually but remained muted overall, with an annual growth rate of 1.3%, up from 1.1% in December.
Underlying momentum in bank lending remained strong, with the three-month and six-month annualised growth rates standing above the annual growth rate. At the same time, it was contended that the recent uptick in bank lending to firms mainly reflected a substitution from market-based financing in response to the higher cost of debt security financing, so that the overall increase in corporate borrowing had been limited. Furthermore, lending was increasing from quite low levels, and the stock of bank loans to firms relative to GDP remained lower than 25 years ago. Nonetheless, the growth of credit to firms was now roughly back to pre-pandemic levels and more than three times the average during the 2010s, while mortgage credit growth was only slightly below the average in that period. On the household side, it was noted that the demand for housing loans was very strong according to the bank lending survey, with the average increase in demand in the last two quarters of 2024 being the highest reported since the start of the survey. This seemed to be a natural consequence of lower interest rates and suggested that mortgage lending would keep rising. However, consumer credit had not really improved over the past year.
Strong bank balance sheets had been contributing to the recovery in credit, although it was observed that non-performing and “stage 2” loans – those loans associated with a significant increase in credit risk – were increasing. The credit dynamics that had been picking up also suggested that the decline in excess liquidity held by banks as reserves with the Eurosystem was not adversely affecting banks’ lending behaviour. This was to be expected since banks’ liquidity coverage ratios were high, and it was underlined that banks could in any case post a wide range of collateral to obtain liquidity from the ECB at any time.
Monetary policy stance and policy considerations
Turning to the monetary policy stance, members assessed the data that had become available since the last monetary policy meeting in accordance with the three main elements that the Governing Council had communicated in 2023 as shaping its reaction function. These comprised (i) the implications of the incoming economic and financial data for the inflation outlook, (ii) the dynamics of underlying inflation, and (iii) the strength of monetary policy transmission.
Starting with the inflation outlook, members noted that inflation had continued to develop broadly as expected, with incoming data largely in line with the previous projections. Indeed, the central scenario had broadly materialised for several successive quarters, with relatively limited changes in the inflation projections. This was again the case in the March projections, which were closely aligned with the previous inflation outlook. Inflation expectations had remained well anchored despite the very high uncertainty, with most measures of longer-term inflation expectations continuing to stand at around 2%. This suggested that inflation remained on course to stabilise at the 2% inflation target in the medium term. Still, this continued to depend on the materialisation of the projected material decline in wage growth over the course of 2025 and on a swift and significant deceleration in services inflation in the coming months. And, while services inflation had declined in February, its momentum had yet to show conclusive signs of a stable downward trend.
It was widely felt that the most important recent development was the significant increase in uncertainty surrounding the outlook for inflation, which could unfold in either direction. There were many unknowns, notably related to tariff developments and global geopolitical developments, and to the outlook for fiscal policies linked to increased defence and other spending. The latter had been reflected in the sharp moves in long-term yields and the euro exchange rate in the days preceding the meeting, while energy prices had rebounded. This meant that, while the baseline staff projection was still a reasonable anchor, a lower probability should be attached to that central scenario than in normal times. In this context, it was argued that such uncertainty was much more fundamental and important than the small revisions that had been embedded in the staff inflation projections. The slightly higher near-term profile for headline inflation in the staff projections was primarily due to volatile components such as energy prices and the exchange rate. Since the cut-off date for the projections, energy prices had partially reversed their earlier increases. With the economy now in the flat part of the disinflation process, small adjustments in the inflation path could lead to significant shifts in the precise timing of when the target would be reached. Overall, disinflation was seen to remain well on track. Inflation had continued to develop broadly as staff had expected and the latest projections closedly aligned with the previous inflation outlook. At the same time, it was widely acknowledged that risks and uncertainty had clearly increased.
Turning to underlying inflation, members concurred that most measures of underlying inflation suggested that inflation would settle at around the 2% medium-term target on a sustained basis. Core inflation was coming down and was projected to decline further as a result of a further easing in labour cost pressures and the continued downward pressure on prices from the past monetary policy tightening. Domestic inflation, which closely tracked services inflation, had declined in January but remained high, as wages and prices of certain services were still adjusting to the past inflation surge with a substantial delay. However, while the continuing strength of the labour market and the potentially large fiscal expansion could both add to future wage pressures, there were many signs that wage growth was moderating as expected, with lower profits partially buffering the impact on inflation.
Regarding the transmission of monetary policy, recent credit dynamics showed that monetary policy transmission was working, with both the past tightening and recent interest rate cuts feeding through smoothly to market interest rates, financing conditions, including bank lending rates, and credit flows. Gradual and cautious rate cuts had contributed substantially to the progress made towards a sustainable return of inflation to target and ensured that inflation expectations remained anchored at 2%, while securing a soft landing of the economy. The ECB’s monetary policy had supported increased lending. Looking ahead, lags in policy transmission suggested that, overall, credit growth would probably continue to increase.
The impact of financial conditions on the economy was discussed. In particular, it was argued that the level of interest rates and possible financing constraints – stemming from the availability of both internal and external funds – might be weighing on corporate investment. At the same time, it was argued that structural factors contributed to the weakness of investment, including high energy and labour costs, the regulatory environment and increased import competition, and high uncertainty, including on economic policy and the outlook for demand. These were seen as more important factors than the level of interest rates in explaining the weakness in investment. Consumption also remained weak and the household saving rate remained high, though this could also be linked to elevated uncertainty rather than to interest rates.
On this basis, the view was expressed that it was no longer clear whether monetary policy continued to be restrictive. With the last rate hike having been 18 months previously, and the first cut nine months previously, it was suggested that the balance was increasingly shifting towards the transmission of rate cuts. In addition, although quantitative tightening was operating gradually and smoothly in the background, the stock of asset holdings was still compressing term premia and long-term rates, while the diminishing compression over time implied a tightening.
Monetary policy decisions and communication
Against this background, almost all members supported the proposal by Mr Lane to lower the three key ECB interest rates by 25 basis points. Lowering the deposit facility rate – the rate through which the Governing Council steered the monetary policy stance – was justified by the updated assessment of the inflation outlook, the dynamics of underlying inflation and the strength of monetary policy transmission.
Looking ahead, the point was made that the likely shocks on the horizon, including from escalating trade tensions, and uncertainty more generally, risked significantly weighing on growth. It was argued that these factors could increase the risk of undershooting the inflation target in the medium term. In addition, it was argued that the recent appreciation of the euro and the decline in energy prices since the cut-off date for the staff projections, together with the cooling labour market and well-anchored inflation expectations, mitigated concerns about the upward revision to the near-term inflation profile and upside risks to inflation more generally. From this perspective, it was argued that being prudent in the face of uncertainty did not necessarily equate to being gradual in adjusting the interest rate.
By contrast, it was contended that high levels of uncertainty, including in relation to trade policies, fiscal policy developments and sticky services and domestic inflation, called for caution in policy-setting and especially in communication. Inflation was no longer foreseen to return to the 2% target in 2025 in the latest staff projections and the date had now been pushed out to the first quarter of 2026. Moreover, the latest revision to the projected path meant that inflation would by that time have remained above target for almost five years. This concern would be amplified should upside risks to inflation materialise and give rise to possible second-round effects. For example, a significant expansion of fiscal policy linked to defence and other spending would increase price pressures. This had the potential to derail the disinflation process and keep inflation higher for longer. Indeed, investors had immediately reacted to the announcements in the days preceding the meeting. This was reflected in an upward adjustment of the market interest rate curve, dialling back the number of expected rate cuts, and a sharp increase in five-year forward inflation expectations five years ahead. The combination of US tariffs and retaliation measures could also pose upside risks to inflation, especially in the near term. Moreover, firms had also learned to raise their prices more quickly in response to new inflationary shocks.
Against this background, a few members stressed that they could only support the proposal to reduce interest rates by a further 25 basis points if there was also a change in communication that avoided any indication of future cuts or of the future direction of travel, which was seen as akin to providing forward guidance. One member abstained, as the proposed communication did not drop any reference to the current monetary policy stance being restrictive.
In this context, members discussed in more detail the extent to which monetary policy could still be described as restrictive following the proposed interest rate cut. While it was clear that, with each successive rate cut, monetary policy was becoming less restrictive and closer to most estimates of the natural or neutral rate of interest, different views were expressed in this regard.
On the one hand, it was argued that it was no longer possible to be confident that monetary policy was restrictive. It was noted that, following the proposed further cut of 25 basis points, the level of the deposit facility rate would be roughly equal to the current level of inflation. Even after the increase in recent days, long-term yields remained very modest in real terms. Credit and equity risk premia continued to be fairly contained and the euro was not overvalued despite the recent appreciation. There were also many indications in lending markets that the degree of policy restriction had declined appreciably. Credit was responding to monetary policy broadly as expected, with the tightening effect of past rate hikes now gradually giving way to the easing effects of the subsequent rate cuts, which had been transmitting smoothly to market and bank lending rates. This shifting balance was likely to imply a continued move towards easier credit conditions and a further recovery in credit flows. In addition, subdued growth could not be taken as evidence that policy was restrictive, given that the current weakness was seen by firms as largely structural.
In this vein, it was also noted that a deposit facility rate of 2.50% was within, or at least at around the upper bound of, the range of Eurosystem staff estimates for the natural or neutral interest rate, with reference to the recently published Economic Bulletin box, entitled “Natural rate estimates for the euro area: insights, uncertainties and shortcomings”. Using the full array of models and ignoring estimation uncertainty, this currently ranged from 1.75% to 2.75%. Notwithstanding important caveats and the uncertainties surrounding the estimates, it was contended that they still provided a guidepost for the degree of monetary policy restrictiveness. Moreover, while recognising the high model uncertainty, it was argued that both model-based and market-based measures suggested that one main driver of the notable increase in the neutral interest rate over the past three years had been the increased net supply of government bonds. In this context, it was suggested that the impending expansionary fiscal policy linked to defence and other spending – and the likely associated increase in the excess supply of bonds – would affect real interest rates and probably lead to a persistent and significant increase in the neutral interest rate. This implied that, for a given policy rate, monetary policy would be less restrictive.
On the other hand, it was argued that monetary policy would still be in restrictive territory even after the proposed interest rate cut. Inflation was on a clear trajectory to return to the 2% medium-term target while the euro area growth outlook was very weak. Consumption and investment remained weak despite high employment and past wage increases, consumer confidence continued to be low and the household saving ratio remained at high levels. This suggested an economy in stagnation – a sign that monetary policy was still in restrictive territory. Expansionary fiscal policy also had the potential to increase asset swap spreads between sovereign bond and OIS markets. With a greater sovereign bond supply, that intermediation spread would probably widen, which would contribute to tighter financing conditions. In addition, it was underlined that the latest staff projections were conditional on a market curve that implied about three further rate cuts, indicating that a 2.50% deposit facility rate was above the level necessary to sustainably achieve the 2% target in the medium term. It was stressed, in this context, that the staff projections did not hinge on assumptions about the neutral interest rate.
More generally, it was argued that, while the natural or neutral rate could be a useful concept when policy rates were very far away from it and there was a need to communicate the direction of travel, it was of little value for steering policy on a meeting-by-meeting basis. This was partly because its level was fundamentally unobservable, and so it was subject to significant model and parameter uncertainty, a wide range between minimum and maximum estimates, and changing estimates over time. The range of estimates around the midpoint and the uncertainty bands around each estimate underscored why it was important to avoid excessive focus on any particular value. Rather, it was better to simply consider what policy setting was appropriate at any given point in time to meet the medium-term inflation target in light of all factors and shocks affecting the economy, including structural elements. To the extent that consideration should be given to the natural or neutral interest rate, it was noted that the narrower range of the most reliable staff estimates, between 1.75% and 2.25%, indicated that monetary policy was still restrictive at a deposit facility rate of 2.50%. Overall, while there had been a measurable increase in the natural interest rate since the pandemic, it was argued that it was unlikely to have reached levels around 2.5%.
Against this background, the proposal by Mr Lane to change the wording of the monetary policy statement by replacing “monetary policy remains restrictive” with “monetary policy is becoming meaningfully less restrictive” was widely seen as a reasonable compromise. On the one hand, it was acknowledged that, after a sustained sequence of rate reductions, the policy rate was undoubtedly less restrictive than at earlier stages in the current easing phase, but it had entered a range in which it was harder to determine the precise level of restrictiveness. In this regard, “meaningfully” was seen as an important qualifier, as monetary policy had already become less restrictive with the first rate cut in June 2024. On the other hand, while interest rates had already been cut substantially, the formulation did not rule out further cuts, even if the scale and timing of such cuts were difficult to determine ex ante.
On the whole, it was considered important that the amended language should not be interpreted as sending a signal in either direction for the April meeting, with both a cut and a pause on the table, depending on incoming data. The proposed change in the communication was also seen as a natural progression from the previous change, implemented in December. This had removed the intention to remain “sufficiently restrictive for as long as necessary” and shifted to determining the appropriate monetary policy stance, on a meeting-by-meeting basis, depending on incoming data. From this perspective there was no need to identify the neutral interest rate, particularly given that future policy might need to be above, at or below neutral, depending on the inflation and growth outlook.
Looking ahead, members reiterated that the Governing Council remained determined to ensure that inflation would stabilise sustainably at its 2% medium-term target. Its interest rate decisions would continue to be based on its assessment of the inflation outlook in light of the incoming economic and financial data, the dynamics of underlying inflation and the strength of monetary policy transmission. Uncertainty was particularly high and rising owing to increasing friction in global trade, geopolitical developments and the design of fiscal policies to support increased defence and other spending. This underscored the importance of following a data-dependent and meeting-by-meeting approach to determining the appropriate monetary policy stance.
Taking into account the foregoing discussion among the members, upon a proposal by the President, the Governing Council took the monetary policy decisions as set out in the monetary policy press release. The members of the Governing Council subsequently finalised the monetary policy statement, which the President and the Vice-President would, as usual, deliver at the press conference following the Governing Council meeting.
Monetary policy statement
Monetary policy statement for the press conference of 6 March 2025
Press release
Meeting of the ECB’s Governing Council, 5-6 March 2025
Members
- Ms Lagarde, President
- Mr de Guindos, Vice-President
- Mr Cipollone
- Mr Demarco, temporarily replacing Mr Scicluna*
- Mr Dolenc, Deputy Governor of Banka Slovenije
- Mr Elderson
- Mr Escrivá
- Mr Holzmann
- Mr Kazāks*
- Mr Kažimír
- Mr Knot
- Mr Lane
- Mr Makhlouf
- Mr Müller
- Mr Nagel
- Mr Panetta*
- Mr Patsalides
- Mr Rehn
- Mr Reinesch*
- Ms Schnabel
- Mr Šimkus*
- Mr Stournaras
- Mr Villeroy de Galhau
- Mr Vujčić
- Mr Wunsch
* Members not holding a voting right in March 2025 under Article 10.2 of the ESCB Statute.
Other attendees
- Mr Dombrovskis, Commissioner**
- Ms Senkovic, Secretary, Director General Secretariat
- Mr Rostagno, Secretary for monetary policy, Director General Monetary Policy
- Mr Winkler, Deputy Secretary for monetary policy, Senior Adviser, DG Monetary Policy
** In accordance with Article 284 of the Treaty on the Functioning of the European Union.
Accompanying persons
- Mr Arpa
- Ms Bénassy-Quéré
- Mr Debrun
- Mr Gavilán
- Mr Horváth
- Mr Kyriacou
- Mr Lünnemann
- Mr Madouros
- Ms Mauderer
- Mr Nicoletti Altimari
- Mr Novo
- Ms Reedik
- Mr Rutkaste
- Ms Schembri
- Mr Šiaudinis
- Mr Sleijpen
- Mr Šošić
- Mr Tavlas
- Mr Välimäki
- Ms Žumer Šujica
Other ECB staff
- Mr Proissl, Director General Communications
- Mr Straub, Counsellor to the President
- Ms Rahmouni-Rousseau, Director General Market Operations
- Mr Arce, Director General Economics
- Mr Sousa, Deputy Director General Economics
Release of the next monetary policy account foreseen on 22 May 2025.
Dollar Index (DXY) Elliott Wave : Forecasting the Decline
Hello fellow traders. In this technical article we’re going to look at the Elliott Wave charts of Dollar Index DXY published in members area of the website. As our members know , Dollar shows bearish sequences in the cycle from the 110.157 peak. In the following text, we will explain the Elliott Wave forecast in more detail.
Dollar Index DXY Elliott Wave 1 Hour Chart 04.02.2025
As mentioned earlier, Dollar is showing bearish sequences – 5 waves pattern from the 110.15 high, and we expect further weakness in the US Dollar. Current Elliott Wave analysis suggests that DXY completed a three-wave recovery at the 104.68 high, marked as wave 4 red. As long as the price remains below this level, we anticipate continued downside in Dollar index..
At this stage, we do not recommend buying and favoring the short side.
Dollar Index DXY Elliott Wave 1 Hour Chart 04.03.2025
The price remained below the marked invalidation level, leading to a further decline as anticipated. Eventually, it broke the previous low at 103.22, confirming that the next leg down is underway. The Dollar Index remains bearish as long as it holds the 104.67 pivot. We anticipate continued weakness, with a downside target of 101.51 (wave 5 = wave 1).
EUR/USD Surges as PMI Boosts EUR, US Dollar Under Pressure from Tariffs
- US Tariffs Drive EUR/USD Surge.
- Recent PMI data indicates continued growth in the Eurozone's private sector, adding to the Euro's strength.
- Market attention is currently focused on tariff developments and upcoming US economic data releases, including Services PMI and Nonfarm Payrolls.
- Will EUR/USD have what it takes to break the 1.1200 handle?
EUR/USD is on a tear this morning after yesterday's tariff announcements and a positive PMI release. The pair is now trading at multi-month highs above the 1.1000 psychological level.
US President Donald Trump announced on "Liberation Day" that a 10% tariff on all imports to the US will start on April 5. Additionally, higher tariffs targeting around 60 countries, labeled as "worst offenders," will begin on April 9. The European Union is among these countries and will face 20% tariffs.
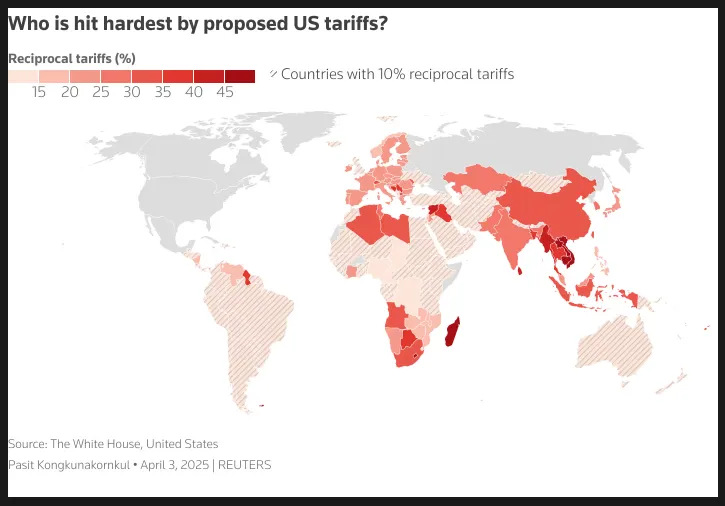
Source: LSEG, The White House
In response, European Commission President Ursula von der Leyen stated on Thursday that these US tariffs will significantly harm the global economy. She also mentioned that the EU is working on new measures to defend its interests.
The impact of this has seen the US Dollar face significant selling pressure, with the DXY now hovering close to the 102.00 level (September 2024 levels).
US Dollar Index (DXY) Daily Chart, April 3, 2025
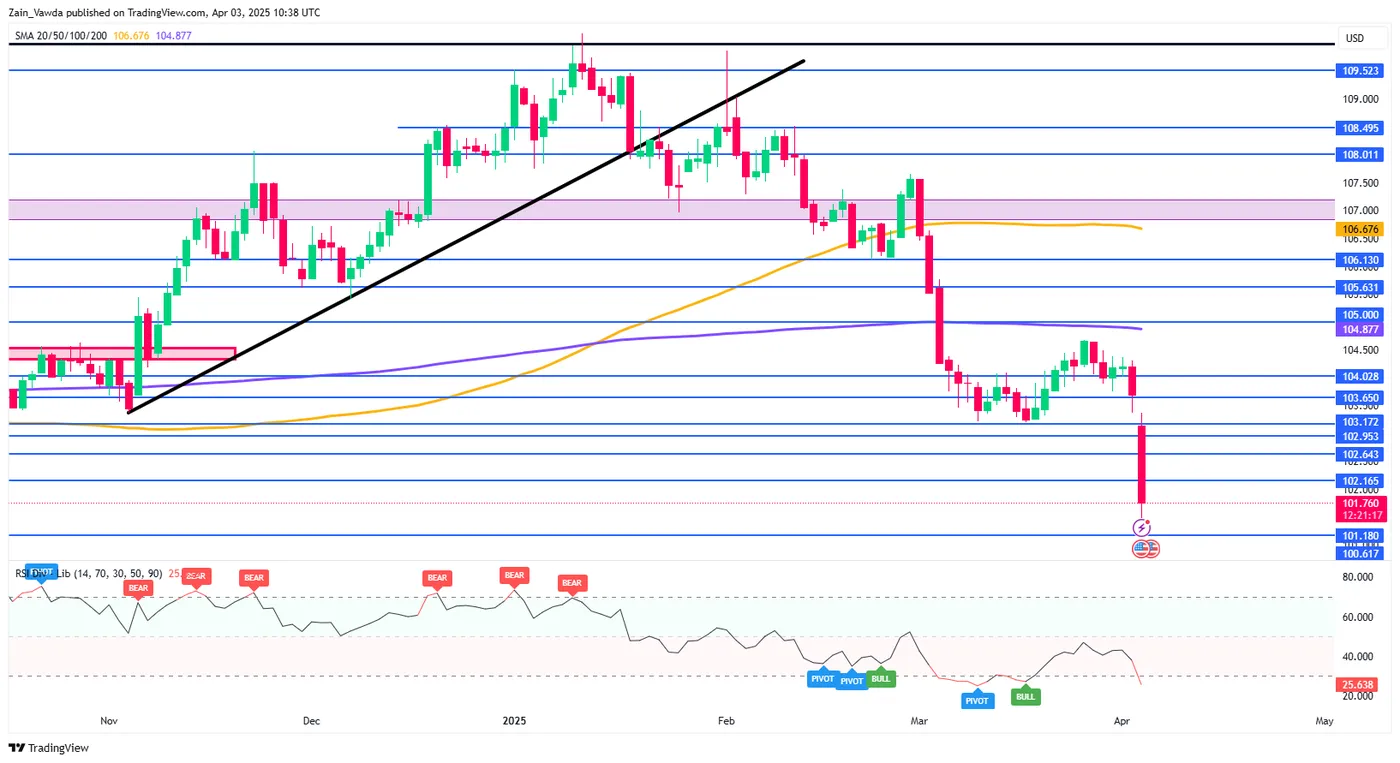
Source: TradingView.com
At the moment, EUR/USD appears to be riding the wave of a weaker US Dollar. Recent US data has also been underwhelming and could explain part of the move.
Positive PMI data adds to the Euros appeal. Is the momentum sustainable?
The eurozone's private sector economy grew slightly in March, marking the third month in a row of increased business activity and ending the first quarter of 2025 on a positive note. While this was the strongest growth since August 2024, it was still modest and below the survey's long-term average.
Despite a drop in new orders, businesses managed to increase output, and employment rose for the first time since last July. Price pressures eased, with input costs and output prices rising at their slowest rates this year.
The HCOB Eurozone Composite PMI® Output Index, which combines manufacturing and services data, rose to 50.9 in March from 50.2 in February. This indicates slight growth (any reading above 50.0 shows expansion) and the fastest pace in seven months, though still below the long-term average of 52.4.
Both manufacturing and services contributed to the growth. Manufacturing output increased for the first time in two years, and services activity grew faster than in February, though both saw only mild improvements.
Most eurozone countries reported higher business activity in March, except for France, which saw its seventh straight month of decline, though at a slower pace. Ireland led the growth, reaching a four-month high, just ahead of Spain. Germany and Italy also saw modest growth, with Germany achieving its strongest activity in ten months.
Despite the positive from the data above markets have increased their rate cut bets following a better than expected inflation print as well. A sign that market participants are not completely sold on the Euro rally over the longer term just yet.
Looking Ahead
There is still a lot left this week from a data perspective but market participants may keep an eye on tariff developments over economic data releases. This has been a growing trend of late.
Later today, attention will shift to the S&P Global and ISM Services PMI data for March, which will be released during US trading hours. The S&P Global Services PMI is expected to match the earlier estimate of 54.3, while the ISM Services PMI is predicted to drop slightly to 53.0 from February's 53.5, indicating moderate growth in the services sector.
The week will wrap up with US Nonfarm Payrolls (NFP) data for March, set to be released on Friday. This official jobs report will shape market expectations for the Federal Reserve's future monetary policy. Earlier, on Wednesday, the ADP Employment Change report showed the private sector added 155,000 jobs in March, much higher than the forecast of 105,000 and February's 84,000.
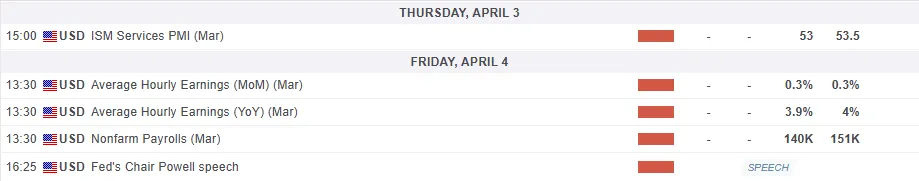
Technical Analysis - EUR/USD
Looking at EUR/USD from a technical standpoint, and the rally to the upside has run into a multi-month resistance level.
The other concern for bulls at this stage is that the RSI period 14 for EUR/USD is in overbought territory while the DXY is languishing in oversold territory. This could be worth paying attention as and when a drop materializes it could prove to be an aggressive one.
Market participants have upped their rate cut bets from the ECB to 92%, from 80% prior to last nights announcements by President Trump.
The next move for EUR/USD will depend on developments around the US Dollar in my opinion. Weaker data this week from the US will increase recessionary fears and thus could weigh on the US Dollar and by extension push EUR/USD toward the 1.1200 resistance handle.
Any positive data however, is unlikely to have a lasting impact as i expect the spectre of tariffs to continue to hover over market sentiment and the US Dollar in particular.
EUR/USD Daily Chart, April 3, 2025
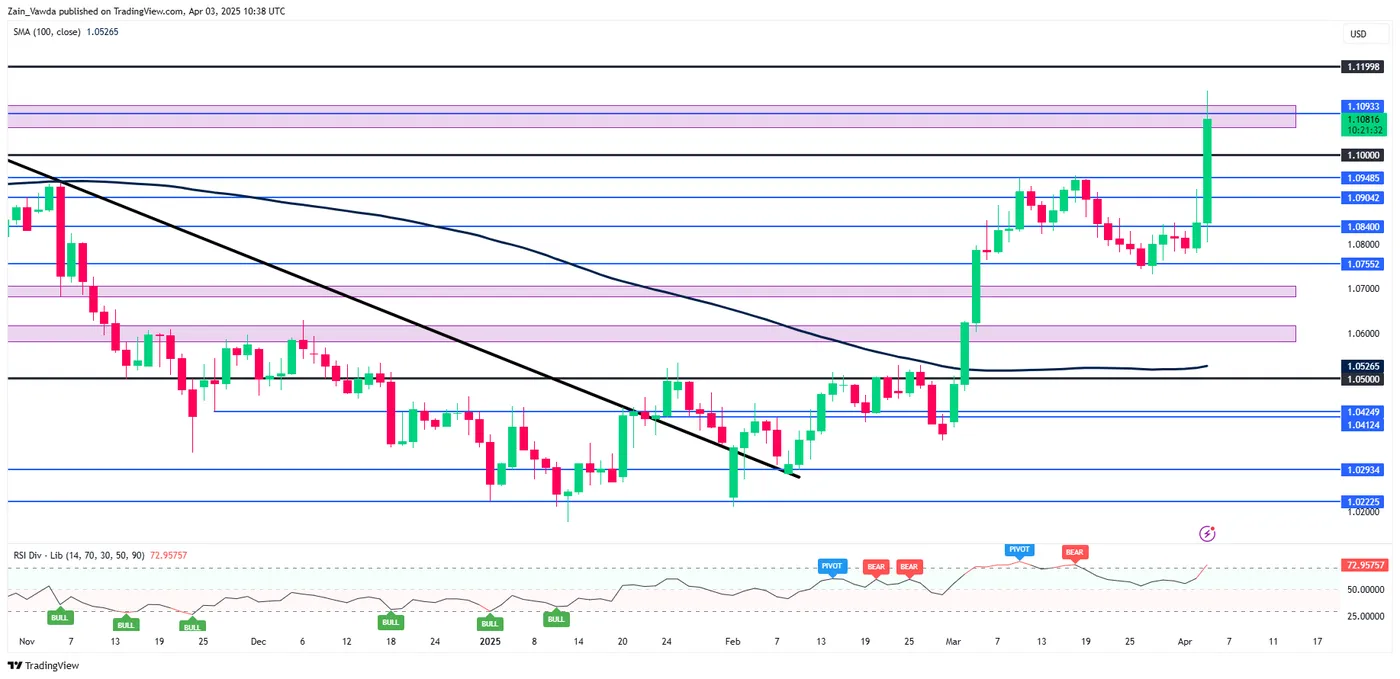
Source:TradingView.com
Support
- 1.1000
- 1.0948
- 1.0900
Resistance
- 1.1100
- 1.1200
- 1.1400