

Sample Category Title
EUR/USD Daily Outlook
Daily Pivots: (S1) 1.0785; (P) 1.0855; (R1) 1.0929; More...
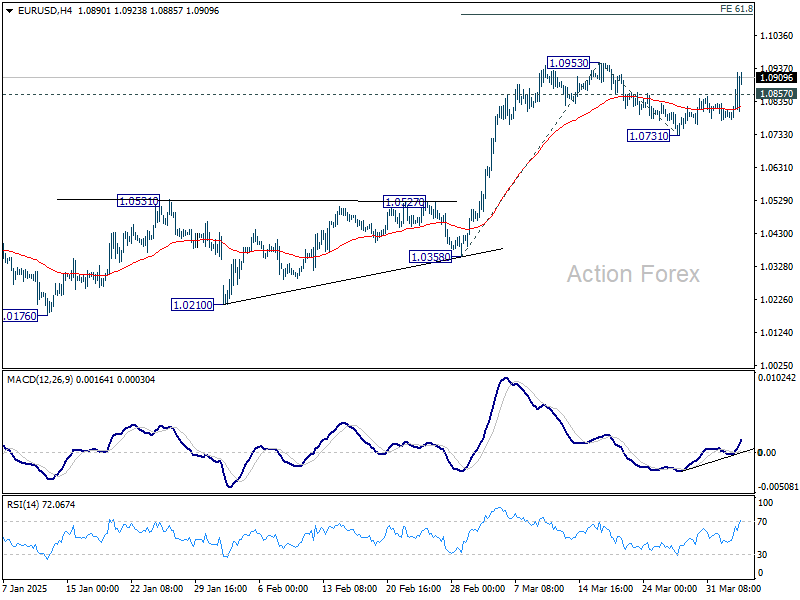
EUR/USD's break of 1.0857 resistance suggests that correction from 1.0953 has already completed at 1.0731. Intraday bias is back on the upside. Decisive break of 1.0953 will confirm resumption of whole rally from 1.0176. Next target is 61.8% projection of 1.0358 to 1.0953 from 1.0731 at 1.1099. This will now be the favored case as long as 1.0731 support holds, in case of retreat.
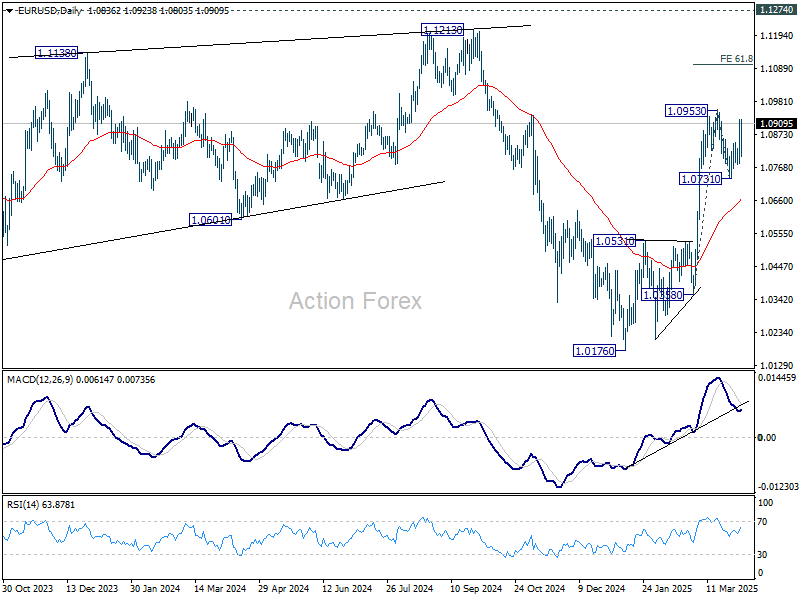
In the bigger picture, prior strong break of 55 W EMA (now at 1.0692) suggests that fall from 1.1274 (2024 high) has completed as a three wave correction to 1.0176. Rise from 0.9534 is still intact, and might be ready to resume. Decisive break of 1.1274 will target 100% projection of 0.9534 to 1.1274 from 1.0176 at 1.1916. Also, that will send EUR/USD through a multi-decade channel resistance will carries larger bullish implication. This will now be the favored case as long as 1.0531 resistance turned support holds.
GBP/USD Daily Outlook
Daily Pivots: (S1) 1.2932; (P) 1.2979; (R1) 1.3056; More...
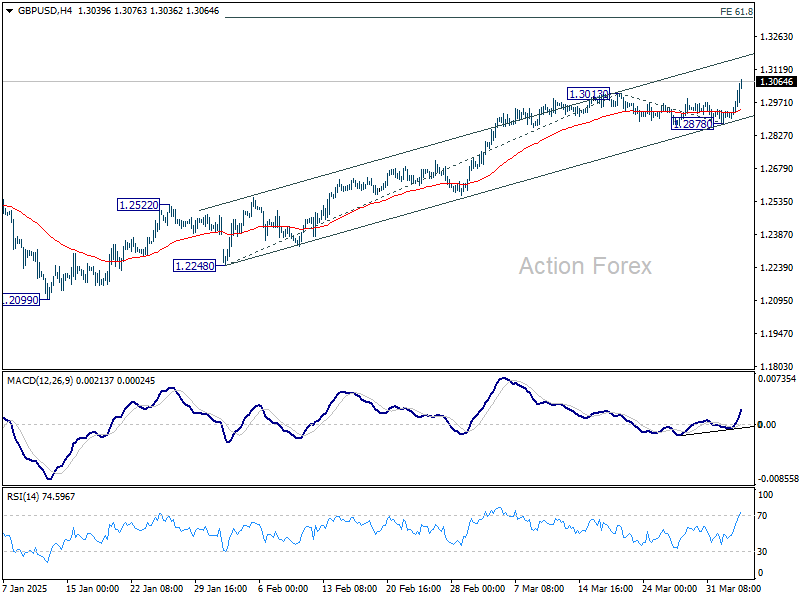
GBP/USD's rally from 1.2099 resumed by breaking through 1.3013 resistance. Intraday bias is back on the upside. Next target is 61.8% projection of 1.2248 to 1.3013 from 1.2878 at 1.3351. For now, outlook will remain bullish as long as 1.2878 support holds, in case of retreat.
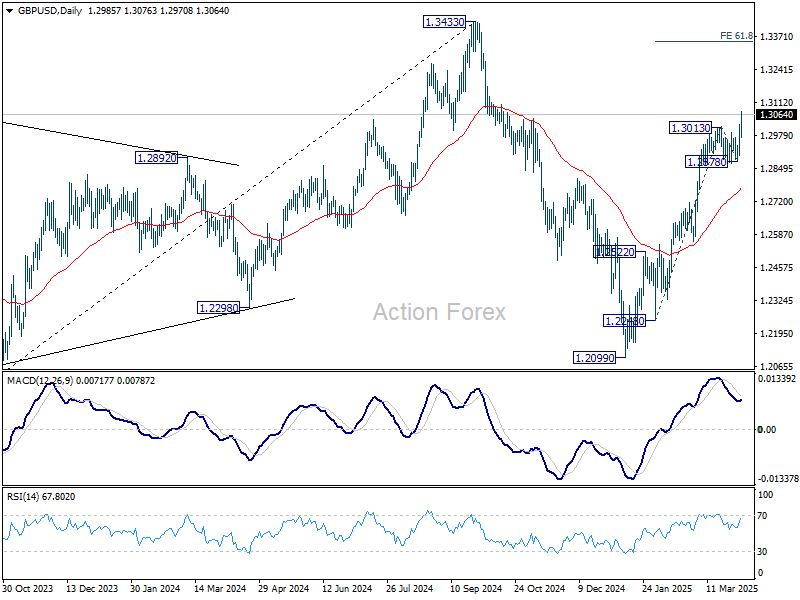
In the bigger picture, up trend from 1.3051 (2022 low) is not completed. Resumption is expected after corrective pattern from 1.3433 completes. Next target will be 1.4248 key resistance (2021 high). This will now remain the favored case as long as 1.2099 support holds.
USD/CHF Daily Outlook
Daily Pivots: (S1) 0.8805; (P) 0.8827; (R1) 0.8841; More…
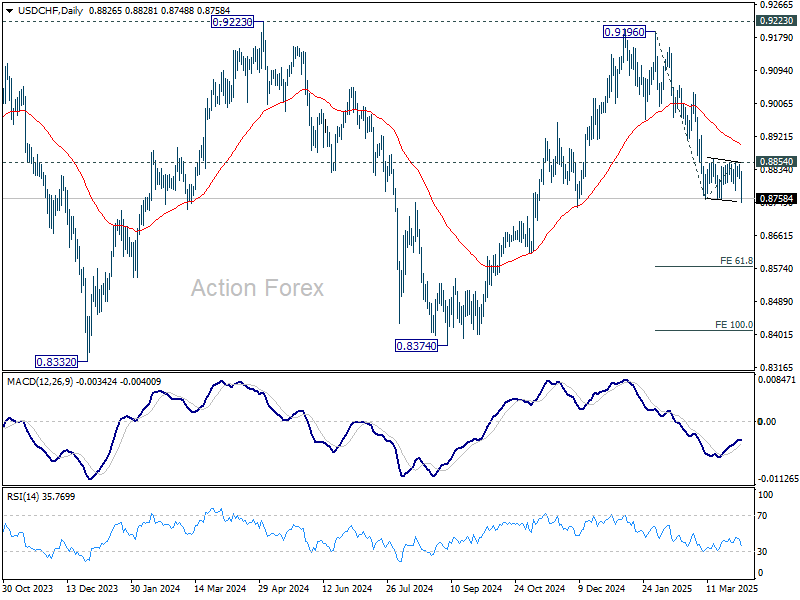
USD/CHF's breach of 0.8757 suggests that fall from 0.9196 is resuming. Intraday bias is back on the downside. Next target is 61.8% projection of 0.9196 to 0.8757 from 0.8854 at 0.8583. For now, outlook will stay bearish as long as 0.8854 resistance holds, in case of recovery.
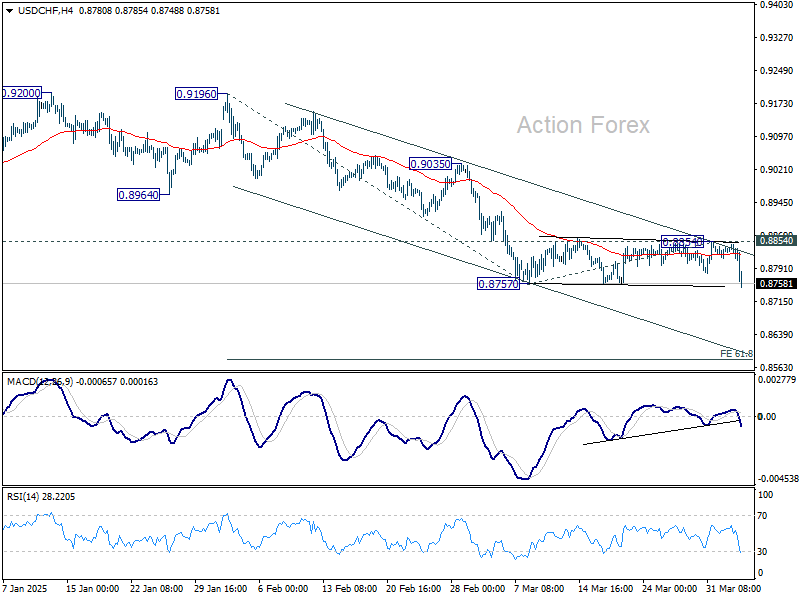
In the bigger picture, rejection by 0.9223 key resistance keep medium term outlook bearish. That is, larger fall from 1.0342 (2017 high) is not completed yet. Firm break of 0.8332 (2023 low) will confirm down trend resumption.
USD/JPY Daily Outlook
Daily Pivots: (S1) 148.80; (P) 149.64; (R1) 150.19; More...
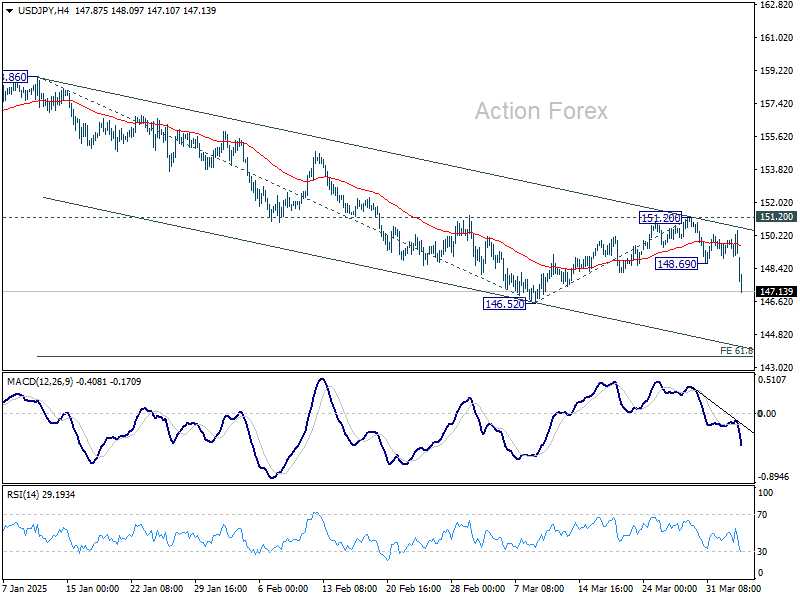
Intraday bias in USD/JPY is back on the downside with break of 148.69 and retest of 146.52 low should be seen next. Firm break there will resume whole fall from 158.86. Next target is 61.8% projection of 158.86 to 146.52 from 151.20 at 143.57. On the upside, above 148.69 support turned resistance will turn intraday bias neutral first. But recovery should be limited below 151.20 resistance to bring another fall.
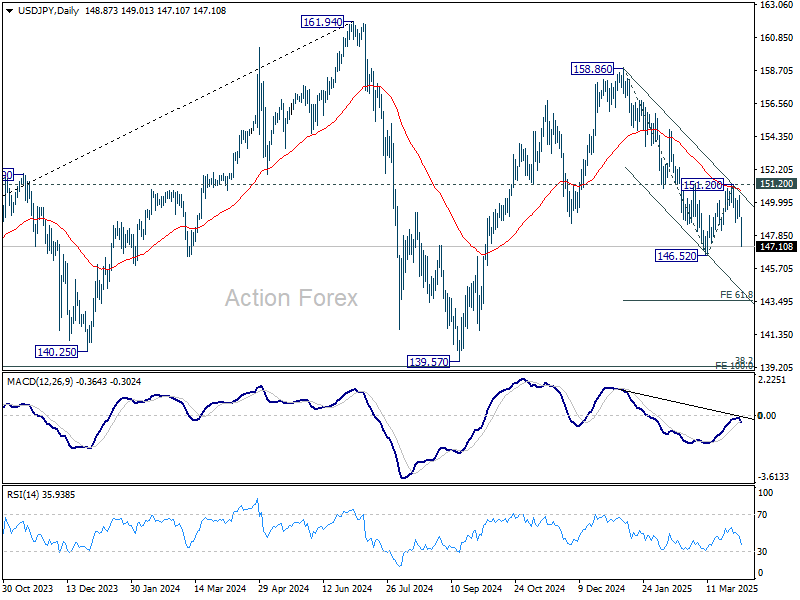
In the bigger picture, price actions from 161.94 are seen as a corrective pattern to rise from 102.58 (2021 low), with fall from 158.86 as the third leg. Strong support should be seen from 38.2% retracement of 102.58 to 161.94 at 139.26 to bring rebound. However, sustained break of 139.26 would open up deeper medium term decline to 61.8% retracement at 125.25.
Tariff Shock Hits US Markets Hard, But Global Reactions Split
Reactions in the US markets to the long-anticipated reciprocal tariff announcement were decisively negative. NASDAQ futures tumbled more than -3%, while DOW futures shed as much as -2% at one point. US 10-year yields plunged below the 4.1% mark, highlighting a strong wave of safe haven flows. The reactions confirm what traders feared most—not just new tariffs, but the sheer complexity and breadth of the measures rolled out by the White House.
However, the global market reaction was more uneven. Japan’s Nikkei plummeted by over -1,000 points, nearly -3%, reflecting its vulnerability given the 24% tariff rate applied to its goods. Meanwhile, Hong Kong’s HSI fared relatively better, falling by just -1.5%, while Singapore’s Straits Times Index even managed to claw back most of its early mild losses.
In currency markets, Aussie and Kiwi led the declines, driven by broad risk aversion and China’s exposure to some of the harshest tariff levels. Dollar also came under pressure, as investors pulled out of US assets. Yen emerged as the day’s biggest gainer on classic safe-haven flows, followed by Swiss Franc. Euro, Pound, and Canadian Dollar showed some resilience, as the EU, UK, and Canada either received relatively milder rates or were temporarily spared.
The White House confirmed a baseline 10% tariff on all countries starting April 5, with "reciprocal" rates up to 50% going into effect on April 9. Contrary to earlier hopes that the 10–20% range would serve as a maximum cap, these figures now appear to be just the starting point.
The US claims the new tariffs reflect roughly half of the effective trade barriers faced by American exports, accounting for both monetary and non-monetary impediments. But in practice, this means a steep increase in trade costs.
Many allies, including the EU (20%) and Japan (24%), were not spared, although Canada and Mexico were temporarily exempt. What’s more concerning is that these new tariffs are being layered on top of existing duties. The effective rate for China has ballooned to a staggering 54%, factoring in both new and existing duties.
The list of exemptions is narrow, covering only certain critical imports such as copper, pharmaceuticals, energy products, semiconductors, and minerals not available domestically.
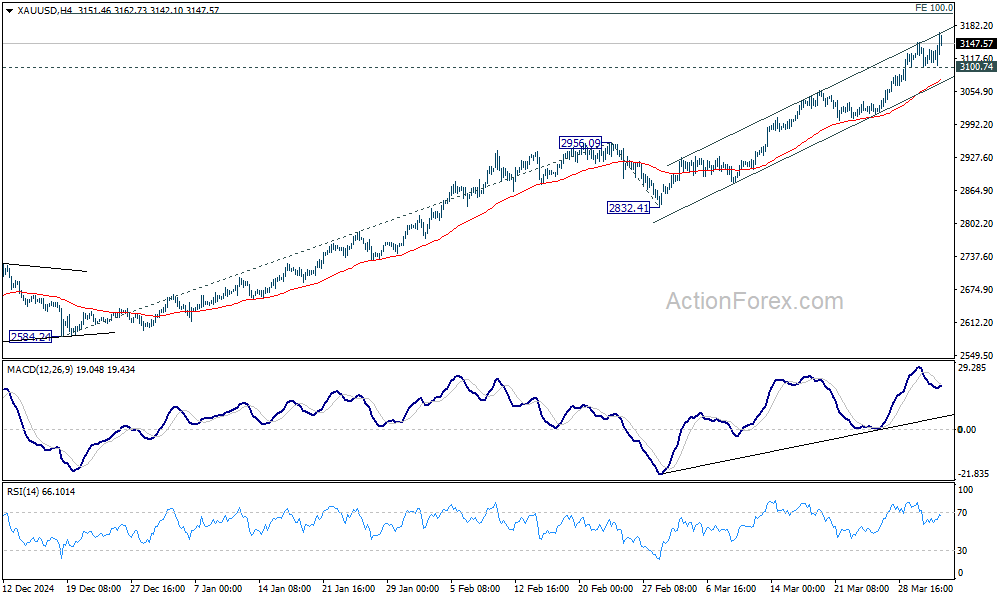
Gold, as expected, surged to a fresh record amid the turmoil, but signs of momentum exhaustion are emerging. While further rally is expected, Gold might find strong resistance at 100% projection of 2584.24 to 2956.09 from 2832.41 at 3204.26 to limit upside, at least on first attempt. Break of 3100.74 support will indicate short term topping and bring consolidations.
In Asia, at the time of writing, Nikkei is down -2.95%. Hong Kong HSI is down -1.77%. China Shanghai SSE is down -0.52%. Singapore Strait Times is down -0.17%. Japan 10-year JGB yield is down -0.099 at 1.38. Overnight, DOW rose 0.56%. S&P 500 rose 0.67%. NASDAQ rose 0.87%. 10-year yield rose 0.040 to 4.196.
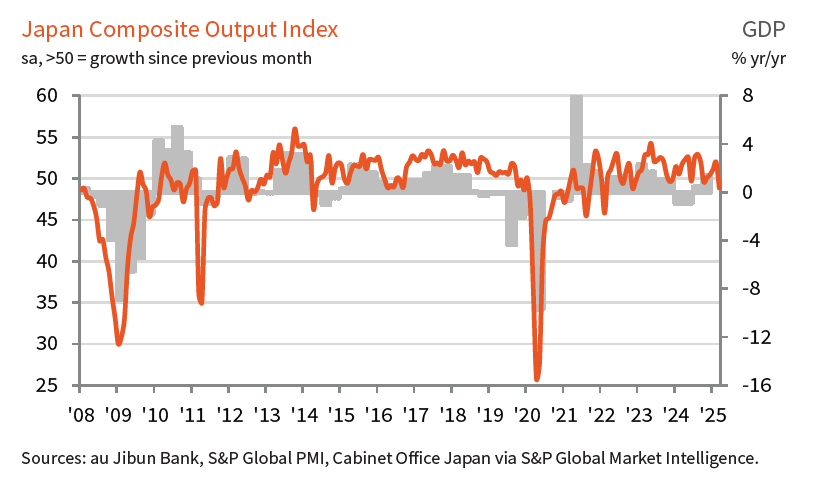
Japan’s PMI composite finalized at 48.9, back in contraction
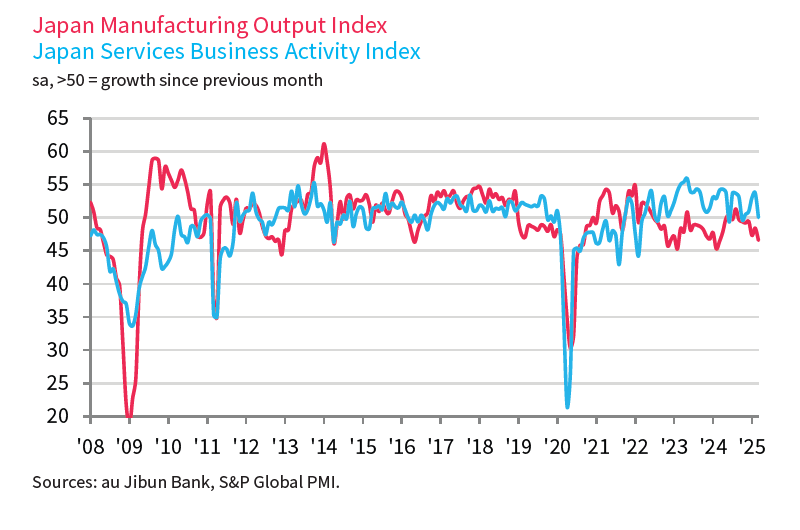
Japan’s services sector lost momentum in March, with the final PMI Services reading falling to the neutral mark of 50.0, down sharply from 53.7 in February. Composite PMI dropped to 48.9—its lowest since November 2022—signaling contraction in overall private sector activity.
S&P Global’s Annabel Fiddes noted that while new orders and export business in services remained in growth territory, market conditions had clearly softened.
Additionally, input costs across the private sector rose at the fastest pace in seven months, and output price inflation remained historically elevated.
Business sentiment also deteriorated, with overall optimism about the year-ahead outlook for output falling to its lowest since January 2021.
China’s Caixin PMI services rises to 51.9, but deflation and jobs remain concerns
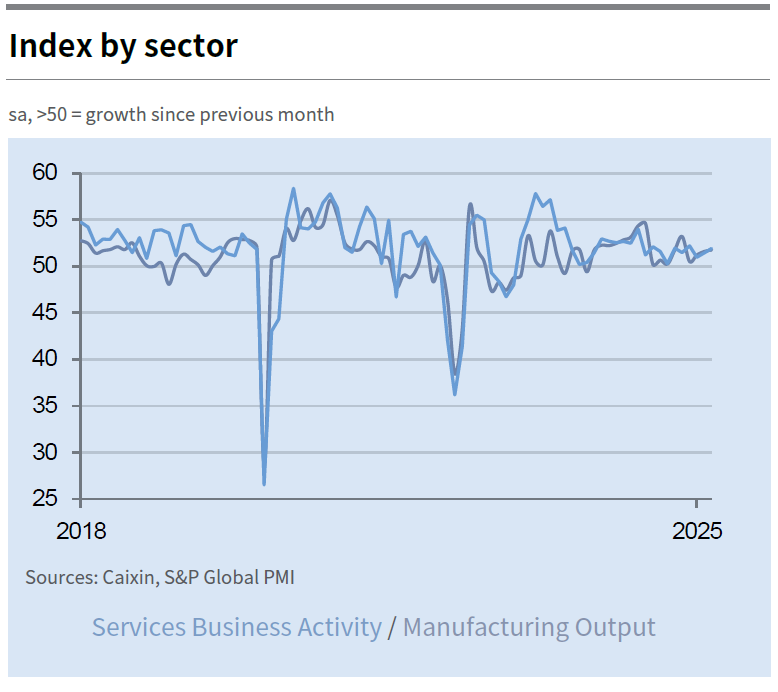
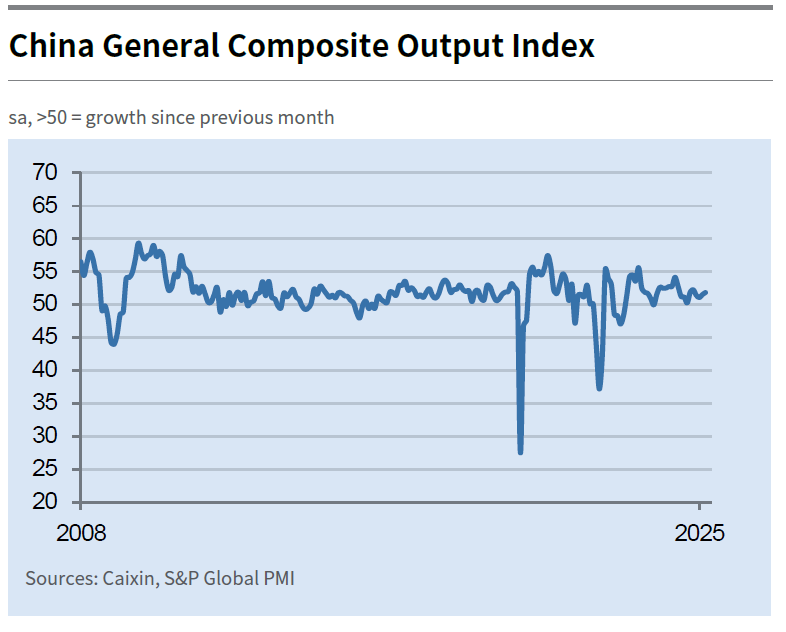
China’s Caixin Services PMI ticked up to 51.9 in March from 51.4, while Composite PMI rose to 51.8 from 51.5, marking the 17th consecutive month of expansion.
According to Caixin Insight Group’s Wang Zhe, both supply and demand showed improvement, particularly in manufacturing. However, service sector employment dragged overall job growth, and price pressures remained weak.
Despite signs of recovery and a stable start to the year, persistent deflationary pressures and a sluggish job market continue to weigh on sentiment. Wang noted that weak domestic demand and cautious market expectations were limiting momentum.
Looking ahead
ECB meeting accounts is a main feature in European session. Eurozone will release PPI and PMI services final. UK will also release PMI services final while Switzerland will publish CPI.
Later in the day, US ISM services will be the focus, as trade balance and jobless claims will be released. Canada trade balance will also be featured.
USD/JPY Daily Outlook
Daily Pivots: (S1) 148.80; (P) 149.64; (R1) 150.19; More...
Intraday bias in USD/JPY is back on the downside with break of 148.69 and retest of 146.52 low should be seen next. Firm break there will resume whole fall from 158.86. Next target is 61.8% projection of 158.86 to 146.52 from 151.20 at 143.57. On the upside, above 148.69 support turned resistance will turn intraday bias neutral first. But recovery should be limited below 151.20 resistance to bring another fall.
In the bigger picture, price actions from 161.94 are seen as a corrective pattern to rise from 102.58 (2021 low), with fall from 158.86 as the third leg. Strong support should be seen from 38.2% retracement of 102.58 to 161.94 at 139.26 to bring rebound. However, sustained break of 139.26 would open up deeper medium term decline to 61.8% retracement at 125.25.
China’s Caixin PMI services rises to 51.9, but deflation and jobs remain concerns
China’s Caixin Services PMI ticked up to 51.9 in March from 51.4, while Composite PMI rose to 51.8 from 51.5, marking the 17th consecutive month of expansion.
According to Caixin Insight Group’s Wang Zhe, both supply and demand showed improvement, particularly in manufacturing. However, service sector employment dragged overall job growth, and price pressures remained weak.
Despite signs of recovery and a stable start to the year, persistent deflationary pressures and a sluggish job market continue to weigh on sentiment. Wang noted that weak domestic demand and cautious market expectations were limiting momentum.
Japan’s PMI composite finalized at 48.9, back in contraction
Japan’s services sector lost momentum in March, with the final PMI Services reading falling to the neutral mark of 50.0, down sharply from 53.7 in February. Composite PMI dropped to 48.9—its lowest since November 2022—signaling contraction in overall private sector activity.
S&P Global’s Annabel Fiddes noted that while new orders and export business in services remained in growth territory, market conditions had clearly softened.
Additionally, input costs across the private sector rose at the fastest pace in seven months, and output price inflation remained historically elevated.
Business sentiment also deteriorated, with overall optimism about the year-ahead outlook for output falling to its lowest since January 2021.
GBP/USD Bulls in Action—Can They Extend The Rally?
Key Highlights
- GBP/USD started a consolidation phase below the 1.3000 resistance.
- A key declining channel or a bullish flag is forming with resistance at 1.2955 on the 4-hour chart.
- EUR/USD is eyeing a fresh increase above the 1.0870 resistance zone.
- Gold prices corrected some gains after setting a record high near $3,150.
GBP/USD Technical Analysis
The British Pound failed to continue higher above the 1.3000 resistance against the US Dollar. GBP/USD corrected some gains and tested the 1.2880 support.
Looking at the 4-hour chart, the pair traded below the 100 simple moving average (red, 4-hour) but remained above the 200 simple moving average (green, 4-hour). There was a move below the 23.6% Fib retracement level of the upward move from the 1.2557 swing low to the 1.3014 high.
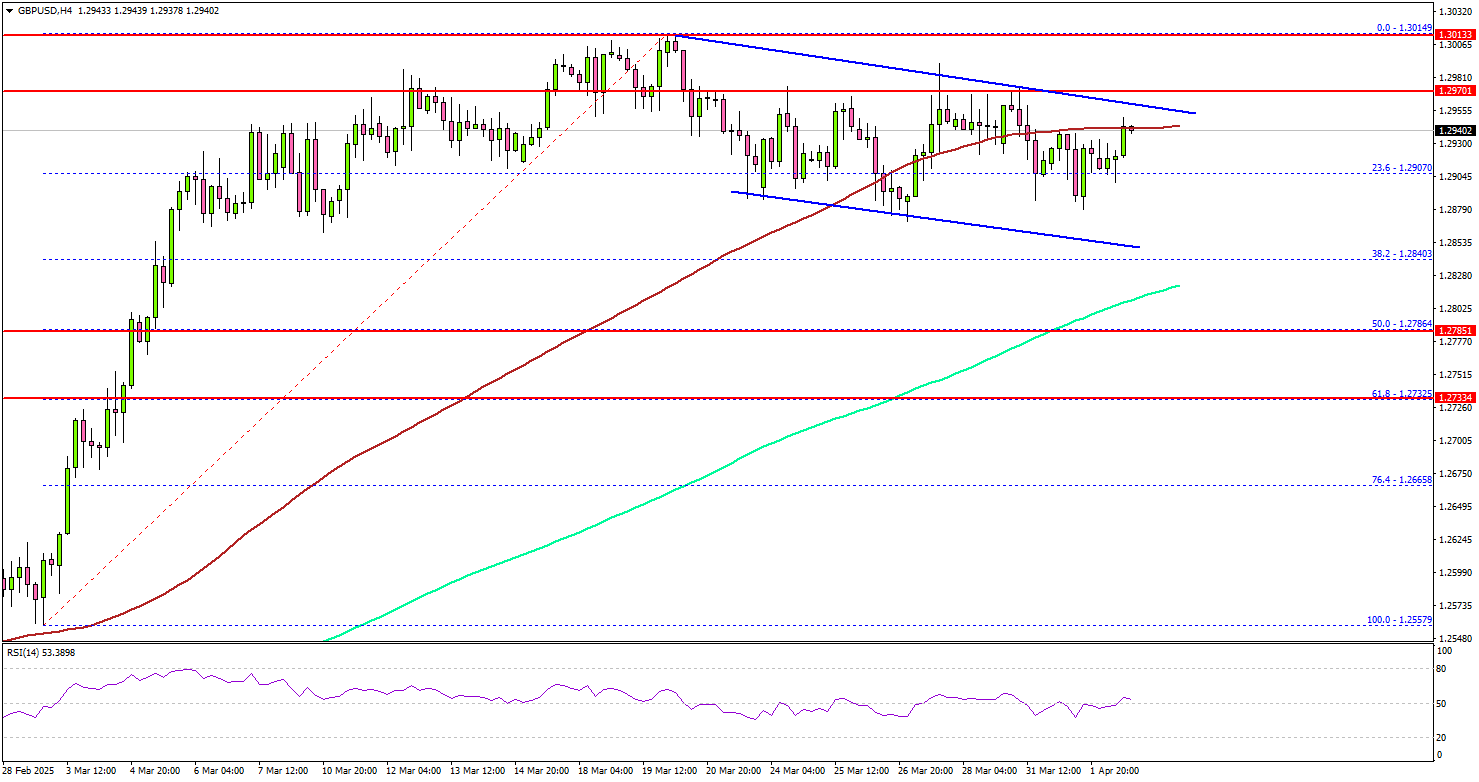
The pair is now attempting a fresh increase above 1.2900. On the upside, the pair is facing resistance near the 1.2960 level. There is also a key declining channel or a bullish flag forming with resistance at 1.2955 on the same chart.
The next major resistance is near the 1.2980 level. The main resistance is now forming near the 1.3000 zone. A close above the 1.3000 level could set the tone for another increase. In the stated case, the pair could even clear the 1.3050 resistance.
On the downside, immediate support sits near the 1.2880 level. The next key support sits near the 1.2860 level. Any more losses could send the pair toward the 1.2820 level.
Looking at Gold, the bulls remained in action and pushed the price to a new record high before there was a downside correction.
Upcoming Economic Events:
- Euro Zone Services PMI for March 2025 – Forecast 50.4, versus 50.4 previous.
- UK Services PMI for March 2025 – Forecast 53.2, versus 53.2 previous.
- US Services PMI for March 2025 – Forecast 54.3, versus 54.3 previous.
- US ISM Services PMI for March 2025 – Forecast 53.0, versus 53.5 previous.
U.S. Reciprocal Tariffs Spare Canada/Mexico for Now But Trade Risks Remain
The long-awaited U.S. reciprocal tariffs announced have been large and broad-based, but critically exempt Canada and Mexico (at least for now) through CUSMA/USMCA compliant trade.
The announcement includes a baseline 10% minimum tariff rate for all countries as of April 5th, but with substantially higher tariff rates imposed on specific countries to follow on April 9th —particularly those that make up the bulk of the U.S. trade deficit. That includes a 34% increase on import tariffs from China, 26% on India, a whopping 46% on imports from Vietnam, and 20% on imports from the European Union.
Tariffs on imports from Canada are still set to rise on Thursday. Auto tariffs announced last week will still push the average U.S. tariff rate on imports from Canada to about 3.5% from 2.5% by our count. That increase will still matter, but looks small now compared to dramatically higher tariffs set to be imposed on other countries.
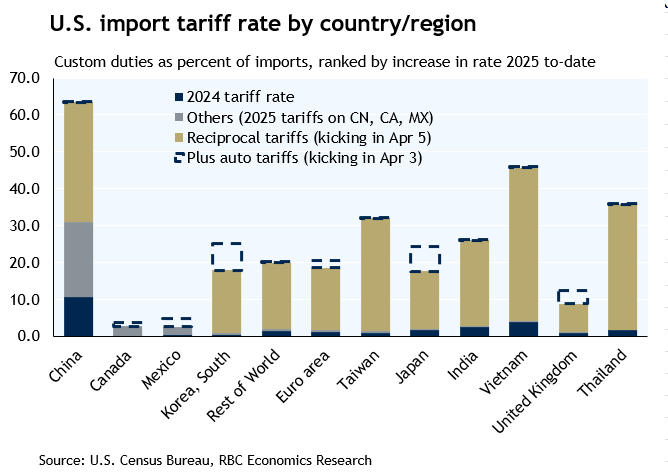
A lower tariff rate increase is positive for Canada on a relative basis, and it eliminates what had been a growing incentive for U.S. importers to purchase goods from other regions. But, that will be little consolation if overall tariffs are large enough to shrink U.S. demand and the total U.S. import market overall.
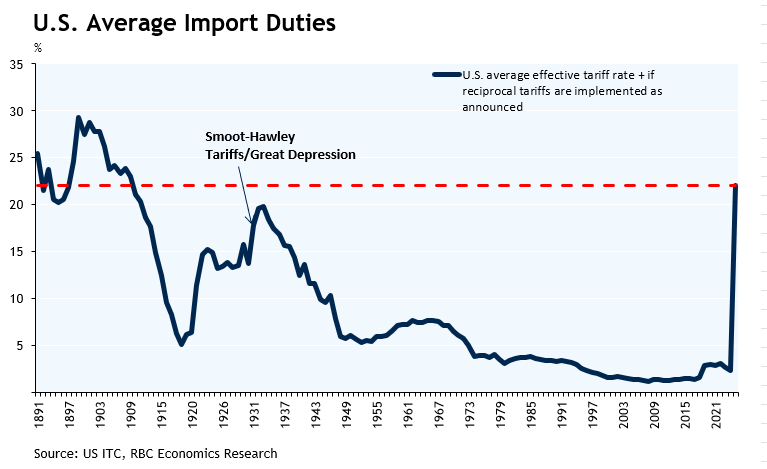
Prior tariff announcements have been significantly altered or rolled back days (or even hours) after, and there is a big possibility that tariffs announced today will look different a week from now. But, if the measures today are implemented, it would push the average U.S. import tariff rate to over 20%— according to our estimates—the highest rate in more than a century.
Today’s announcement will not be the last on trade from the U.S. administration and we will continue to rely on our tariff playbook to assess about how these announcements will impact the Canadian economy.
Magnitude of tariff hikes add downside risks to U.S. growth and supply chains.
Broadly speaking, we have argued before that U.S. buyers will have difficulty finding domestically produced alternatives to imports. A wave of retirements and immigration cutbacks limit the amount that American production can increase in the near-term, and capital investments to “reshore” manufacturing production will take years and billions.
Given those constraints in the near-term to U.S. domestic production capacity, the impact of tariffs depends largely on whether alternative, cheaper import markets are available. Canada’s position compared to other countries on import tariffs looks substantially better today than it did yesterday. But, there’s also the looming threat of whether the total tariffs imposed are large enough to significantly weaken U.S. economic growth and shrink the size of the total import pie.
Furthermore, even though, most of Canada’s trade is directly with the U.S., supply chain disruptions after pandemic lockdowns eased is a reminder of how disruptions globally can spill over to Canadian production and price growth.
The U.S. economy is much less trade sensitive than many of its trading partners (including Canada)—and we do not have a recession as a base case expectation for the U.S. economy. But, tariff hikes, headwinds from government spending cuts, and reduced immigration are adding to yellow flags in the U.S. economic outlook.
Trade uncertainty is here to stay
With or without additional tariff measures, trade uncertainty is threatening to slow consumer and business spending.
Our tracking of Canadian consumer spending is holding up significantly better than consumer confidence so far. And, motor vehicle sales spiked higher in both Canada and the U.S., likely in part as consumers rushed to get ahead of possible auto tariff hikes. But, we expect business investment will remain weak regardless of additional tariff measures.
U.S. Liberation Day Binds The World To High Tariffs
The U.S. administration announced broad reciprocal tariffs today, targeting all trading partners, and not just the countries that run large trade surpluses with the U.S. The tariffs will be implemented under the International Emergency Economic Powers Act (IEEPA) of 1977.
Using IIEPA authority, the U.S. will impose a 10% tariff on all countries, effective April 5th, 2025. However, the administration also imposed higher tariff rates on countries with the largest trade deficits, which takes effect April 9th.
Based on today's announcement, we estimate that the U.S. effective tariff rate will jump to over 20%, the highest level since the 1940's and a larger increase than what occurred under the Smoot-Hawley legislation during the early 1930s.
Canada is exempt from reciprocal tariffs and the baseline 10% rate, as prior tariff announcements remain in effect. This leaves the effective tariff on Canada at around 10%, close to what we assumed in our March quarterly forecast. This rate is likely to come down as more companies adjust to qualify their goods as USMCA compliant. Given the scarring on consumers and businesses, our forecast for a pullback in economic growth alongside higher inflation remains intact.
Relative to our baseline assumptions, the tariff rates for non-USMCA countries are a step higher. For the E.U. the 20% rate announced today is in line with what we had assumed. However, this is not true for all others. China will be more heavily hit than our baseline assumption of 30%. Likewise, on other trading partners, we had assumed a blanket 5% rate which is now a minimum of 10%, with many countries higher like Taiwan, South Korea and Vietnam at 32%, 25% and 46%, respectively.
U.S. Implications
Today's announcement will raise the U.S. effective tariff rate to over 20%, the highest level since the early-1940's and notably above the 14% assumed in our Quarterly Economic Forecast. At this point, the big unknown is duration. Our forecast assumes that the peak tariff rate remains in-effect for just six-months, after which most countries/regions (except for China) see some reprieve. Should the tariffs remain elevated for longer, the odds of U.S. economic stagnation rises. Likewise, inflation is at risk of approaching 4% or more.
Heightened trade uncertainty has already led consumers to tap the brakes, with households increasingly worried about inflation, employment, and income prospects. Consumer spending is tracking a paltry 0.5% in the first quarter, after expanding by a robust 3.6% annualized in H2-2024.
The constant saber-rattling of tariff threats has also distorted trade flows, with imports surging in recent months as businesses try to front-run the tariffs. Net trade could shave several percentage points from Q1 GDP growth. Given the weak spending backdrop, the economy is at risk of contracting.
Tariffs that remain in place indefinitely would force some reshoring of production, but this would be a multi-year process and would come at a cost. Assuming a permanent tariff rate close to today's proposed level, our model suggests that it could lift the level of employment by nearly 500,000 in the long-run, most of those jobs related to manufacturing. However, the tariffs would also raise the average household's cost of living by over $4,850 per year – equivalent to a tax hike of 2% of GDP – implying an associated cost of $1,250,000 for every job reshored.
- Reshoring jobs is just the first hurdle. The manufacturing sector faces significant headwinds with persistent skill and labor shortages. Job openings within the sector already sit at more than 450,000 positions. Adding another 500,000 positions over the coming years will be a challenge without significant investments in skills training and recruitment, particularly for software and technical skills. The manufacturing jobs of yesterday are not those of the future.
The tariffs are likely to be viewed as helping to pay for proposed tax cuts. These include exempting Social Security payments, tip income and overtime pay from taxation. Combined, these policy changes are estimated to cost north of $3.5 trillion over the next decade, in addition to the $4 trillion required to extend the 2017 Tax Cuts & Jobs Act (TCJA). If today's tariffs become permanent, they could generate an estimated $6 trillion in revenue over the next decade, more than offsetting the cost to extend TCJA. Extending TCJA avoids fiscal tightening, but does not provide an additional boost to momentum. The economic multiplier is zero (see Perspective).
Canada Implications
For now there are no changes for Canada relative to prior announcements. Canada is exempt from the reciprocal tariffs and the baseline 10% rate.
Instead, Canada will continue to be subject to the 25% “fentanyl/illegal immigration” tariff, with 10% on energy and carve outs for USMCA compliant goods. It’s estimated that around 40% of the dollar value of goods travelling across the border are declared as USMCA compliant, although more firms may make the effort to become compliant. It’s estimated that 80-90% of the value of exports could become USMCA compliant. If the U.S. decides that progress has been made on fentanyl/illegal immigration, the 25% non-compliant tariff will be cut to 12% (and energy/potash would be exempt all together).
Past tariff announcements have already begun snaking through supply chains, such as 25% on steel and aluminum. Then there’s the 25% tariff on finished vehicle imports that take effect tomorrow. As it stands, the effective tariff on Canada is now around 10%, up from less than 2% before President Trump came into office. This is close to the 12.5% we assumed in our baseline forecast last month. Bear in mind that USMCA -compliant auto parts and lumber are still caught in the crosshairs without a specific timeline.
Canada previously retaliated with approximately $60 billion in tariffs on U.S. goods, with the next tranche set at $125 billion based on the Liberal government's guidance in February. With elections on April 28th, how the incoming government will respond remains to be seen.
Our baseline assumed all levels of Canadian government would spend an extra 1% of GDP in 2025 to support growth. That now appears to be on the low end. Based on the provincial budgets released to date, stimulus measures have already totaled 0.3% of GDP. Ontario is expected to release its budget sometime in mid-April, potentially bringing the cumulative fiscal spend to 1% of GDP. Adding Federal fiscal measures could double this figure. Although this will take the sting out of tariffs, it won’t prevent near-term economic stagnation as companies and labour markets absorb the policy shock. Canada will need to brace for a long period of economic restructuring. Even if the tariffs are removed or lessened in short order, Canadians cannot “unsee” the past three months. Returning to a place of commitment and trust would be unrealistic.
Inflation is expected to reach above 3% by the summer, with any easing achieved through lower tariff rates. For the Bank of Canada, they will be closely monitoring two areas: inflation expectations and governments' response. As the central bank has noted, they have limited capacity to push against a policy shock of this nature. Don’t expect a substantial drop in interest rates, but there is room for at least 50 basis points of cuts to ease financing costs.