Sample Category Title
A Worrisome Lull in Crypto
Market Picture
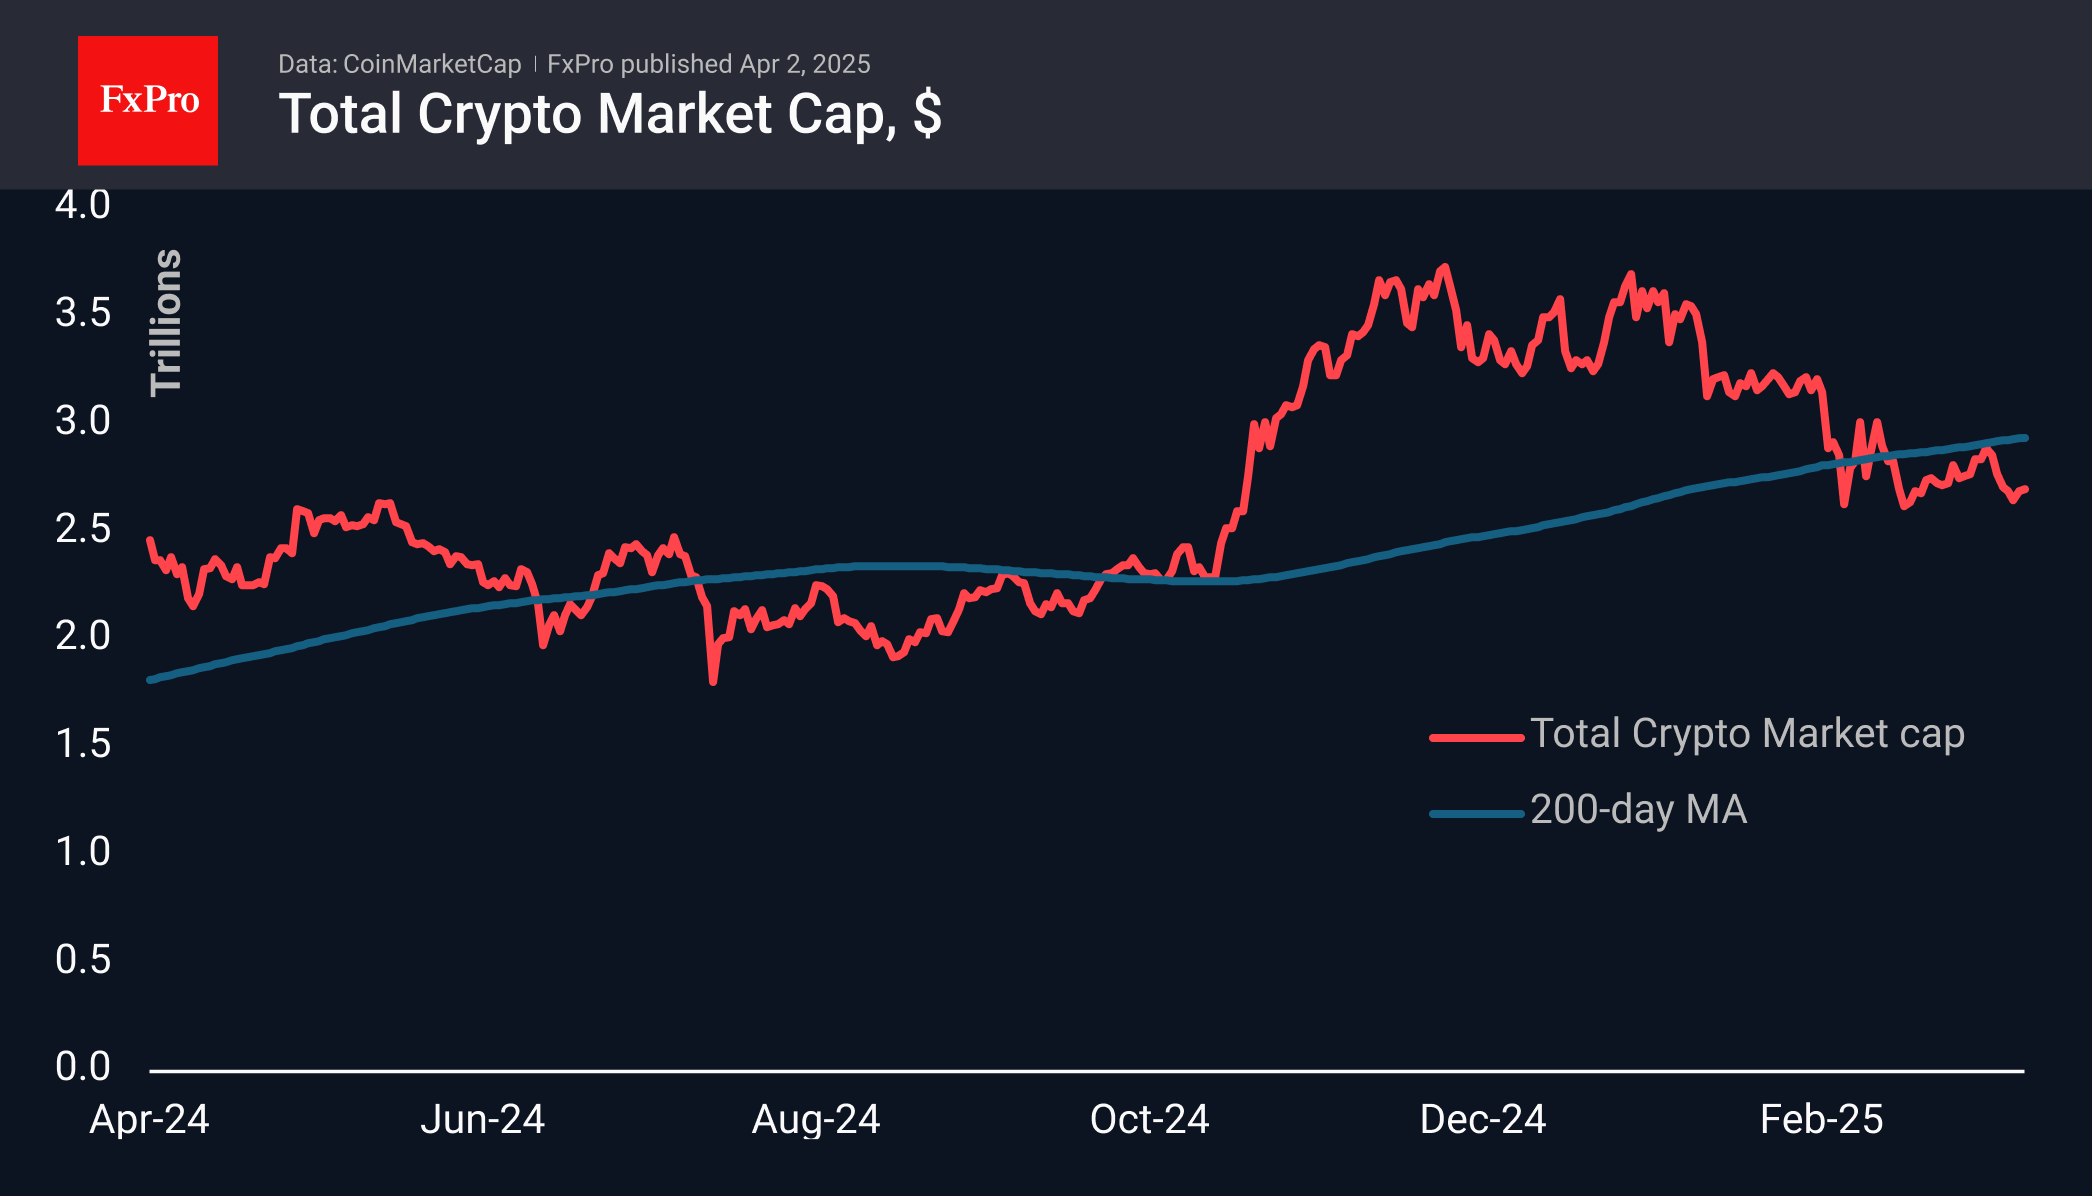
The crypto market cap was virtually unchanged over the past day, remaining near the $2.70 trillion level. Media reports suggest that all markets are frozen in anticipation of the tariffs and bracing for volatility. We see this as a continuation of a prolonged pause, allowing the bears to accumulate liquidity before a new attack. We will see confirmation of this bearish scenario if market capitalisation falls below $2.62 trillion – the area of previous lows.
The Crypto Market Sentiment Index jumped 10 points to 44 because of the lull, which is close to the upper limit of the fear zone. However, this rise is due to a pause in the sell-off rather than an active recovery.
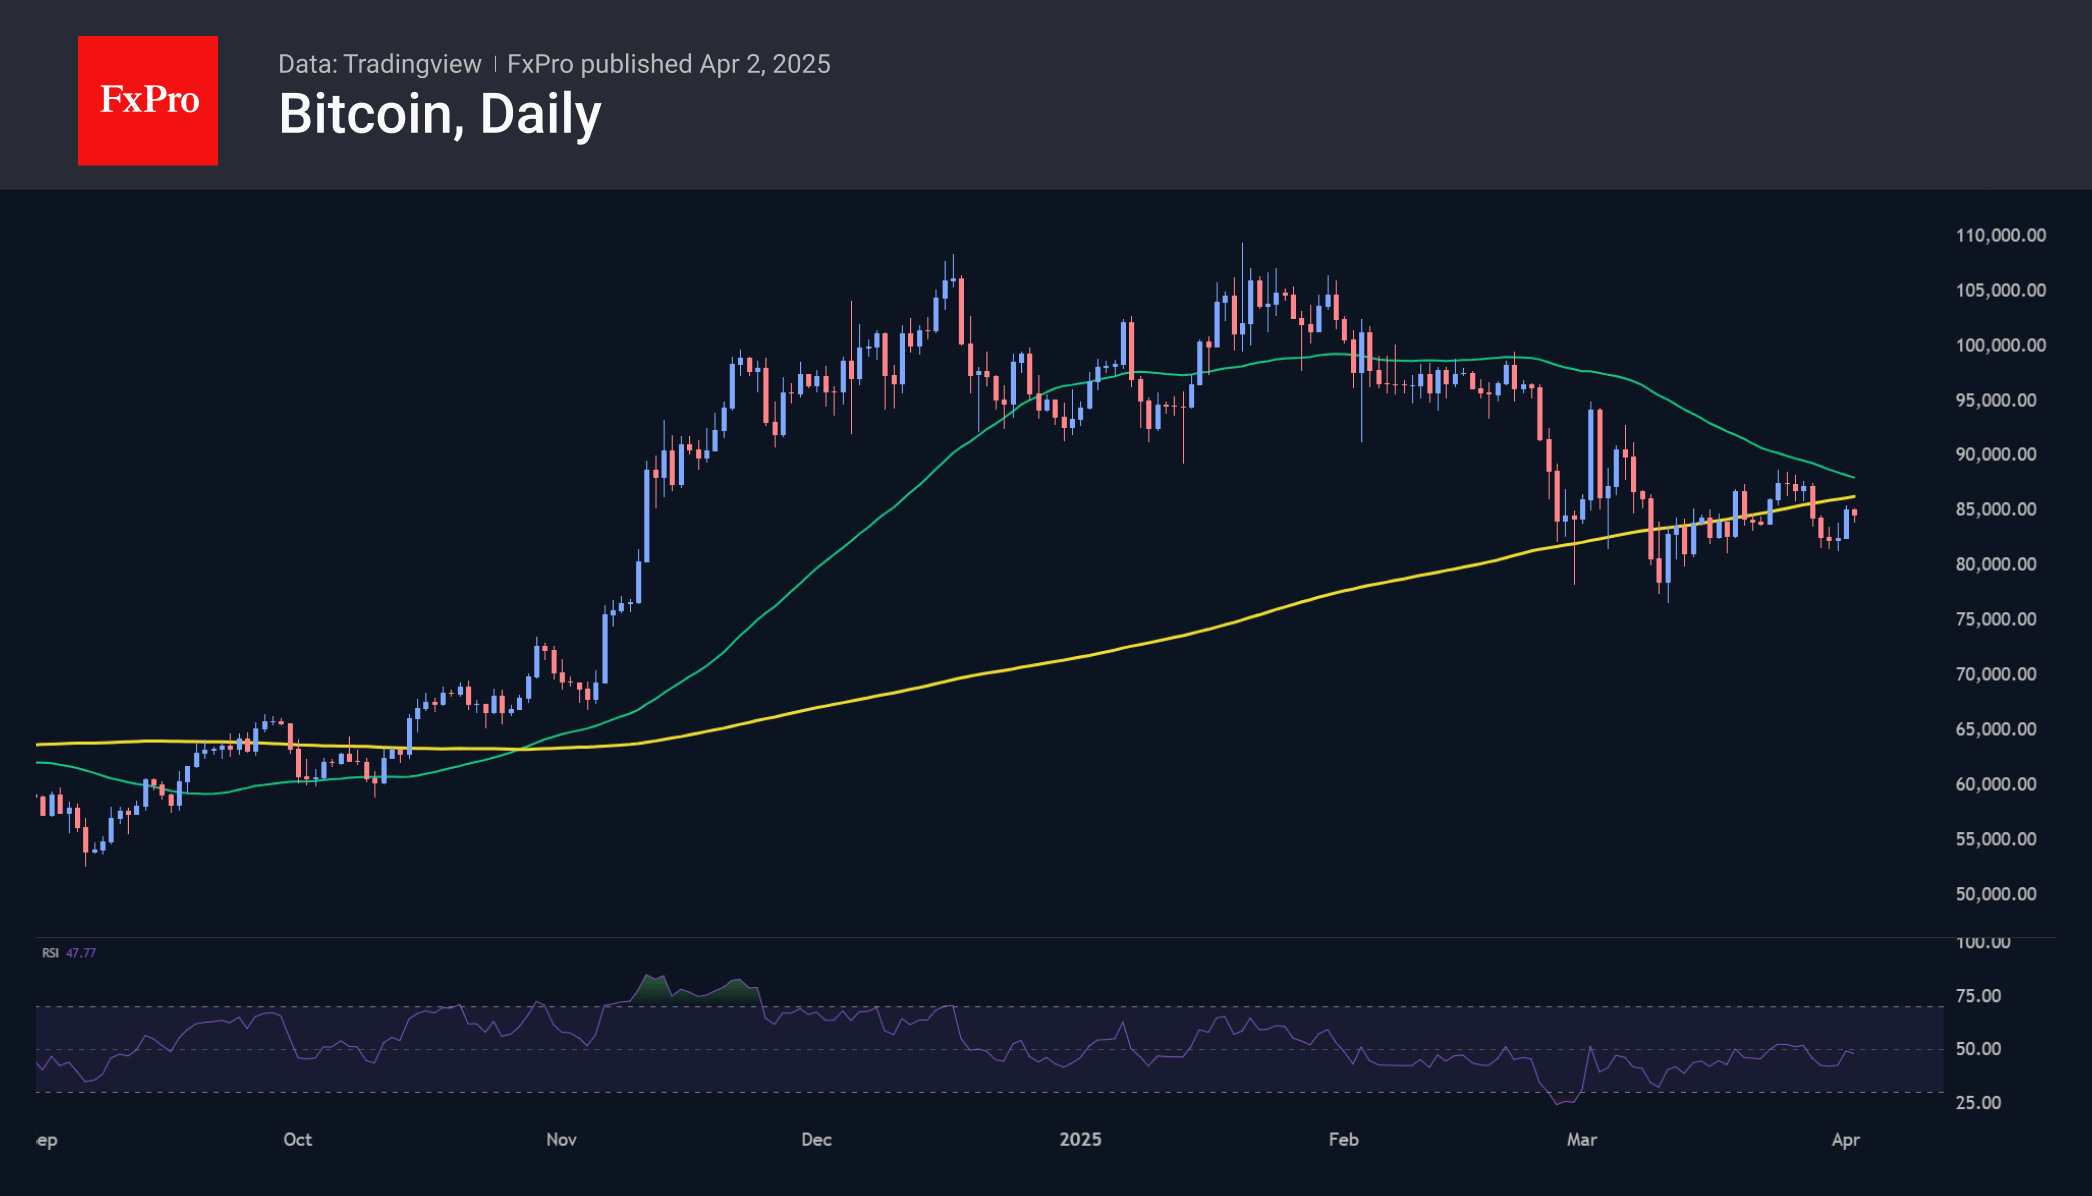
Bitcoin gained more than 3.5% on Tuesday but paused near $85,300. Once again, the upside momentum was lost on the approach to the 200-day moving average, which is now above $86,400. This is a case where the lack of growth is setting the stage for a decline. At the same time, we prefer to look at Friday’s employment data rather than tariffs to find the fundamental reasons for the next move. The former is a more reliable source of information.
News Background
Several on-chain indicators point to a gradual shift in sentiment, a return to buying and ‘structural strength in the market’, notes Bitcoin Magazine Pro. However, BTC remains ‘closely tied to macro liquidity trends and equity markets’.
Cycle tops occur every four years in November-December. There is scope for the pattern to repeat itself this year, with Bitcoin rising to $150,000, the Cyclop analyst expects.
Tether, which issues the USDT stablecoin, bought 8,888 BTC for $734 million, bringing its reserves to 92,646 BTC. In line with its strategy, Tether adds to its reserves at the end of each quarter.
On 1 April, around ten small-cap altcoins, such as ACT, DEXE and HIPPO, saw their prices plummet by up to 50%. The community linked the crash to market maker Wintermute’s sell-offs, but the company’s founder denied its involvement in the collapse.
XAU/USD: Gold Steady Near New All-Time High as Markets Await Announcement of New US Tariffs
Gold prices remain firm and hold above $3100 for the second consecutive day, after the metal hit new record high at $3149 on Tuesday.
Strong safe haven demand on high economic and geopolitical uncertainties continues to lift gold price, which advanced over $400 since President Trump started his term in the White house.
The yellow metal ended March with over 9% gains that marks the biggest monthly gain since August 2011 and was up over 18% in the first three months of the year.
All eyes are now on President Trump’s announcement of reciprocal tariffs (due today at 20:00 GMT) which is expected to generate strong direction signal.
If Trump decides to act according to his promises during the past few weeks and announce implementation of full package of new tariffs on various countries (in addition to existing tariffs), gold would appreciate further in such scenario.
Violation of immediate barriers at $3149/57 to expose targets at $3171 and $3200, with stronger acceleration higher not ruled if markets anticipate that consequences of escalating trade war will be dramatic.
Additional support to metal’s price would come from worsening situation in Ukraine following warnings of peace talks failure, as well as deteriorating economic conditions in US and EU, following recent discouraging economic data.
On the other hand, softer tariff rhetoric from Trump would ease bullish pressure and probably deflate gold price, though dips likely to be limited as overall picture is still very bullish, with other factors fueling safe haven demand, remaining firmly in play.
Broken $3100 level reverted to initial and solid support, followed by rising 10DMA ($3062), and Fibo 38.2% of $2032/$3149 ($3028), with $3000 level (psychological / higher base) likely to contain extended dips and keep larger bulls in play.
Res: 3149; 3157; 3177; 3200.
Sup: 3108; 3100; 3062; 3028.
Gold Prices Hover Near Record Highs Ahead of Trump’s Tariff Announcement
As shown on the XAU/USD chart today, gold prices are fluctuating near their all-time high, set when the price of an ounce surpassed $3,140 for the first time in history.
Gold has risen by approximately 19% in the first three months of 2025.
Why Is Gold Rising?
On 2 April, traders' sentiment is driving gold prices higher in anticipation of US President Trump’s tariff announcements, expected later this evening.
This event enhances gold’s appeal as a safe-haven asset, as concerns grow that Trump’s aggressive trade policies could slow global economic growth and fuel inflation.
Additionally, media reports highlight strong demand for gold from central banks, while exchange-traded funds linked to the precious metal are seeing capital inflows from investors concerned about geopolitical uncertainty.
Technical Analysis of XAU/USD
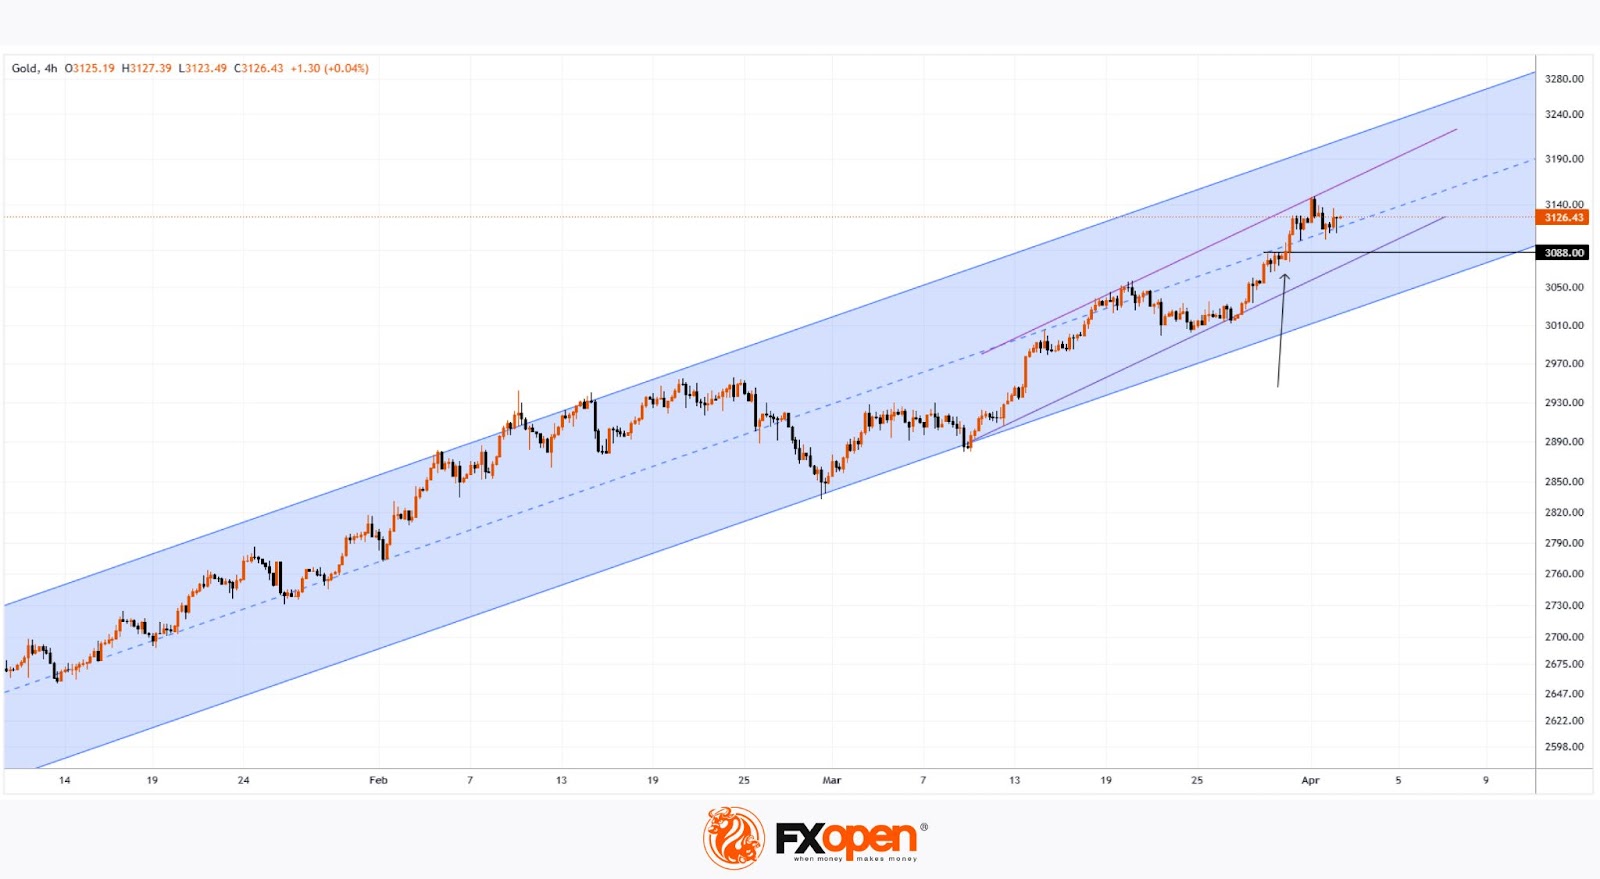
Gold price movements have formed two ascending channels in 2025: a broader blue channel and a steeper purple channel.
Notably, gold is currently trading near the midpoints of both channels, indicating that supply and demand may have reached equilibrium after buyers broke through resistance around $3,088 (marked by an arrow).
It is likely that XAU/USD will exhibit low volatility until news about Trump’s tariffs emerges. This could trigger sharp price movements, with a potential test of the purple channel’s boundaries in the near future.
Start trading commodity CFDs with tight spreads. Open your trading account now or learn more about trading commodity CFDs with FXOpen.
This article represents the opinion of the Companies operating under the FXOpen brand only. It is not to be construed as an offer, solicitation, or recommendation with respect to products and services provided by the Companies operating under the FXOpen brand, nor is it to be considered financial advice.
EUR/USD Declines as Markets Await Signals of a Renewed Trade War
The EUR/USD pair continues its gradual decline, erasing its recent technical rebound and retreating to 1.0795. Traders remain cautious as key economic and political developments loom.
Key factors driving the EUR/USD movement
Today (2 April) marks a critical date for global markets as new US tariffs on trading partners take effect. Investors are closely watching for President Donald Trump’s final decision, which could escalate trade tensions.
Earlier, Treasury Secretary Scott Bessent hinted that these tariffs could serve as leverage, pushing partner countries to negotiate lower duties. Meanwhile, recent US economic data has added to the uncertainty:
- Manufacturing activity contracted in March (the first decline of 2025)
- Prices increased for the second consecutive month, reflecting tariff-driven inflationary pressures
- Job openings declined in February, though layoffs remained low, indicating a potential cooling in the labour market
Market focus now shifts to Wednesday’s ADP employment report and Friday’s Non-Farm Payrolls (NFP) data, which will shape expectations for the Fed’s next interest rate decisions.
Technical outlook: EUR/USD
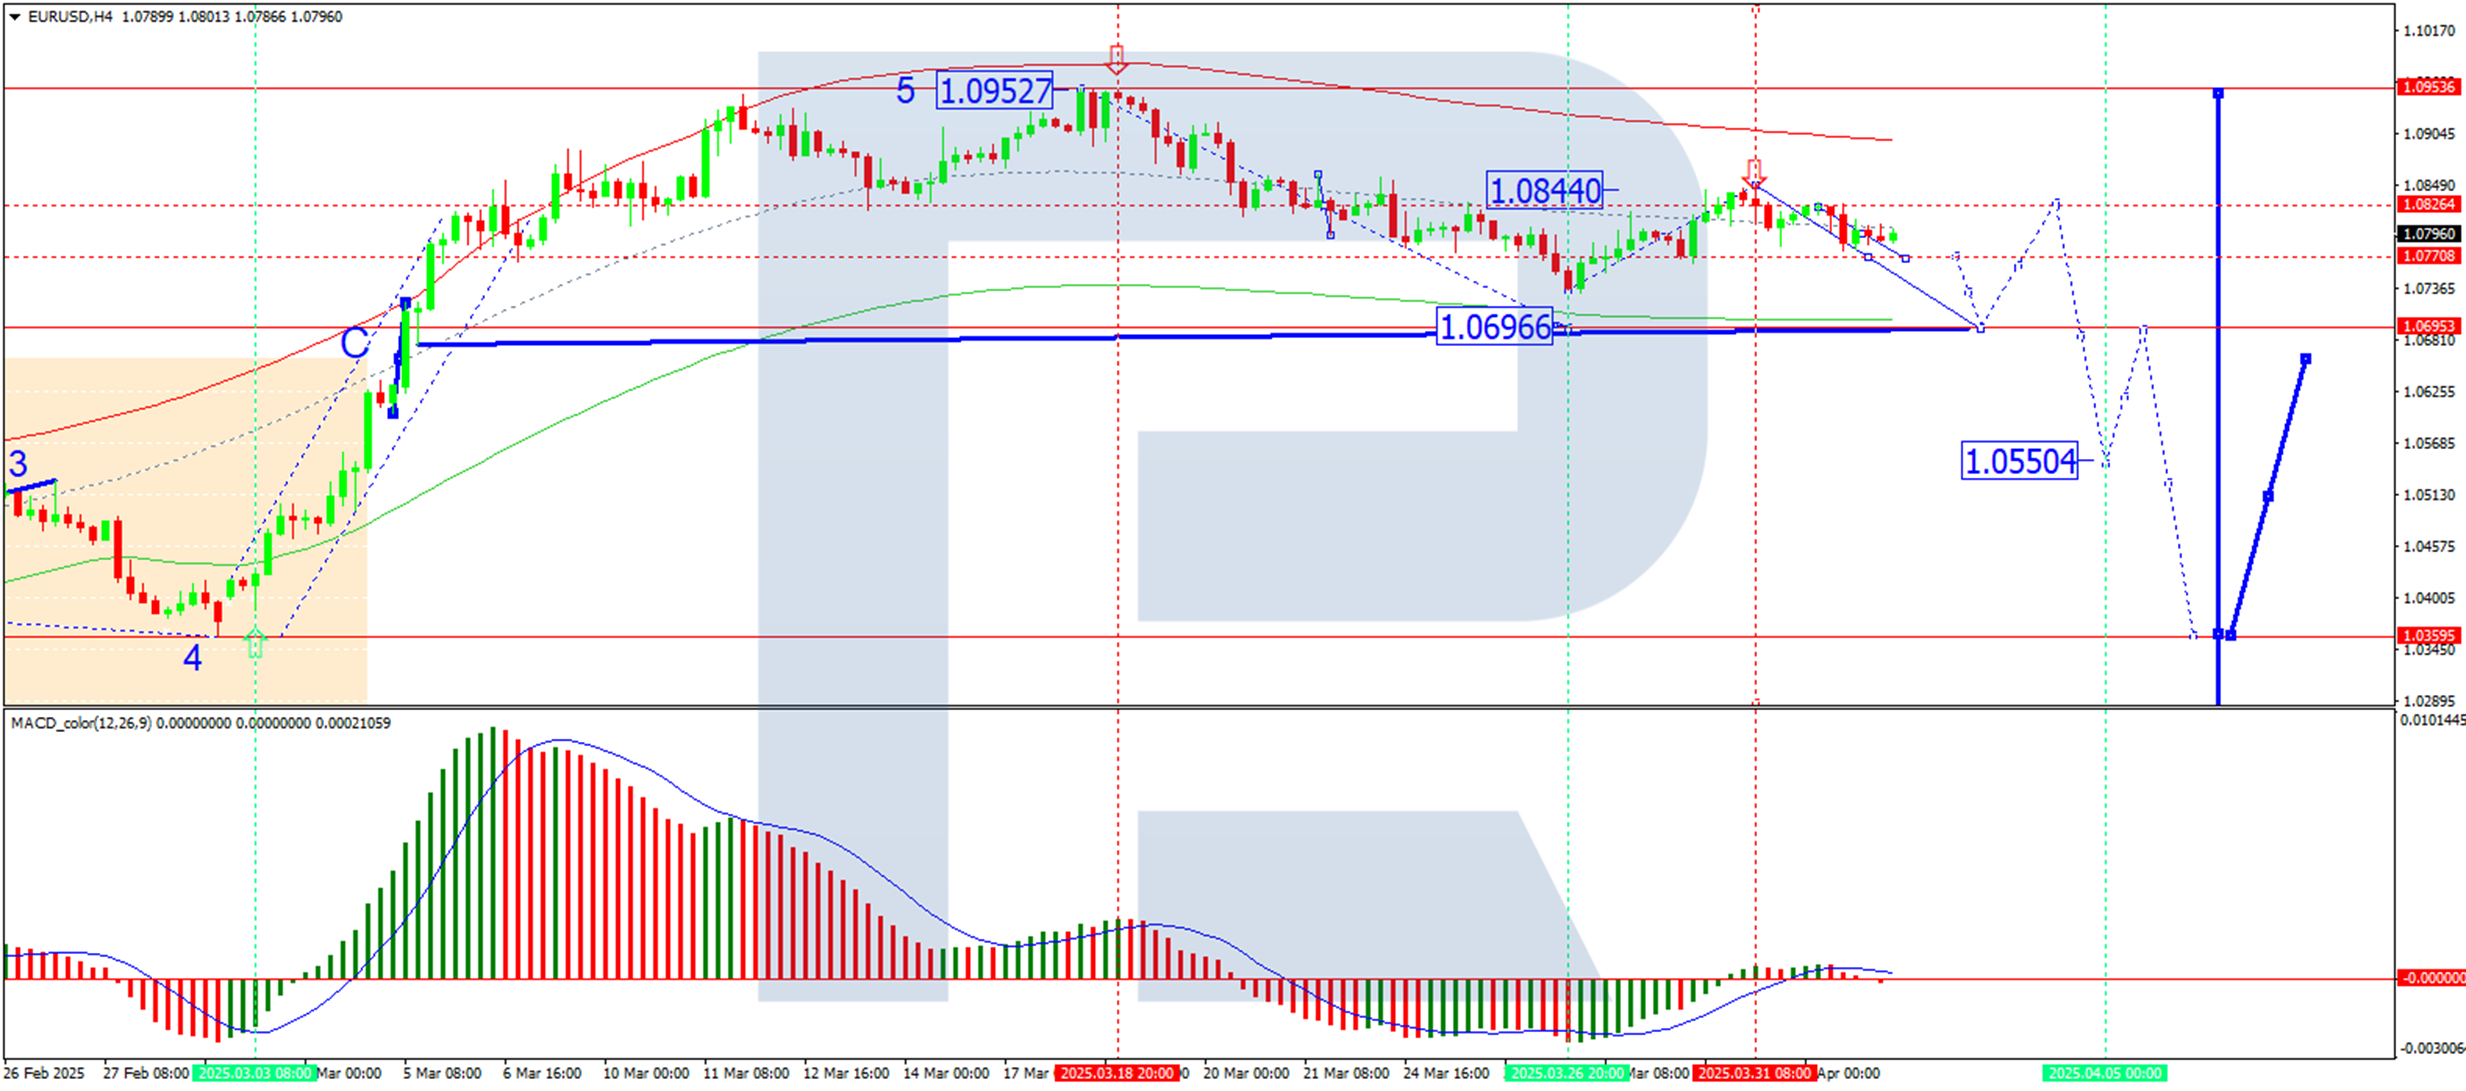
H4 chart analysis
- The pair declined to 1.0784 before correcting to 1.0825
- The next likely move is a continued downward trend towards 1.0695 (first target)
- A pullback to 1.0825 (testing from below) may follow (second target)
- MACD confirmation: the signal line remains below zero, pointing sharply downward and supporting further bearish momentum
H1 chart analysis
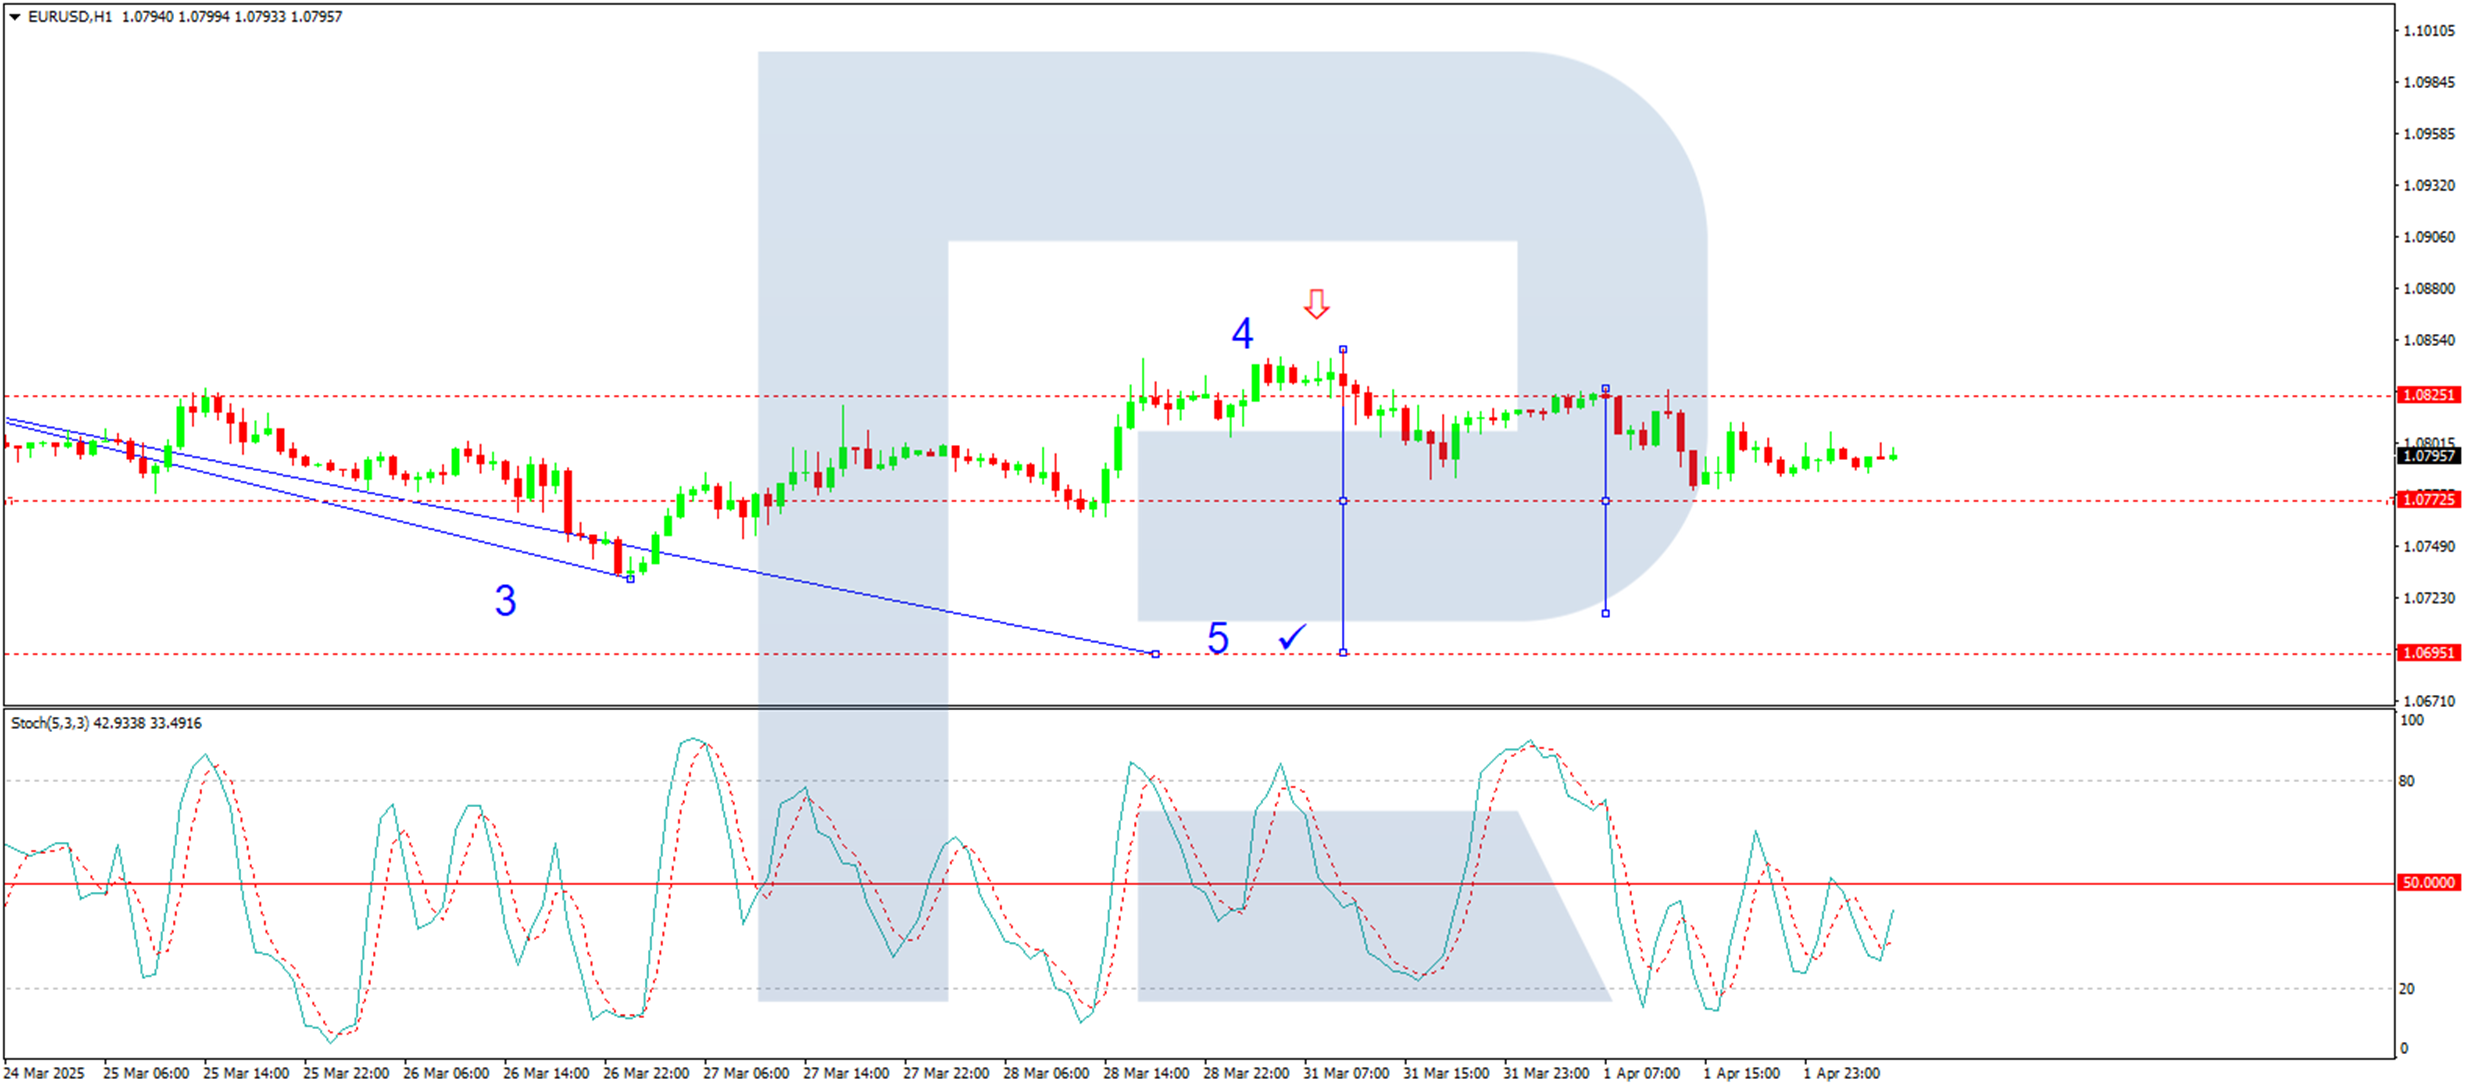
- The pair is forming the fifth leg of a downward wave, targeting 1.0695
- A short-term decline toward 1.0715 is expected today, possibly followed by a correction to 1.0772
- Stochastic oscillator confirmation: the signal line is below 50 and trending downward towards 20, reinforcing bearish momentum
Conclusion
With trade war risks resurfacing and mixed US economic signals, the EUR/USD remains under pressure. A break below 1.0695 could open the door for deeper declines, while a rebound above 1.0825 may signal temporary relief. Traders should monitor US employment data and trade policy updates for fresh directional cues.
GBP/USD Eyes Fresh Gains While USD/CAD Dips
GBP/USD started a fresh increase above the 1.2900 zone. USD/CAD declined and now consolidates below the 1.4350 level.
Important Takeaways for GBP/USD and USD/CAD Analysis Today
- The British Pound is eyeing more gains above the 1.2970 resistance.
- There is a key bearish trend line forming with resistance at 1.2935 on the hourly chart of GBP/USD at FXOpen.
- USD/CAD started a fresh decline after it failed to clear the 1.4415 resistance.
- There was a break below a major bullish trend line with support at 1.4310 on the hourly chart at FXOpen.
GBP/USD Technical Analysis
On the hourly chart of GBP/USD at FXOpen, the pair formed a base above the 1.2870 level. The British Pound started a steady increase above the 1.2900 resistance zone against the US Dollar, as discussed in the previous analysis.
The pair surpassed the 50% Fib retracement level of the downward move from the 1.2972 swing high to the 1.2879 low. The pair is now consolidating near the 1.2925 zone and the 1.2420 level and the 50-hour simple moving average.
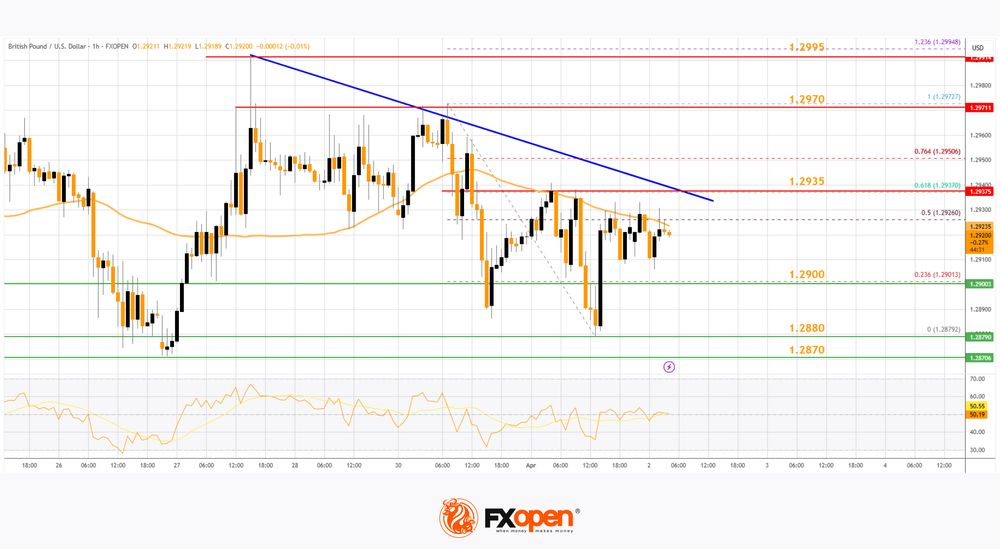
If there is another decline, the pair could find support near the 1.2900 level. The first major support sits near the 1.2880 zone. The next major support is 1.2870.
If there is a break below 1.2870, the pair could extend the decline. The next key support is near the 1.2820 level. Any more losses might call for a test of the 1.2800 support.
Conversely, the bulls might aim for more gains. The RSI moved above the 50 level on the GBP/USD chart and the pair is now approaching a major hurdle at 1.2935 and the 61.8% Fib retracement level of the downward move from the 1.2972 swing high to the 1.2879 low.
There is also a key bearish trend line forming with resistance at 1.2935. An upside break above the 1.2935 zone could send the pair toward 1.2970. Any more gains might open the doors for a test of 1.2995.
USD/CAD Technical Analysis
On the hourly chart of USD/CAD at FXOpen, the pair climbed toward the 1.4420 resistance zone before the bears appeared. The US Dollar formed a swing high near 1.4415 and recently declined below the 1.4350 support against the Canadian Dollar.
There was also a close below the 50-hour simple moving average and 1.4310. There was a break below a major bullish trend line with support at 1.4310.
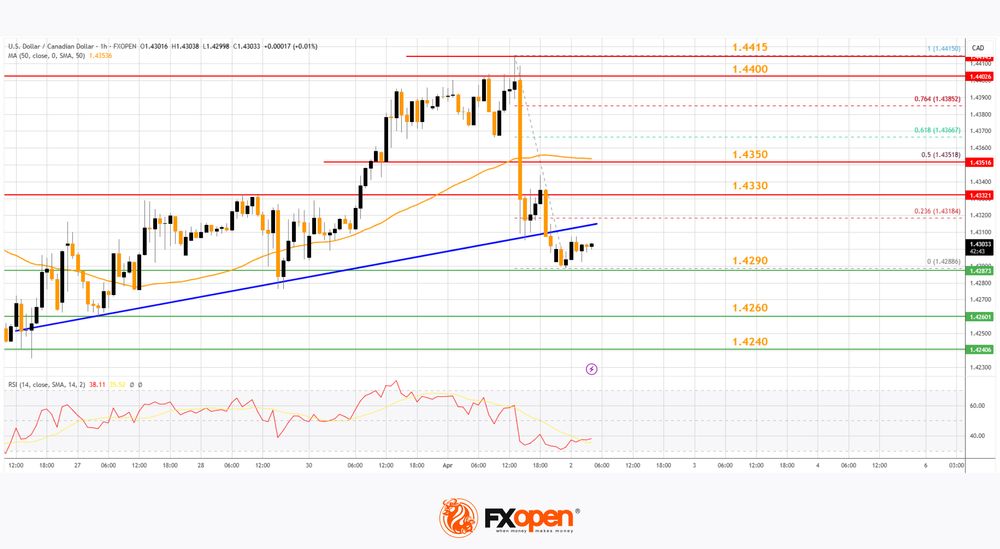
The bulls are now active near the 1.4300 level. The pair is now consolidating losses below the 23.6% Fib retracement level of the downward move from the 1.4415 swing high to the 1.4288 low. If there is a fresh increase, the pair could face resistance near the 1.4330 level.
The next key resistance on the USD/CAD chart is near the 1.4350 level and the 50% Fib retracement level of the downward move from the 1.4415 swing high to the 1.4288 low.
If there is an upside break above 1.4350, the pair could rise toward the 1.4400 resistance. The next major resistance is near the 1.4415 zone, above which it could rise steadily toward the 1.4450 resistance zone.
Immediate support is near the 1.4290 level. The first major support is near 1.4260. A close below the 1.4260 level might trigger a strong decline. In the stated case, USD/CAD might test 1.4240. Any more losses may possibly open the doors for a drop toward the 1.4400 support.
Trade over 50 forex markets 24 hours a day with FXOpen. Take advantage of low commissions, deep liquidity, and spreads from 0.0 pips. Open your FXOpen account now or learn more about trading forex with FXOpen.
This article represents the opinion of the Companies operating under the FXOpen brand only. It is not to be construed as an offer, solicitation, or recommendation with respect to products and services provided by the Companies operating under the FXOpen brand, nor is it to be considered financial advice.
Today’s (Thin) Eco Calendar Obviously Loses Relevance in Anticipation of Tariff Announcement
Markets
Markets remained hesitant throughout European dealings yesterday even as stock markets staged a(n initially) modest comeback. Core bonds continued to excel with April EMU CPI figures strengthening the case for a final 25 bps ECB rate cut (to 2.25%) on April 17 before installing a long pause. Headline and core inflation rose by 0.6% M/M and 1% M/M respectively to 2.2% Y/Y (from 2.3%) and 2.4% (from 2.6%). Numbers were in line or even slightly below consensus. The German yield curve bull flattened with daily changes ranging between -2.6 bps (2-yr) and -6.1 bps (30-yr). The German 10-yr yield tested 2.65% technical support for a second consecutive session. Early US data releases triggered an attempt to add to the risk-off climate, but that move was blocked. The US manufacturing ISM returned to contractionary levels in place since October 2022 after a brief spell of two months above the 50-threshold (49 from 50.3 vs 49.5 expected). Details have the stagflation mark all over them with the contraction in new orders (45.2 from 48.6) and jobs shedding (44.7 from 47.6) accelerating and price pressures mounting (prices paid: 69.4 from 62.4). Not the best start for turning the US back into a global manufacturing powerhouse. US JOLTS job openings fell slightly more than expected (7.57mn from 7.76mn), but hold relatively steady between 7mn and 8mn for already a year now. The US yield curve bull flattened as well with yields ending the day 0.2 bps (2-yr) to 4.7 bps (30-yr) lower. European and US equity markets rebounded slightly over (EU) or slightly under (US) 1%. EUR/USD remains stuck around the 1.08-handle.
Today’s (thin) eco calendar (US ADP employment change) obviously loses relevance in anticipation of the White House’s tariff announcement (event planned between 9-10 pm CET with tariffs said to go into effect immediately). A wait-and-see approach is expected. When it comes to the effective announcement, we think that the worse outcome (highest levels, broad application) might be the best from a market/risk point of view in the mid-to long-term. It reduces the likelihood of a new waiting game (uncertainty) in a step-up tariff approach and an high (tariff) bar can switch the market narrative into (hope) on an easing of protectionist measures in case of successful negotiations (on whatever subject) between nations involved. The immediate market response could still be an adverse one of course with (long-term) bonds at risk of selling off because of the highest impact on short-term inflation. Despite the correction of the past two weeks, we stick to our long term (bearish) curve steepeners. On FX markets, a (US) stagflation narrative so far tended to work in the USD’s disadvantage.
News & Views
South-Korean inflation unexpectedly reaccelerated in March. Headline inflation rose by 0.2% M/M and 2.1% Y/Y while a slowdown to 1.9% was expected. Core inflation (ex-food and energy also rose slightly to 1.9% from 1.8%. Food prices (0.6% M/M and 2.4% Y/Y) were an important driver behind the acceleration. In a monthly perspective prices of education rose by 1.1%. Restaurants/hotels and miscellaneous good and services added 0.4% M/M. Transportation costs declined (0.4% M/M). Service prices rose 2.3% Y/Y. Goods prices added 1.7%. The Bank of Korea further reduced its policy rate by 25 bps to 2.75% in February. Next meetings are scheduled for April 17 and May 29. The weak won is at least partially responsible for the easing of inflation to slow down. Today’s data reinforce the case for the Bank of Korea to take a wait-and-see modus at the April meeting. Later, the BoK can reassess whether there is room/need to further support the economy.
The Mexican government downwardly revised its growth forecast for this year to a range of 1.5%-2.3% down from a prior forecast of 2%-3%. The government indicates that the decline is due to economic uncertainty, weaker residential investment and supply shocks that have hit the economy. Business caution driven by uncertainty over US trade policy is also a contributing factor. The assessment of the government is still far more optimistic than private sector estimates and projections from the central bank. The latter sees 2025 growth at 0.6%. The government sees inflation at 3.5% at the end of the year before returning to the central bank target of 3.0% (+/- 1.0%) next year. The Mexican peso in April last year touched the strongest level against the dollar since 2015 (near USD/MXN 16.26), but currently trades near MXN/USD 20.35.
GBP/JPY Daily Outlook
Daily Pivots: (S1) 192.40; (P) 193.17; (R1) 194.13; More...
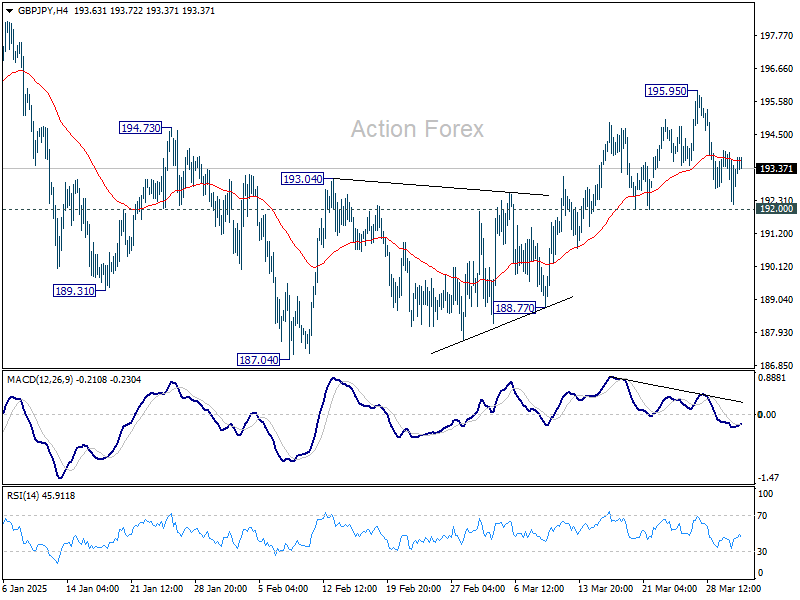
Intraday bias in GBP/JPY stays neutral as range trading continues. On the upside, break of 195.95 will extend the rally from 187.04 once again, to 198.94 resistance. However, firm break of 192.00 support will turn bias back to the downside for deeper fall. Overall, corrective pattern from 180.00 is still extending.
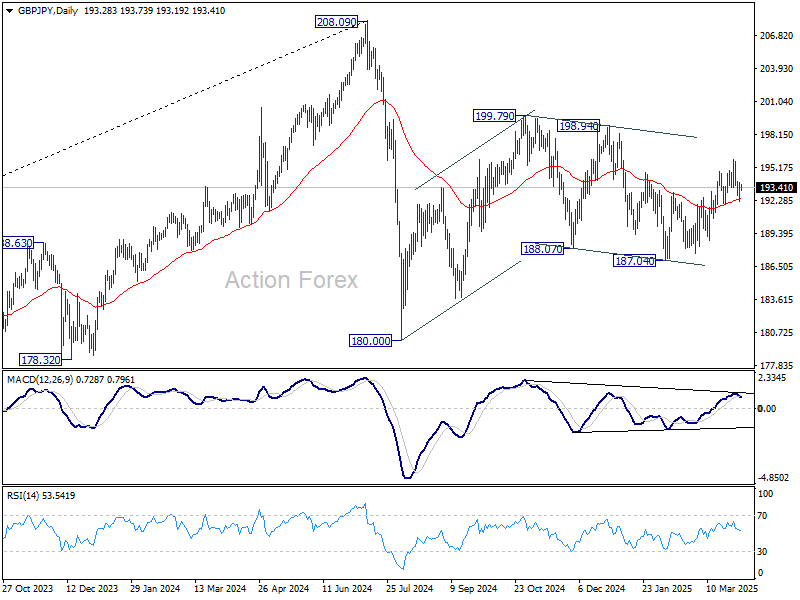
In the bigger picture, price actions from 208.09 are seen as a correction to rally from 123.94 (2020 low). Strong support should be seen from 38.2% retracement of 123.94 to 208.09 at 175.94 to contain downside. However, sustained break of 152.11 will bring deeper fall even still as a correction.
EUR/JPY Daily Outlook
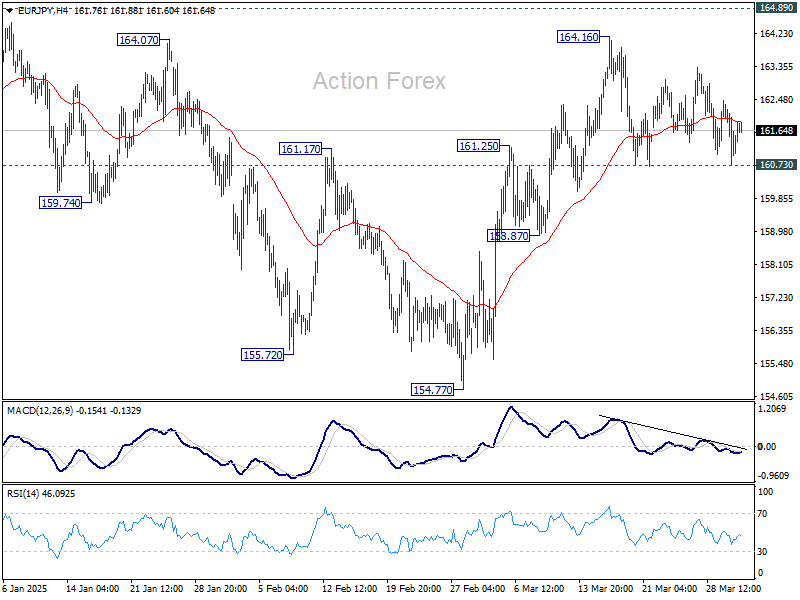
Daily Pivots: (S1) 160.72; (P) 161.55; (R1) 162.33; More...
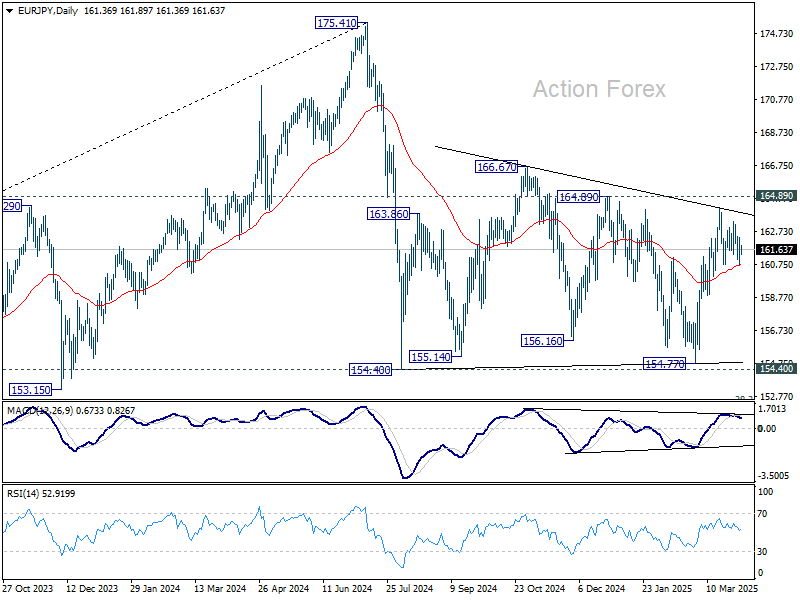
Intraday bias in EUR/JPY remains neutral for the moment. Further rise is in favor as long as 160.73 support holds. Above 164.16 will resume the rally from 154.77 to 164.89 resistance, and then 166.67. However, break of 160.73 will turn bias back to the downside for 158.87 support and below. Overall, sideway consolidation pattern from 154.40 is still extending.
In the bigger picture, price actions from 175.41 are seen as correction to rally from 114.42 (2020 low). Strong support should be seen from 38.2% retracement of 114.42 to 175.41 at 152.11 to contain downside. However, sustained break of 152.11 will bring deeper fall even still as a correction.
EUR/GBP Daily Outlook
Daily Pivots: (S1) 0.8341; (P) 0.8360; (R1) 0.8370; More...
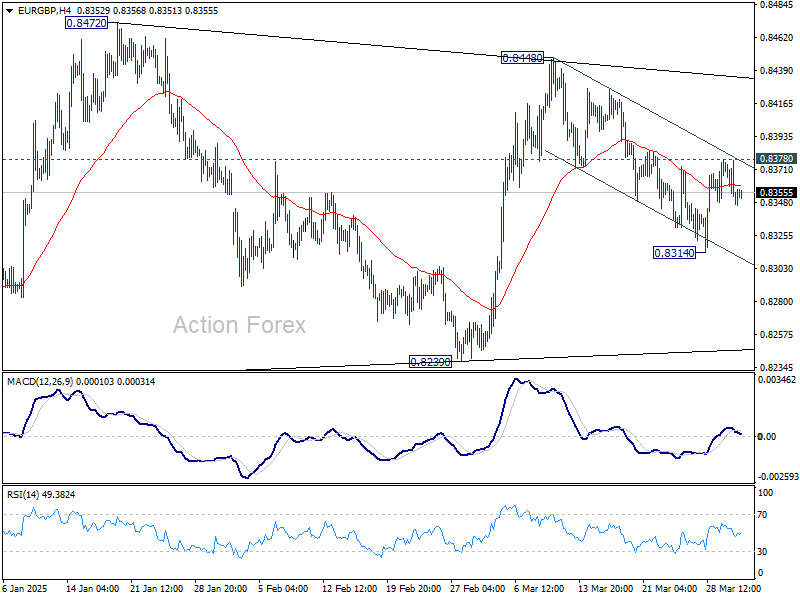
Intraday bias in EUR/GBP remains neutral for the moment. With the near term falling channel intact, deeper fall is mildly in favor. Break of 0.8314 will resume the decline from 0.8448 towards 0.8239 support. Nevertheless, firm break of 0.8379 will argue that fall from 0.8448 is merely a correction and has completed. Retest of 0.8448 should be seen next.
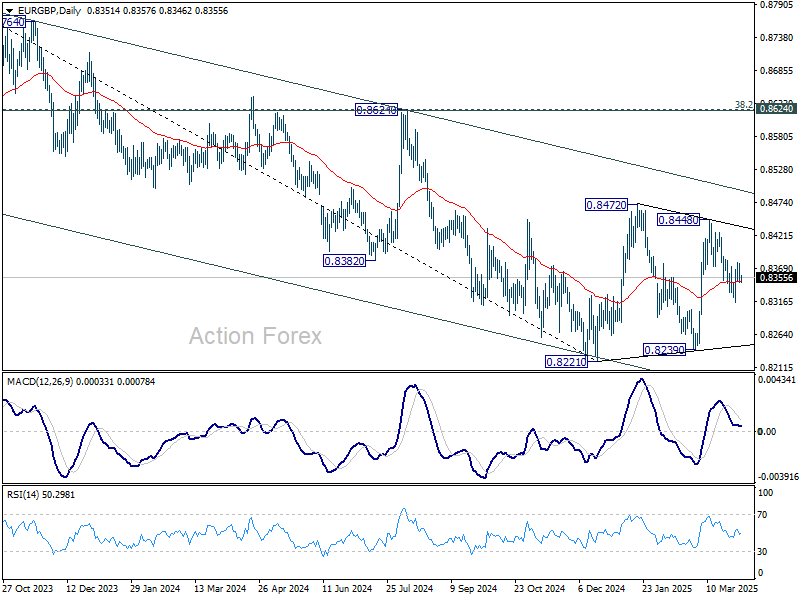
In the bigger picture, EUR/GBP is still bounded inside medium term falling channel. While rebound from 0.8221 might extend higher, it could still develop into a corrective pattern. Overall outlook will be neutral at best and down trend from 0.9267 (2022 high) could extend, at least until decisive break of channel resistance (now at 0.8495).
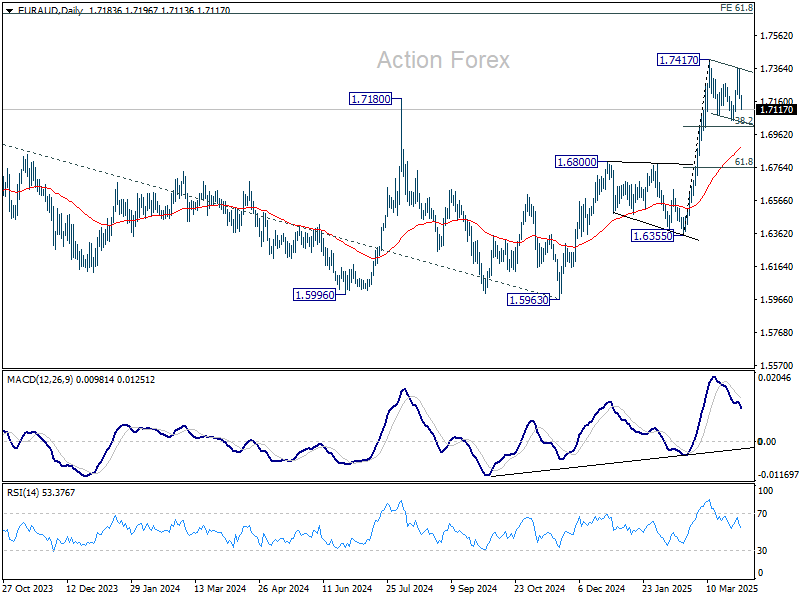
EUR/AUD Daily Outlook
Daily Pivots: (S1) 1.7129; (P) 1.7247; (R1) 1.7310; More...
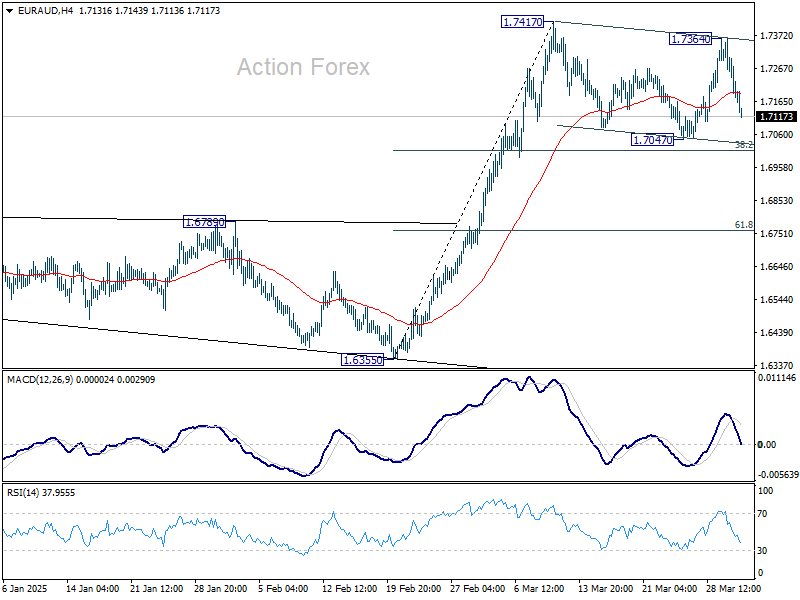
Current steep decline suggests that corrective pattern from 1.7417 is extending with another falling leg. Intraday bias is turned neutral first. Downside should be contained by 38.2% retracement of 1.6355 to 1.7417 at 1.7011 to bring rebound. On the upside, break of 1.7364 will suggest that larger up trend is ready to resume. However, firm break of 1.7011 will bring deeper correction to 55 D EMA (now at 1.6888).
In the bigger picture, up trend from 1.4281 (2022 low) is resuming and should target 61.8% projection of 1.4281 to 1.7062 from 1.5963 at 1.7682, which is also close to 61.8% retracement of 1.9799 (2020 high) to 1.4281 at 1.7691. For now, this will remain the favored case as long as 1.6800 resistance turned support holds, even in case of deep pullback.