Sample Category Title
‘Liberation Day’ Tariffs: Potential Impact on Dow Jones (DJIA), S&P 500
- The Trump administration's tariff plans are here, what will the implications be for the S&P and Dow Jones?
- Technology companies in the S&P 500, like Apple and Microsoft, are particularly vulnerable to tariffs due to their reliance on non-US markets.
- Analysts expect protracted negotiations regarding tariffs, leading to continued market fluctuations.
- Despite the uncertainty, the S&P 500 historically performs well in April, offering a potential silver lining.
Wall Street Indexes have seen a mixed bag today with wild swings between gains and losses. Market participants moved closer to understanding the Trump administration's tariff plans on Wednesday, but with few details available, financial markets stayed unpredictable.
There have been a host of rumors filtering through throughout the day with some suggesting President Trump's Tariffs will be banned 10%, 15% and 20% depending on country and by industry.
Tariffs could greatly impact corporate profits, global growth, inflation, and Federal Reserve interest rate decisions.
At the start of the year, investors were optimistic about the Trump administration's pro-growth policies, but a flood of tariff-related news has shaken their confidence.
While most agree that Wednesday's much-anticipated announcement could be key to the short-term direction of global markets, there’s uncertainty about how prices will move and what might happen next, as negotiations could drag on.
Which stocks are most vulnerable to tariffs?
Companies that make up the S&P 500 generate about 40% of their revenue outside of the United States. This leaves Wall Street exposed to potential trade wars that hamper the free flow of goods and services.
S&P 500 technology companies such as Apple, Microsoft and NVIDIA rely on non-US markets for over half their sales. Given the poor performance by some of them so far in 2025, caution appears to be the only game in town.
Meanwhile the sectors that appear the least exposed to a potential trade war include real estate and utility companies who receive only a small amount of revenue from non-US sources.
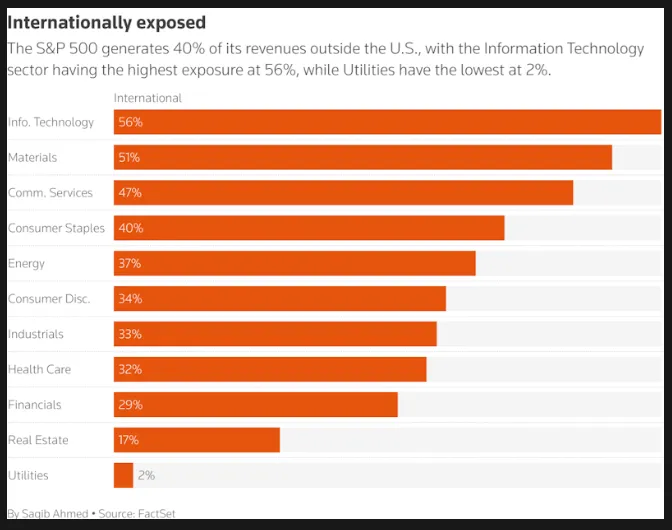
Source: LSEG
We have heard comments from CEOs across various sectors in recent weeks warning about potential price increases being passed onto the consumer. This does not bode well for the US either. There is a notable split and in my opinion a clear lack of understanding by many politicians as to how tariffs may impact the everyday American as well as consumers in other countries.
What can we expect moving forward?
There does seem to be a lot of conflicting views as to how markets may shape up tomorrow and the days ahead. However, the one area analysts seem to agree on is that today's announcement is just the beginning with most expecting protracted negotiations moving forward.
The possible outcomes can be seen as good, bad, or very bad. A good outcome would be fewer tariffs or ones that are more focused and balanced.
The announcement comes at a critical time for the S&P 500 after it confirmed a correction by dropping as much as 10% since mid February highs.
Looking for a reason to be optimistic around the S&P 500 and there may be a silver lining. Historically, the S&P 500 has performed well in April, averaging gains of over 2% since 1950 when starting below its 200-day moving average. Given the positive start to April however, the S&P 500 is already up around 0.80% at the time of writing.
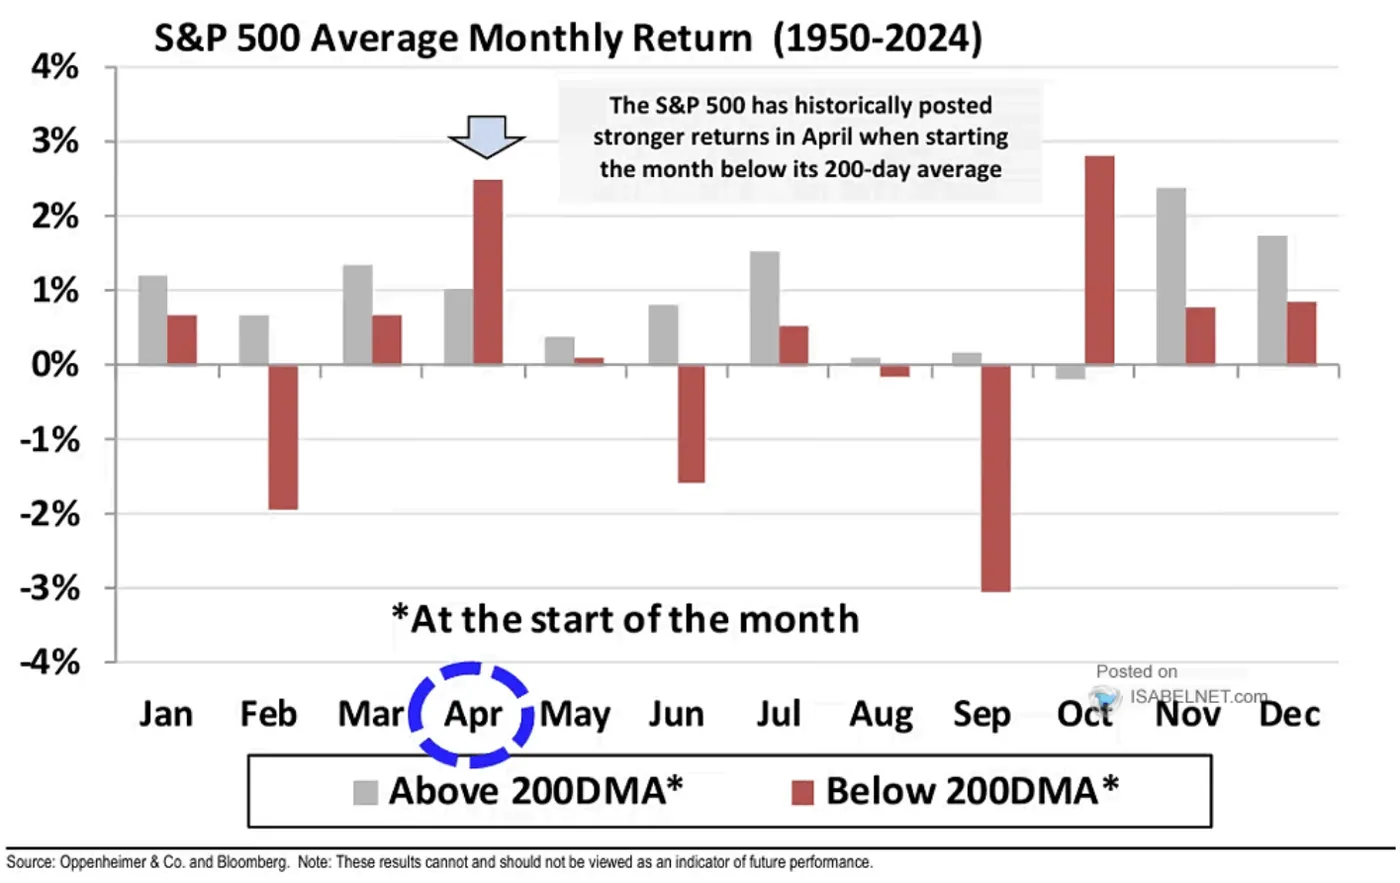
Source: Isabelnet, Bloomberg
Technical Analysis - Dow Jones
From a technical standpoint, the Dow Jones has enjoyed a positive start to the month but today's whipsaw price action does not bode well.
Given that markets are expecting negotiations post the tariff announcements today, markets could be set for more uncertainty and thus more whipsaw price action in the days ahead.
The Dow is hanging between two key levels having tested both today with immediate resistance resting at 42446 and support at 41950.
A move beyond 42446 brings the 42764 and 43402 handles into focus.
A move lower from here and 41400 and 40000 will become key areas of concern.
For now though, committing to a direction seems foolish even though the recent correction may look like a good opportunity for buyers, there is a chance that more downside may be in store for the Dow and other Wall Street indexes.
Dow Jones (US30) Daily Chart, April 2, 2025
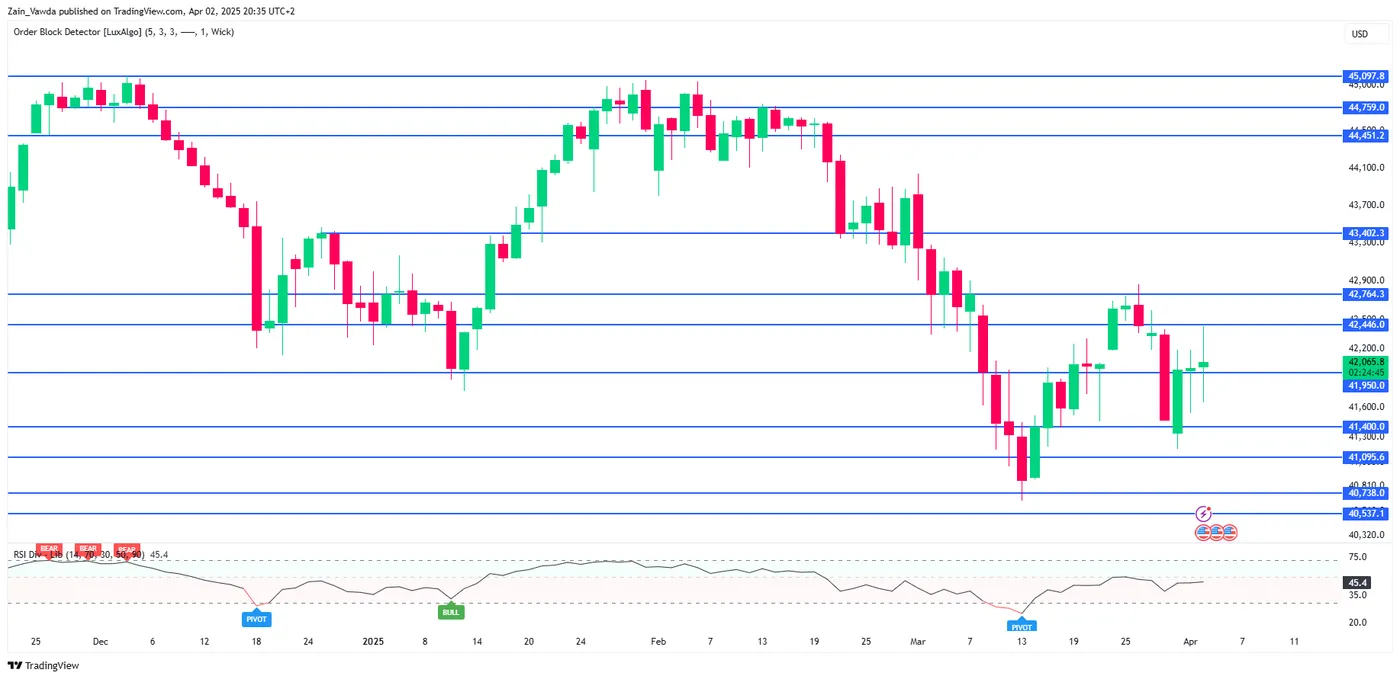
Source: TradingView (click to enlarge)
Support
- 41950
- 41400
- 40000
Resistance
- 42446
- 42764
- 43402
CAD/JPY Outlook: Deterioration in US Growth and Tariff Risk May Spark Another Round of Yen Strength
- An increasing probability of stagflation risk in the US may see further narrowing of the 2-year sovereign yield premium spread between US Treasuries and JGBs.
- CAD/JPY is the second worst-performing major yen crosses in the past three months.
- CAD/JPY may see another round of impulsive down move sequence with the following medium-term supports coming in at 99.60 and 97.55.
This is a follow-up analysis of our prior report “CAD/JPY Technical: Trump’s shock and awe trade policy manoeuvre erased CAD gains” published on 21 January 2025.
Since the publication of our prior analysis, the price actions of CAD/JPY have declined by 6.6% to print a low of 101.38 on 11 March 2025, which hit the first medium-term support of 101.80 mentioned in our earlier report.
Thereafter, it recorded a bounce of 4.4% to print a recent high of 105.87 on 26 March ahead of US President Trump’s 2 April “Liberation Day” announcement of reciprocal trade tariffs. Canada has already been hit with 25% tariffs on certain goods.
Even though the Canadian industry has been left unscathed from the US reciprocal trade tariffs announced on 2 April, Canada will still be hit with the universal 25% automobile tariffs that is taking effect today, 3 April, with other sectorial/industrial tariffs such as lumber to be enacted by the US White House soon.
Several yen crosses have started to show weakness
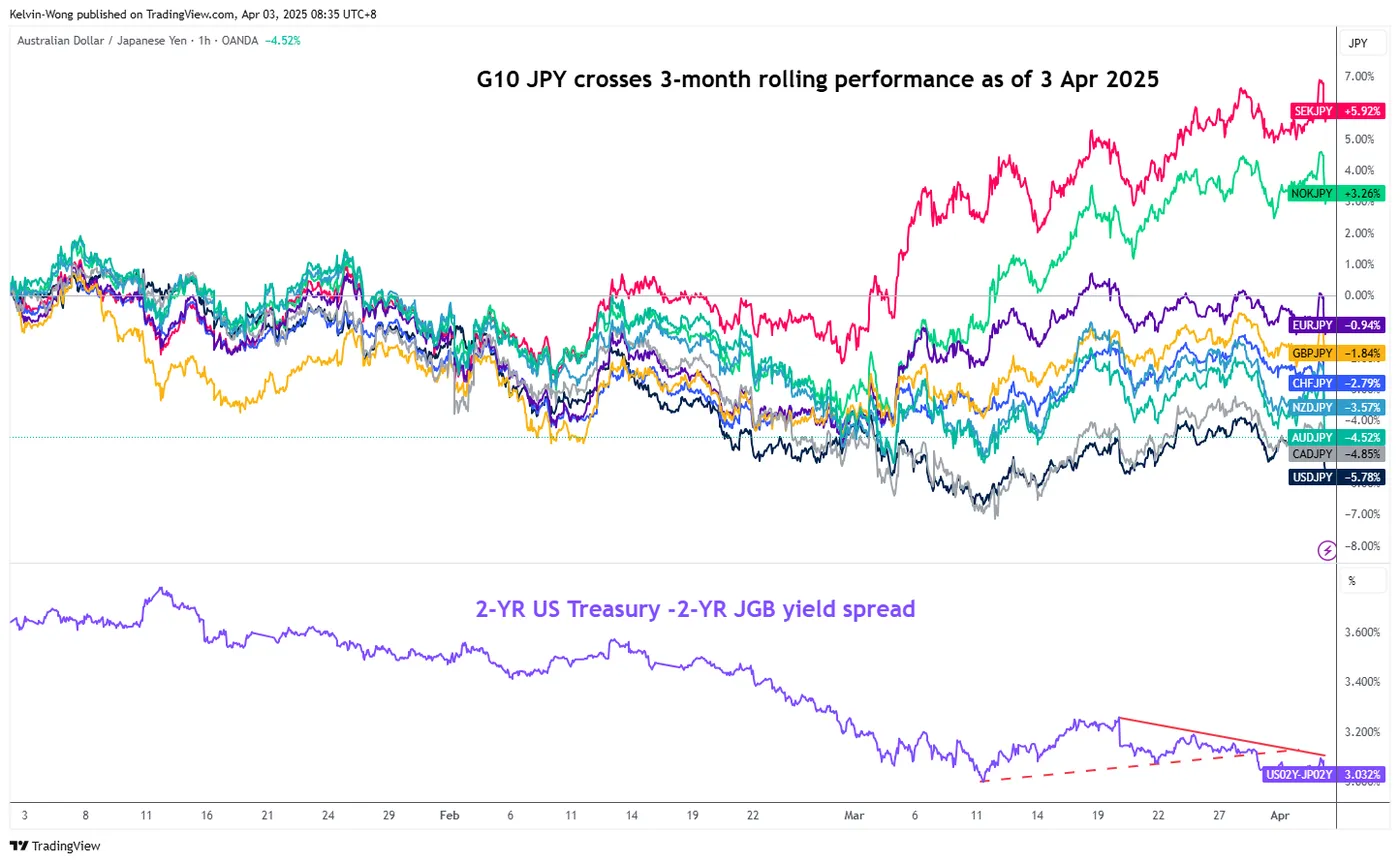
Fig 1: 3-month rolling performance of G-10 JPY crosses with 2-year US Treasury/JGB yield spread as of 3 Apr 2025 (Source: TradingView)
Weakness in several major G-10 yen crosses has resurfaced for the past week, driven by a narrowing of the 2-year sovereign yield premium spread between US Treasuries and Japanese Government Bonds (JGBs), and rising systematic risk from US trade tariffs woes.
Based on a rolling three-month performance as of 3 April, the CAD/JPY is the second-worst performing (-4.9%) major yen cross pair, just hovering above the worst hit USD/JPY (-5.8%) at this time of the writing (see Fig 1).
Stagflation risk in the US may reinforce further yen strength
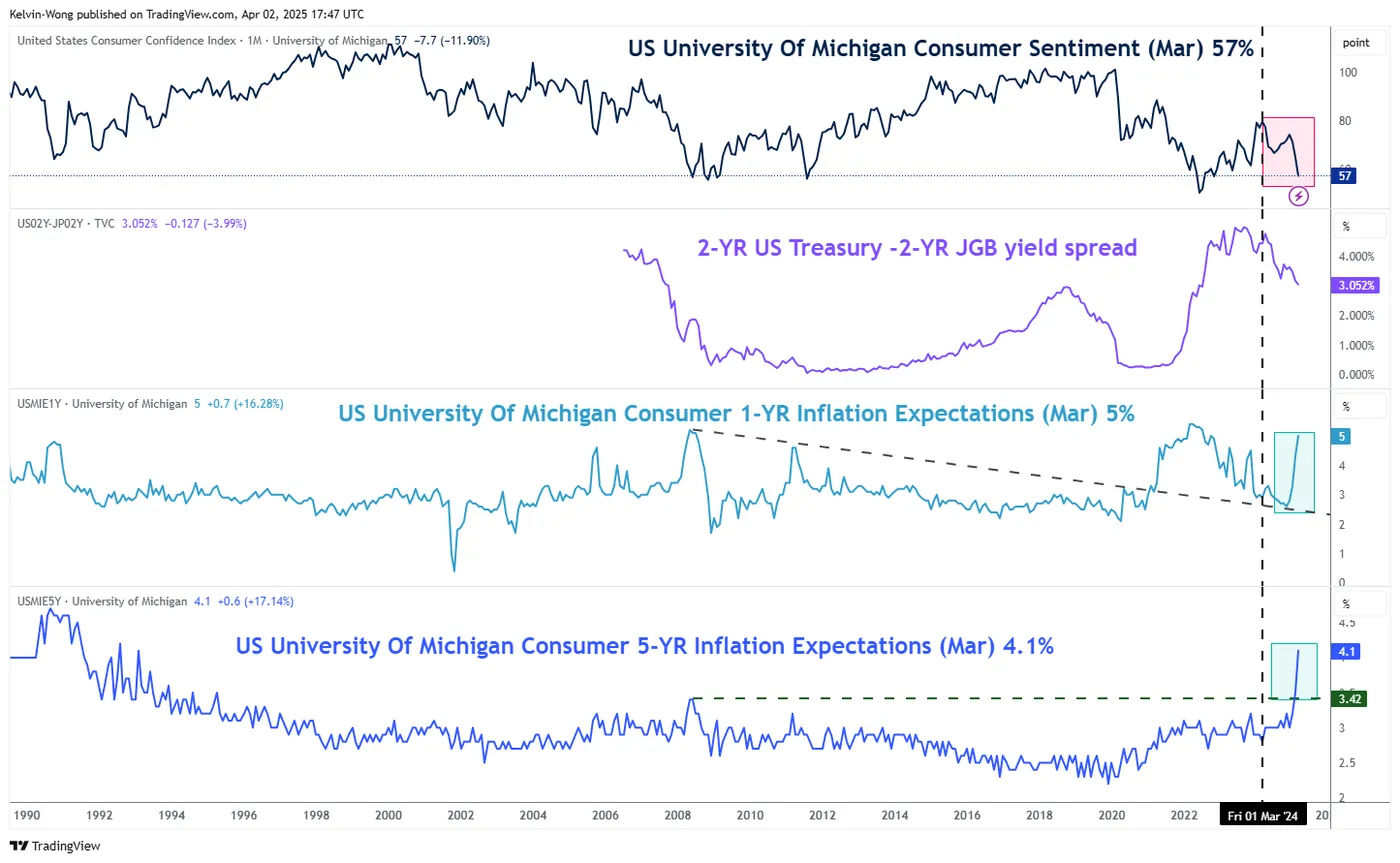
Fig 2: University of Michigan Consumer Sentiment Index with inflation expectations as of Mar 2025 (Source: TradingView)
The latest finalised University of Michigan Consumer Sentiment Index for March has plummeted to 57 from its prior month reading of 64.7. Consumer sentiment in the US declined for a third consecutive month to hit the lowest since November 2022.
In addition, in the same survey report, both the 1-year and 5-year inflation expectations soared significantly, with the 5-year forward-looking inflation gauge soaring to a 32-year high of 4.1% in March.
These recent observations suggest a rising risk of stagflation in the US economy due to uncertainties in growth prospects and the cost of living, which are exacerbated by the current US White House's erratic and aggressive trade tariff policy.
An increasing probability of a stagflation environment may see a further narrowing of the 2-year sovereign yield premium spread between US Treasuries and JGBs as US economic growth and corporate earnings get revised downwards, in turn, benefiting the yen that takes up the role as a currency hedge (see Fig 2).
CAD/JPY’s bearish reaction below its 50-day moving average
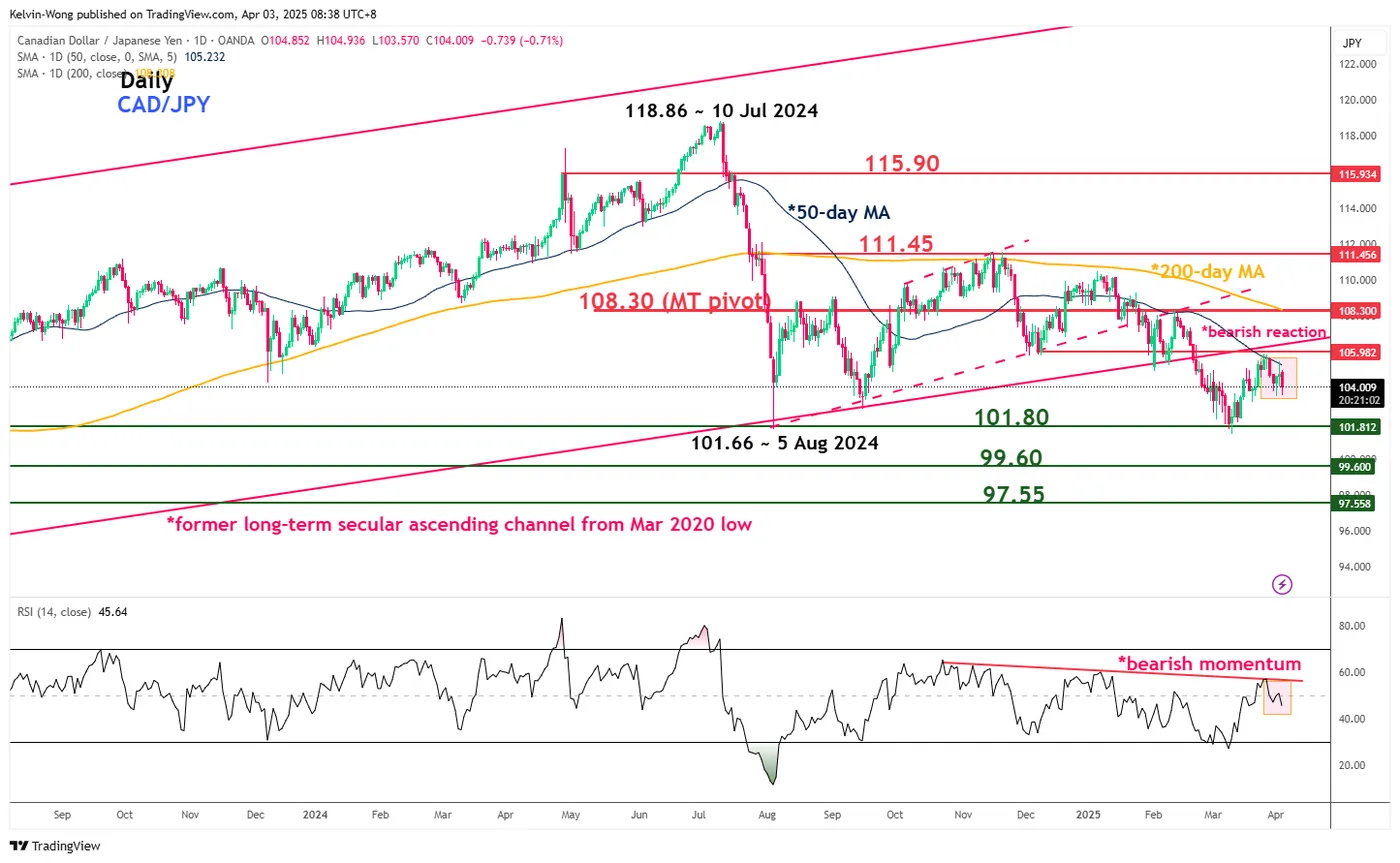
Fig 3: CAD/JPY major & medium-term trends as of 3 Apr 2025 (Source: TradingView)
The recent corrective rebound of the CAD/JPY from its 11 March low may have reached its terminal point on 26 March as price actions of the CAD/JPY have shaped a bearish reaction candlestick after a retest on its downward sloping 50-day moving average, and the former long-term secular ascending channel from the March 2020 low now turns into a pull-back resistance after price actions breached below it on 21 February 2025 (see Fig 3).
In addition, the daily RSI momentum indicator has flashed out a bearish momentum condition which supports the start of a potential impulsive down move sequence.
Watch the 108.30 key medium-term pivotal resistance (also the 200-day moving average), and a break below 101.80 exposes the next medium-term supports at 99.60 and 97.55.
On the other hand, a clearance above 108.30 invalidates the bearish scenario for the next medium-term resistances to come in at 111.45 and 115.90 next.
Silver Wave Analysis
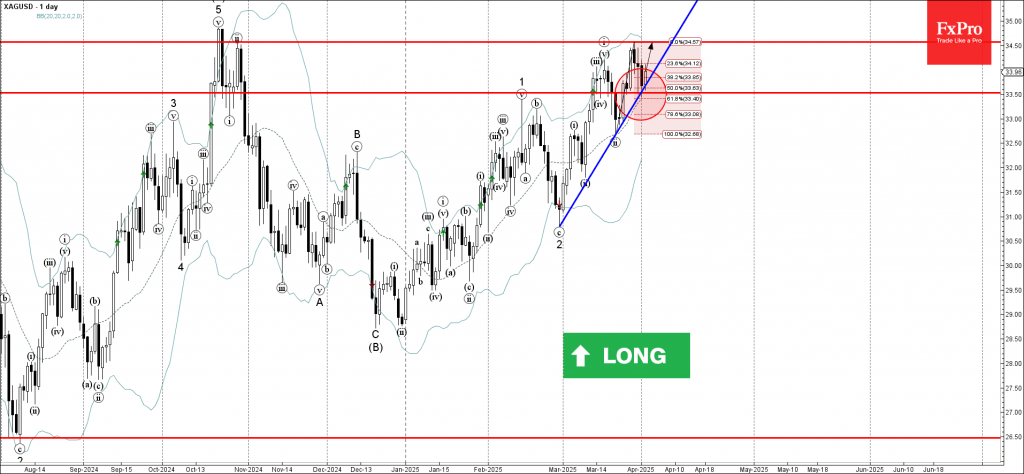
Silver: ⬆️ Buy
- Silver reversed from the support area
- Likely to rise to the resistance level 34.50
Silver recently reversed up from the support zone between the support level 33.50 (former monthly high from February), 20-day moving average, support trendline from February and the 50% Fibonacci correction of the upward impulse from March.
The upward reversal from this support area continues the active impulse waves iii, 3 and (C) – inside which Silver has been moving since December.
Given the strong daily uptrend, Silver can be expected to rise to the next resistance level 34.50 (the former monthly high from last month).
AUDCHF Wave Analysis
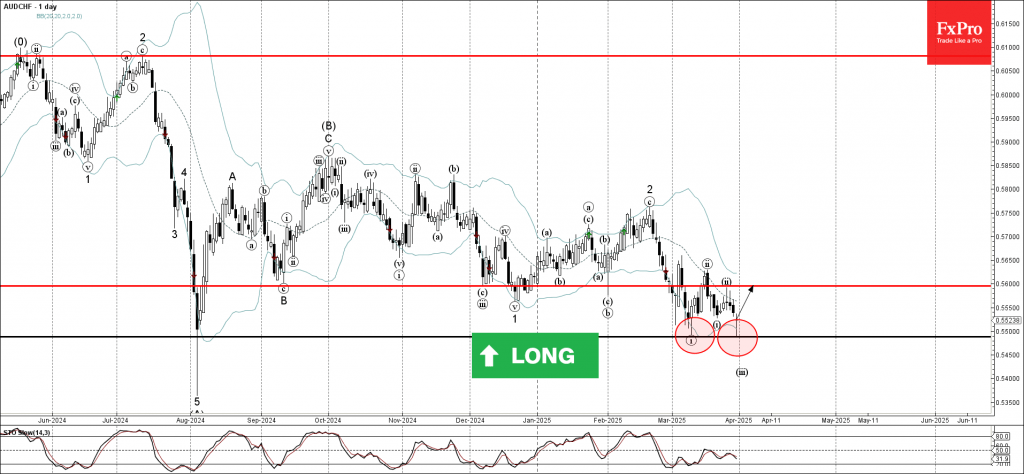
AUDCHF: ⬆️ Buy
- AUDCHF reversed from the support area
- Likely to rise to resistance level 0.5600
AUDCHF currency pair recently reversed up from the support area between the pivotal support level 0.5485 (which stopped the earlier impulse wave i at the start of March) and the lower daily Bollinger Band.
The upward reversal from this support area formed the daily Japanese candlesticks reversal pattern Hammer Doji.
Given the bullish divergence on the daily Stochastic indicator, AUDCHF currency pair can be expected to rise to the next resistance level 0.5600 (top of the previous correction ii).
EURNZD Wave Analysis
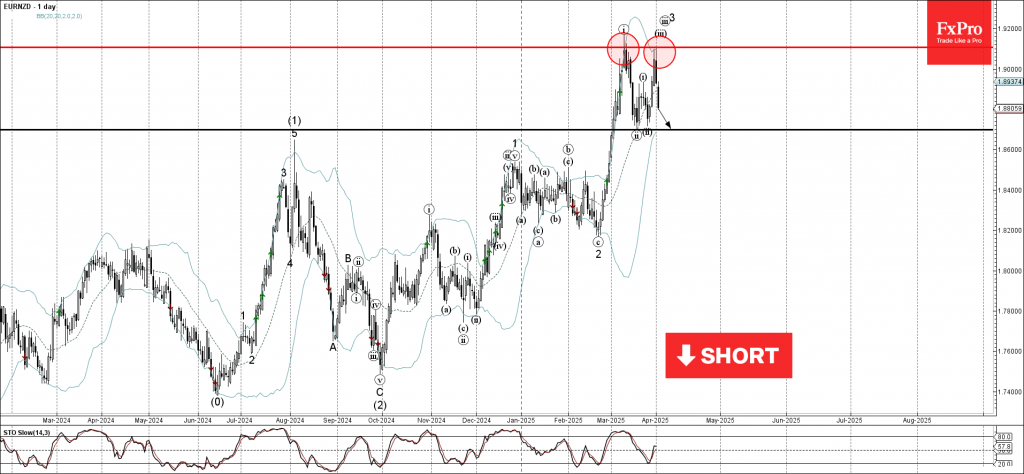
EURNZD: ⬇️ Sell
- EURNZD reversed from resistance area
- Likely to fall to support level 1.8700
EURNZD currency pair recently reversed down from the resistance area located between the resistance level 1.9100 (which stopped the earlier sharp upward impulse wave I at the start of March) and the upper daily Bollinger Band.
The downward reversal from this resistance area stopped the earlier short-term impulse wave iii of the upward impulse wave 3 from the end of February.
Given the strength of the resistance level 1.9100, EURNZD currency pair can be expected to fall to the next support level 1.8700.
USD/JPY: Pressure Lower Boundary of Near-Term Range Ahead of Tariff Announcement
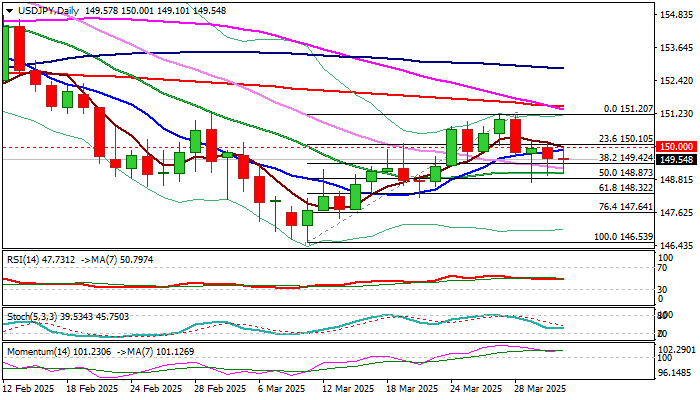
USDJPY remains at the back foot on Wednesday and dips further below 150 level, which reverted to solid resistance (three consecutive attacks stalled here).
Fresh weakness pressures 20DMA (149.06, where bears faced strong rejections in past two days) which offers good support, along with nearby 50% retracement of 146.53/151.20 upleg (148.87).
Rising risk aversion ahead of tonight’s tariff decision continues to underpin demand for safe haven Japanese yen.
The pair is likely to accelerate lower if President Trump opts for implementation of full package of import tariffs, which would escalate trade war and further destabilize already fragile conditions in the global economy.
Sustained break of 149.06/148.87 to confirm an end of corrective phase (146.32/151.20) and expos targets at 148.32 and 147.64 (Fibo 61.8% and 76.4% respectively).
Strong barriers at 150.00 (psychological/10DMA) should keep the upside protected and maintain bearish bias, while firm break higher would be a game changer.
Res: 150.00; 150.26; 151.00; 151.38.
Sup: 149.06; 148.87; 148.32; 148.00.
Sunset Market Commentary
Markets
US President Trump has been keeping the market in extreme suspense the last few weeks and especially days with what he calls “the Big One”. That’s referring to a major tariff policy plan that almost certainly trumps all the levies POTUS already introduced earlier this year. The big unveil is almost there and markets are anxious to know the outcome. And yet, mere hours before “Liberation day” there are a lot of unknowns that reportedly are still being discussed as we write. Proposals floated by the media include a tiered system with a flat 10% or 20% rate for all countries as well as a more customized reciprocal plan but with unspecified tariff levels. The baseline is to “[We] charge them what they charge us” but Trump said they’ll look beyond the obvious tariff barriers that certain countries have in place to include non-tariff barriers as well. He has for example lashed out at Europe’s VAT system which he says favours domestic companies over foreign (ie US) ones. It’s also unclear what countries the Trump administration plans to target with the scope most likely broader than just countries having a trade surplus with the US. Lastly, we don’t know whether the tariffs are scheduled to kick in immediately (according to the White House press secretary Leavitt’s “understanding”) or if there’s still some time for negotiations to try to avoid them. Finally having answers, however bad they sound, could ironically bring some relief after an initial Pavlov risk off market reaction.
Going into the announcement, markets understandably err to the side of caution regardless of solid but second-tier US data. The unofficial jobs report from ADP printed a 155k employment growth in March, picking up from 84k and beating the 120k consensus. “Despite policy uncertainty and downbeat consumers, the bottom line is this: The March topline number was a good one for the economy and employers of all sizes, if not necessarily all sectors.” ADP’s chief economist summarized. Stocks in Europe decline about 1%, Wall Street opens between 0.7-1.2%. Core bonds get a nice bid with safe haven flows pushing US Treasury yields down between 2.1-3.8 bps across the curve. The German curve bull flattens with euro area money markets pricing in the lowest end-of-year ECB policy rate (+/- 1.75%) since early February. Net daily changes amount to -0.8 to 2.8 bps. Currency markets disconnect from the typical risk aversion though with especially a lackluster dollar catching the eye. A growing stagflationary narrative has been weighing down on the greenback and tariffs are obviously not soothing any of the concerns. DXY revisits 104, EUR/USD tops 1.08(2). A strong outperformance by FX Down Under and high up north is (again) striking. EUR/SEK hits a new 2.5 year low around 10.74.
News & Views
The Hungarian debt agency (AKK) updated its 2025 funding plan. At the end of Q1, they completed 38% (HUF 4378bn) of the planned yearly gross issuance which was raised from HUF 10 096bn to HUF 12 503bn. For the remainder of the year, AKK plans to increase institutional government auctions, while lowering the expected net financing from households. The planned volume for HGB auctions increases from HUF 4742bn to HUF 5151bn. Tenorwise, AKK wants to focus more on 5-yr bonds and less on 10-yr bonds as per investor demand. Net retail financing decreases by the same HUF 408bn, from HUF 1323bn to HUF 915bn. The average term-to-maturity of Hungarian central government debt is 5.6 years, 4.2 years in case of HUF debt and 8.7 years in case of FX debt. The FX debt share will decrease below 30% by the end of the year from 30.3% currently. AKK plans some final FX-issuance (90% already covered) later this year in the Chinese markets.
The Czech Statistical Office announced that the government deficit decreased from 3.7% of GDP in 2023 to 2.2% of GDP in 2024. In nominal terms, the deficit amounted CZK 177.2bn. In the YoY-comparison, total revenue, of which mainly received social contributions, was increasing more (+6.8% YoY) than the expenditure (+2.9% YoY). The government debt ratio increased from 42.5% of GDP to 43.6% or CZK 3492.2bn in nominal terms.
EUR/USD Mid-Day Outlook
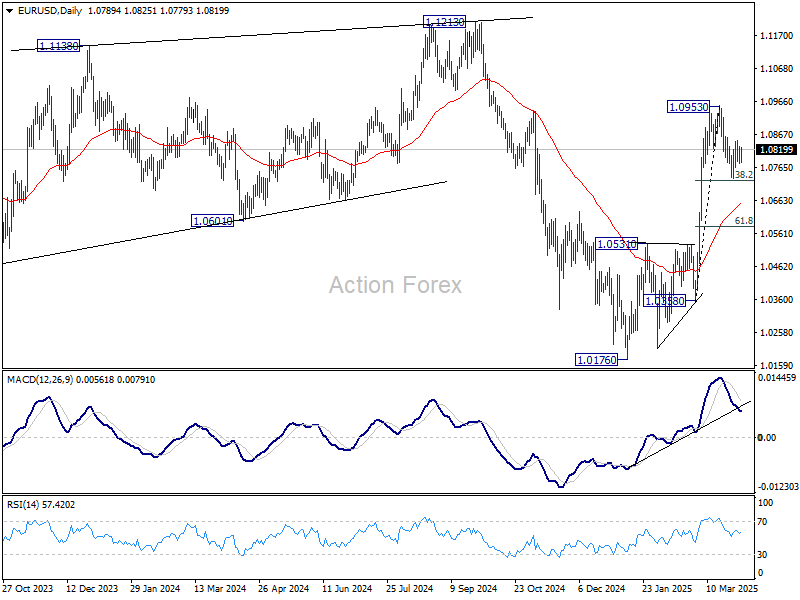
Daily Pivots: (S1) 1.0770; (P) 1.0800; (R1) 1.0822; More...
Intraday bias in EUR/USD remains neutral at this point. On the upside, break of 1.0857 resistance will indicate that correction from 1.0963 has completed already. Retest of 1.0953 should be seen first. Firm break there will resume the rally from 1.0176 towards 1.1274 key resistance. However, firm break of 38.2% retracement of 1.0358 to 1.0953 at 1.0726 will bring deeper correction to 55 D EMA (now at 1.0656).
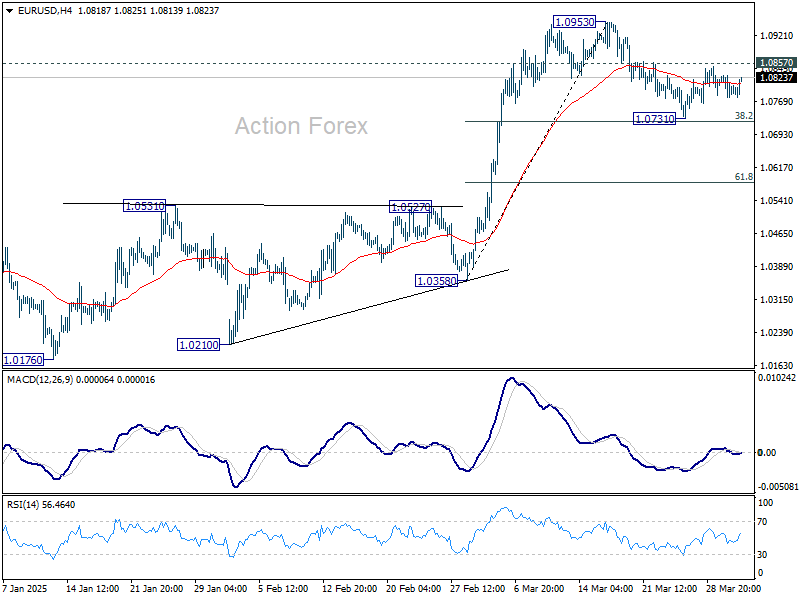
In the bigger picture, prior strong break of 55 W EMA (now at 1.0692) suggests that fall from 1.1274 (2024 high) has completed as a three wave correction to 1.0176. Rise from 0.9534 is still intact, and might be ready to resume. Decisive break of 1.1274 will target 100% projection of 0.9534 to 1.1274 from 1.0176 at 1.1916. Also, that will send EUR/USD through a multi-decade channel resistance will carries larger bullish implication. This will now be the favored case as long as 1.0531 resistance turned support holds.
GBP/USD Mid-Day Outlook
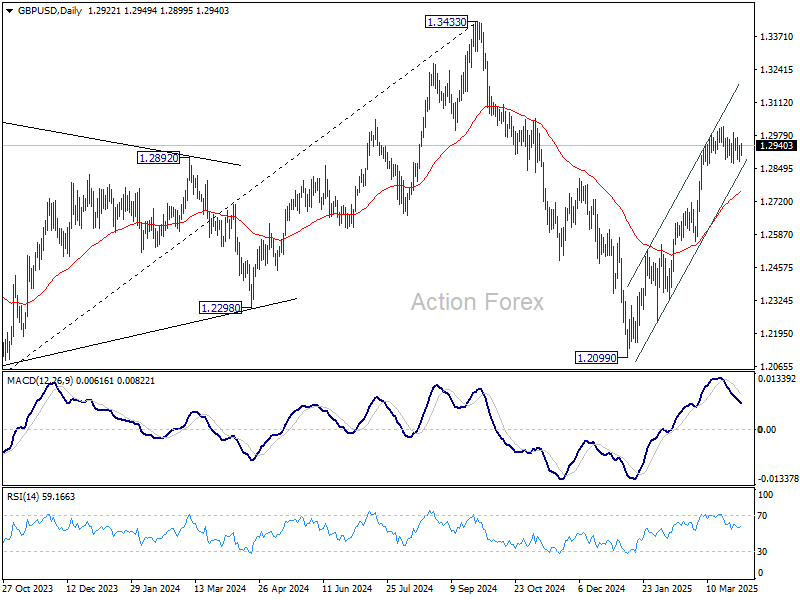
Daily Pivots: (S1) 1.2888; (P) 1.2915; (R1) 1.2950; More...
Intraday bias in GBP/USD remains neutral as consolidation from 1.3013 continues. On the downside, below 1.2869 will bring deeper correction. But downside should be contained above 38.2% retracement of 1.2248 to 1.3013 at 1.2721. On the upside, break of 1.3013 will resume the rally from 1.2099 towards 1.3433 high.
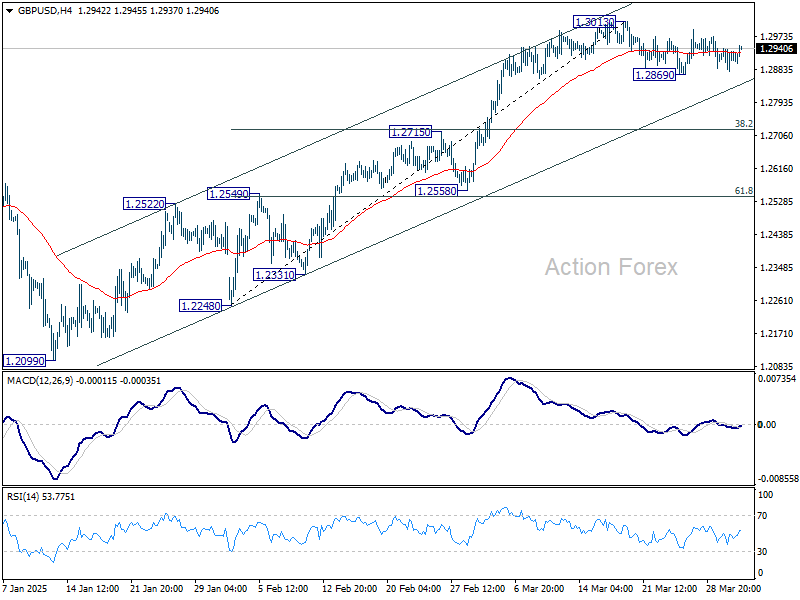
In the bigger picture, up trend from 1.3051 (2022 low) is not completed. Resumption is expected after corrective pattern from 1.3433 completes. Next target will be 1.4248 key resistance (2021 high). This will now remain the favored case as long as 1.2099 support holds.