Sample Category Title
Forex Technical Analysis: EUR/USD, USD/JPY, GBP/USD
EUR/USD
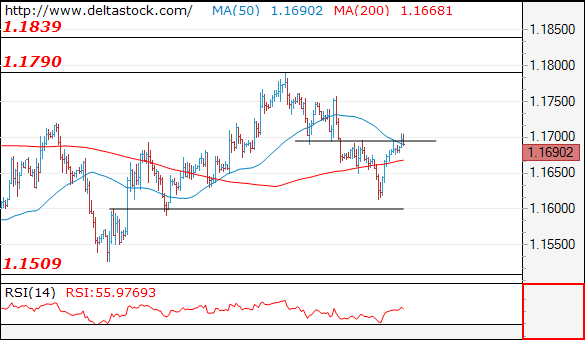
Current level - 1.1690
The reversal at 1.1610 signals a positive bias, for a rise towards 1.1790, en route to 1.1830 area.
| Resistance | Support | ||
| intraday | intraweek | intraday | intraweek |
| 1.1700 | 1.1830 | 1.1650 | 1.1510 |
| 1.1830 | 1.2050 | 1.1600 | 1.1300 |
USD/JPY
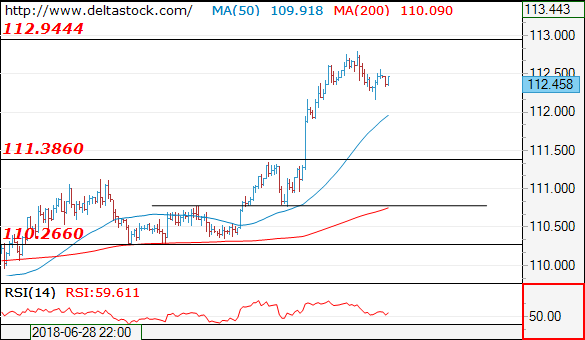
Current level - 112.45
A consolidation pattern unfolds after the failed test at 112.90, so allow an extension towards 111.90 before renewal of the general upmove to 114.50.
| Resistance | Support | ||
| intraday | intraweek | intraday | intraweek |
| 112.90 | 112.90 | 111.90 | 110.20 |
| 113.70 | 114.50 | 111.40 | 106.70 |
GBP/USD
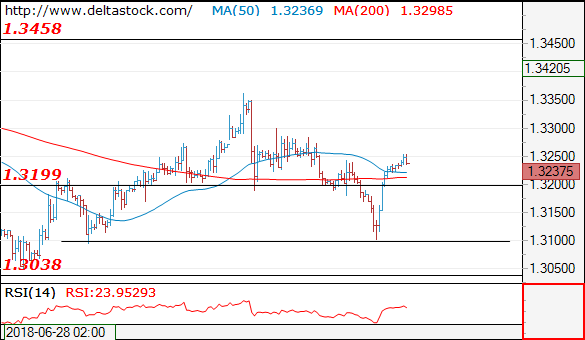
Current level - 1.3237
The dip to 1.3100 found a reliable support and the reversal signals a positive bias, for a rise towards 1.3360, en route to 1.3460. Minor support is projected at 1.3190.
| Resistance | Support | ||
| intraday | intraweek | intraday | intraweek |
| 1.3360 | 1.3618 | 1.3190 | 1.3040 |
| 1.3460 | 1.3990 | 1.3100 | 1.2770 |
EURUSD Surpasses SMAs In Near-Term; 23.6% Fibonacci Acts As Strong Obstacle For Bears
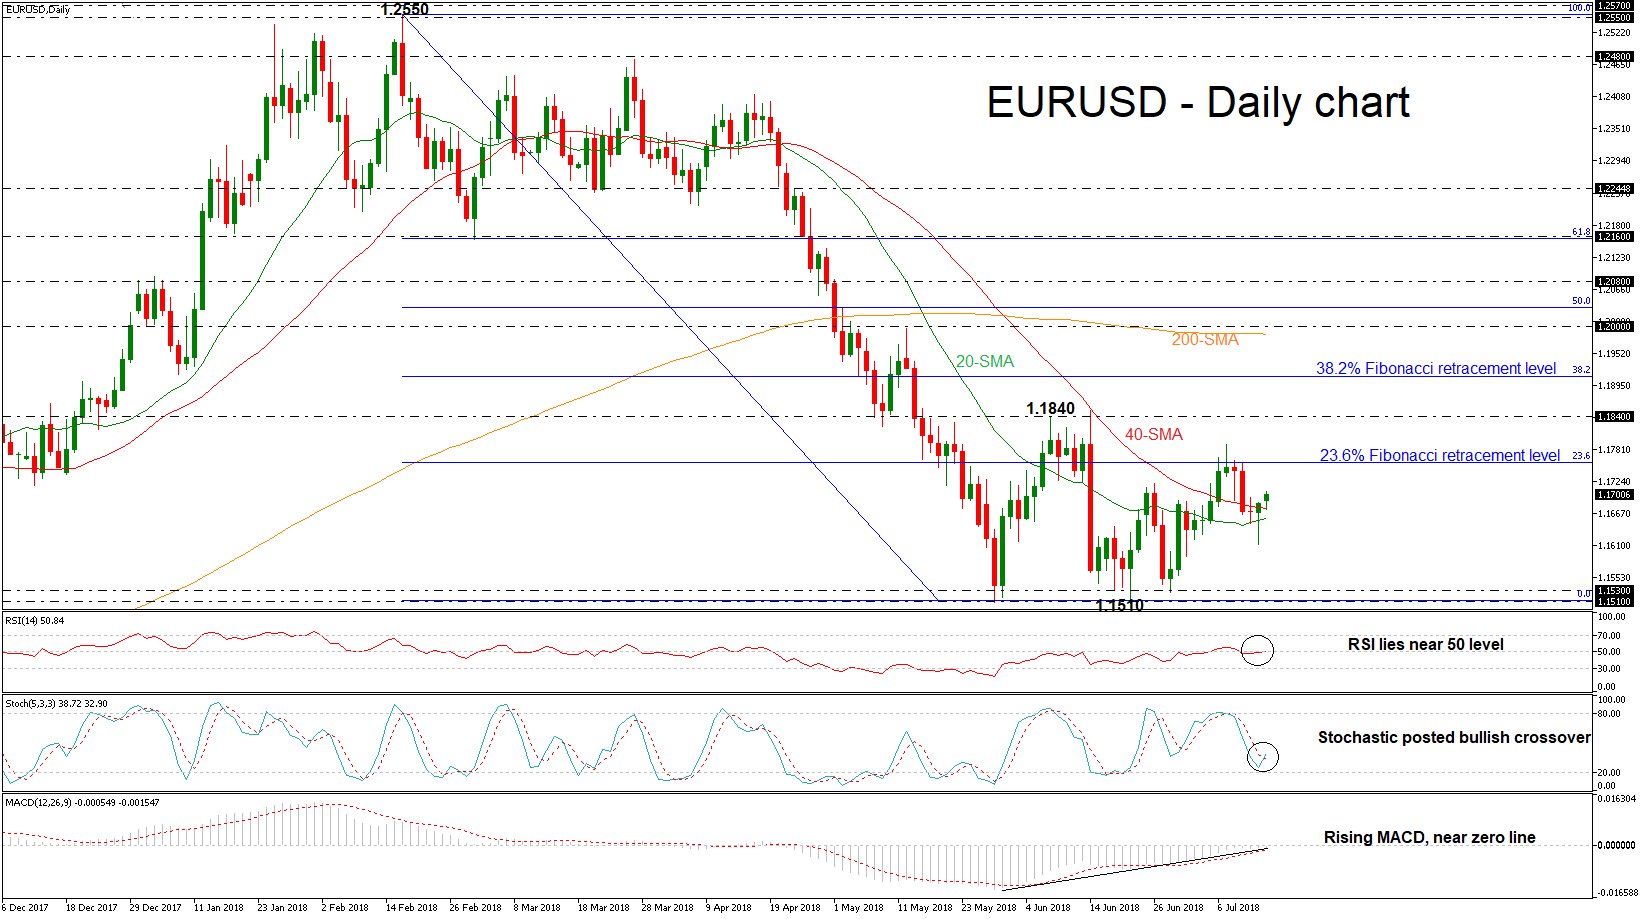
EURUSD remains below the strong resistance level of the 23.6% Fibonacci retracement level around 1.1760 of the downleg from 1.2550 to 1.1510. However, since yesterday the world’s most traded currency surpassed the 20- and 40-simple moving averages (SMAs) in the daily timeframe, suggesting a possible upside correction.
From the technical point of view, the technical indicators are endorsing the bullish bias but are still moving with weak momentum. The RSI indicator is holding slightly above the threshold of 50, while the MACD oscillator is rising in the negative territory and is trying to jump above the zero line. Moreover, the %K line of the stochastic oscillator posted a bullish crossover with the %D line indicating some gains in the short-term.
Upsides moves are likely to find resistance at the aforementioned strong obstacle of the 23.6% Fibonacci mark (1.1760) before being able to re-challenge the 1.1840 significant resistance, taken from the June 7 high. Rising above this area would help shift the focus to the upside towards the 38.2% Fibonacci of 1.1910. Breaking this level could see a touch of the 1.2000 psychological level, which stands near the 200-SMA in the medium-term.
On the flip side, if the price dives below the short-term moving averages, the bearish phase would remain in play especially if the price hit again the 1.1510 – 1.1530 support zone. Clearing this key area would see additional losses towards the 1.1300 handle, identified by the high on November 2016.
To conclude, EURUSD would be in a trading range in the near term if it hits again the 1.1840 resistance and reverses lower again. Though, a climb above this level could endorse the scenario for a period of gains.
Gold Rebounds On 1-Year Low, Bearish Sloping Channel Holds
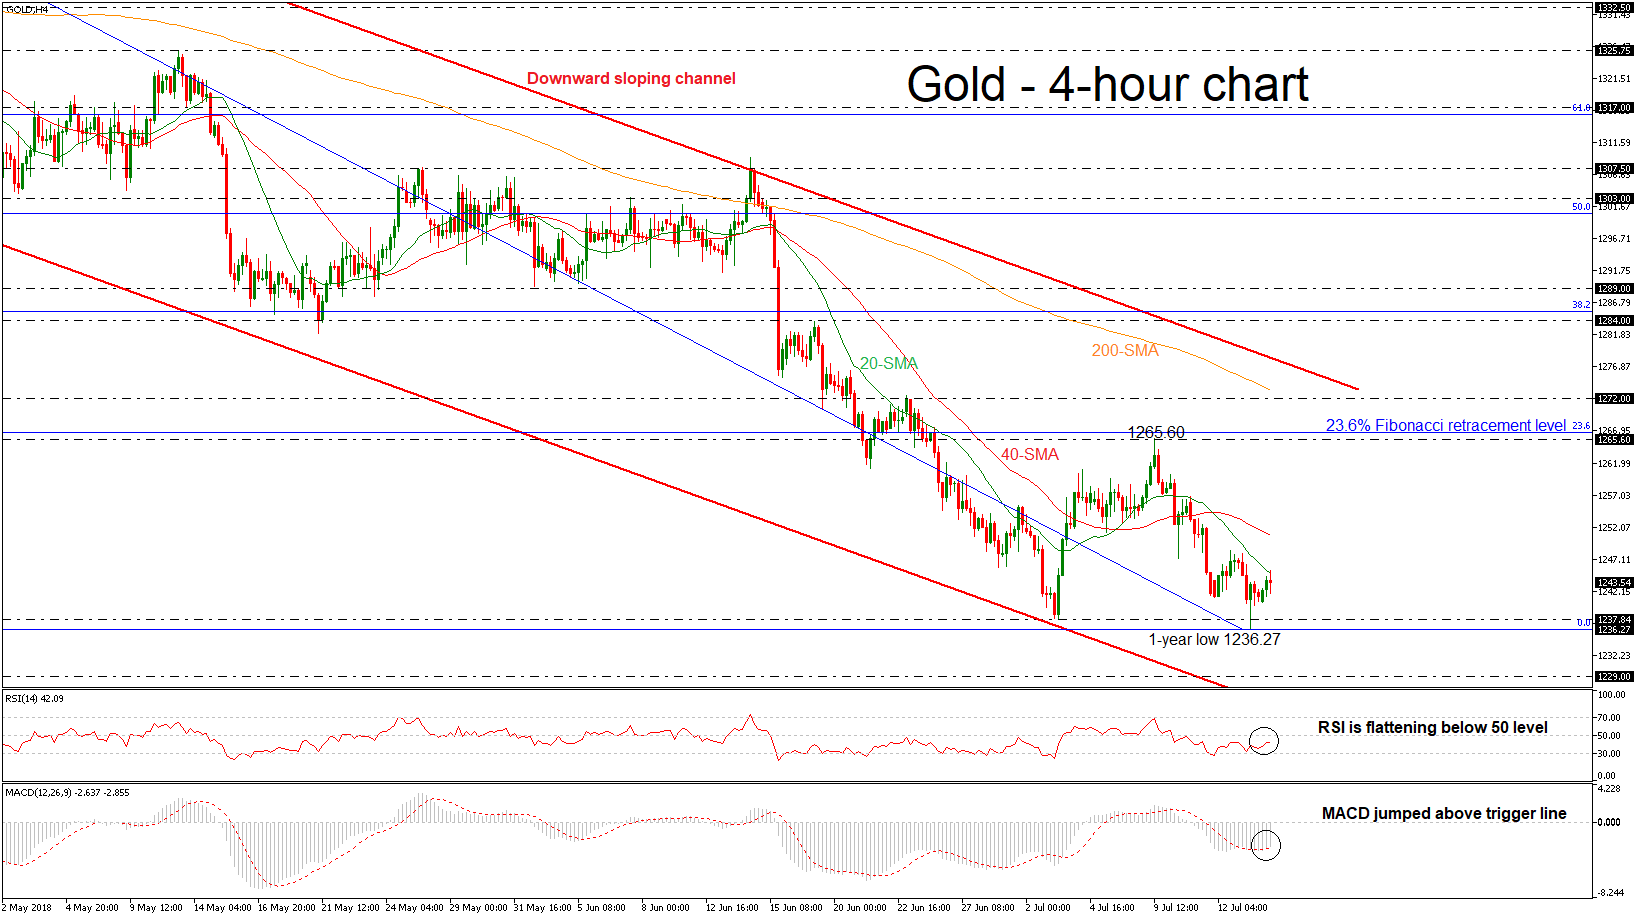
Gold dipped to a fresh one-year low of 1236.27 during Friday’s trading session and posted a strong negative day, while it closed well above its intraday trough. Zooming in the 4-hour chart, the price today found a significant hurdle on the 20-simple moving average (SMA) and failed to jump above it.
The technical indicators are sending different signals with the Relative Strength Index (RSI) flattening in the negative zone, however, the MACD oscillator created a bullish cross with its trigger line in the bearish area as well.
If price action remains below the 20-SMA, there is scope to test the 1237.84 low. A drop below this area would take the price closer to the one-year low (1236.27). Further losses would open the way towards the 1229 support level, taken from the high on July 2017.
However, if the market manages to pick up speed and surpasses the 40-SMA in the 4-hour chart, it could offer nearby resistance near 1250.89 at the time of writing. A successful jump above the latter could push the commodity even higher until the 1265.60 resistance level, which stands near the 23.6% Fibonacci retracement level of the downleg from 1365 to 1236.27.
Overall, the precious metal has been holding within a downward sloping channel since April 11, indicating that the price remains in a bearish mode in the long term.
Pound Rebounds Ahead Of Busy Week, US Retail Sales In The Spotlight
Here are the latest developments in global markets:
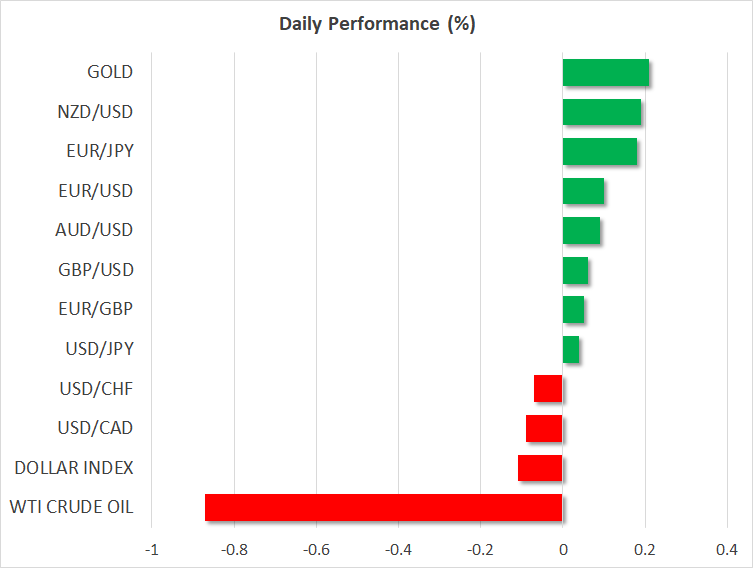
FOREX: The US dollar index is down by 0.1% on Monday, extending the losses it posted in the previous session as longer-term US Treasury yields tumbled. The Japanese yen, meanwhile, is slightly lower against all its major counterparts on Monday, amid a lack of escalation in trade tensions.
STOCKS: US markets closed higher on Friday, as trade concerns remained out of the spotlight. The Dow Jones led the way up, gaining 0.38%, while the S&P 500 advanced by 0.11% to reach a new five-month high. Meanwhile, although the Nasdaq Composite rose only by 0.026%, that was still enough for the tech-heavy index to post a fresh all-time high. The positive sentiment appears to have remained in place, as futures tracking the Dow, S&P, and Nasdaq 100 are currently signaling a higher open today. Indices in Asia, however, were a sea of red, following a mixed batch of data out of China overnight. In Hong Kong, the Hang Seng dropped by 0.14%, while in South Korea, the Kospi 200 was down by 0.43%. Japanese markets remained closed for a public holiday. Meanwhile in Europe, futures suggest most major indices are set to open lower today, albeit not significantly so.
COMMODITIES: Oil prices are lower on Monday, with WTI and Brent being down by 0.88% and 0.97% respectively. Note that on Friday, media reports hit the wires that the Trump administration is considering releasing oil from the US strategic petroleum reserves to offset high prices. These reserves are an emergency supply the US implemented back in 1975 to mitigate any future supply shocks. Any official confirmation the US is considering such a course of action could spell further trouble for oil prices. In precious metals, gold is up by 0.21% on Monday, currently trading near $1,243 per troy ounce. The yellow metal posted a fresh low for 2018 on Friday, briefly touching the $1,236 mark on the back of an appreciating dollar, before it rebounded in the subsequent hours as the greenback retreated.
Major movers: Sterling rebounds, yen remains under pressure
The British pound was once again in the spotlight on Friday. Whereas the currency tumbled early during the session on reports US President Trump “shot down” the prospect of a US-UK trade deal, it recovered all its losses during the European afternoon to finish the day higher against its major peers. The rebound came as Trump and UK PM Theresa May held a joint press conference, where the US President refuted the media reports – characterizing them as “fake news” – and keeping the option of a US-UK trade deal firmly on the table.
This week promises to be particularly interesting for the pound, amid a raft of crucial data releases that could seal the deal for a BoE rate increase at the August meeting, a prospect currently priced in with a 73% probability according to UK OIS. Besides monetary policy, the other driver for sterling will be the EU's response to the UK Brexit White Paper. In particular, investors will look at whether the EU negotiators will reject the plan as “unworkable”, hence sending the talks back to square one, or whether they'll acknowledge it's a position for negotiating and come back with counterproposals. The next remarks from EU chief negotiator Michel Barnier will likely provide a taste of what's to come.
The dollar index reversed course on Friday, paring the gains it posted early in the session to finish the day lower overall. There was little in the way of news flow, so the move appears to be owed primarily to a tumble in longer-term US Treasury yields.
The yen, meanwhile, remains on the back foot. It's lower on Monday against all its major counterparts, with euro/yen and sterling/yen touching fresh 10-week and seven-week highs respectively. Risk appetite stayed firm on Friday, amid speculation that the next step in the US-China trade standoff may be another round of negotiations.
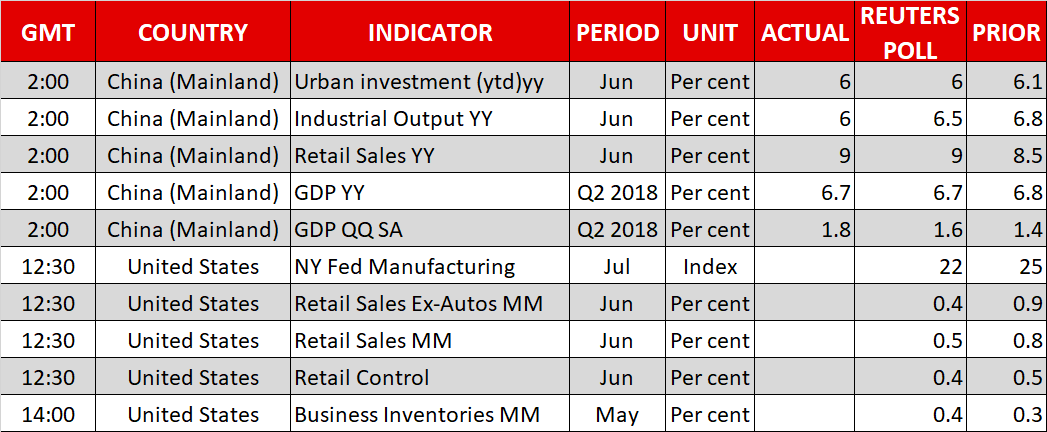
Overnight, China's quarterly GDP data for Q2 were mixed. Whereas GDP growth was stronger-than-anticipated in quarterly terms, it slowed down in line with consensus expectations on a yearly basis. Retail sales and fixed asset investment were in line with their forecasts in June, while industrial production disappointed.
Day ahead: US retail sales due; Trump-Putin meeting and UK Brexit vote on the agenda as well
US retail sales are gathering most interest out of Monday's releases. In the meantime, a Trump-Putin meeting is on the agenda, while lawmakers in the UK will be voting on amendments to legislation on the government's post-Brexit customs relationship with the EU.
The US will be on the receiving end of retail sales data for June at 1230 GMT. Sales are anticipated to grow by 0.5% m/m, a weaker pace relative to May's 0.8% which constituted the largest gain since November 2017 and added to views for robust US economic growth during Q2. Additionally, core retail sales, this being the measure of sales that excludes automobiles and which more closely aligns with the consumer spending component of GDP, are projected to expand by 0.4% on a monthly basis, again reflecting a slowdown compared to May's 0.9%. Fed funds futures currently project a 54% probability for two additional rate hikes by the US central bank during 2018. Stronger-than-expected retail sales readings today have the potential to more conclusively put on the table a second rate increase – something which would put the total number of hikes for 2018 to four – consequently boosting the greenback.
Data on retail control, as well as July's New York Fed manufacturing survey will be made public alongside retail sales numbers, while figures on May's business inventories are due out of the world's largest economy at 1400 GMT.
During today's UK vote, “Brexiteers” are set to support amendments promoting a harder Brexit, against PM Theresa May's plan for closer alignment with the EU. May is not expected to be defeated on the amendments, though rising differences with fellow Conservatives may add to political uncertainty, casting fresh doubts on her leadership.
An EU-China Summit is underway in Beijing. Among the EU representatives are the President of the European Council Donald Tusk and the President of the European Commission Jean-Claude Juncker. Among others, they will be meeting the Chinese President Xi Jinping, who will also be seeing World Bank President Jim Yong Kim.
Meanwhile, President Trump's meeting with his Russian counterpart Vladimir Putin in Helsinki today will be closely watched.
In equities, Bank of America and BlackRock will be reporting quarterly earnings before the US market open, with Netflix's respective report hitting the markets after the closing bell on Wall Street.
Technical Analysis: USDJPY bullish bias eases
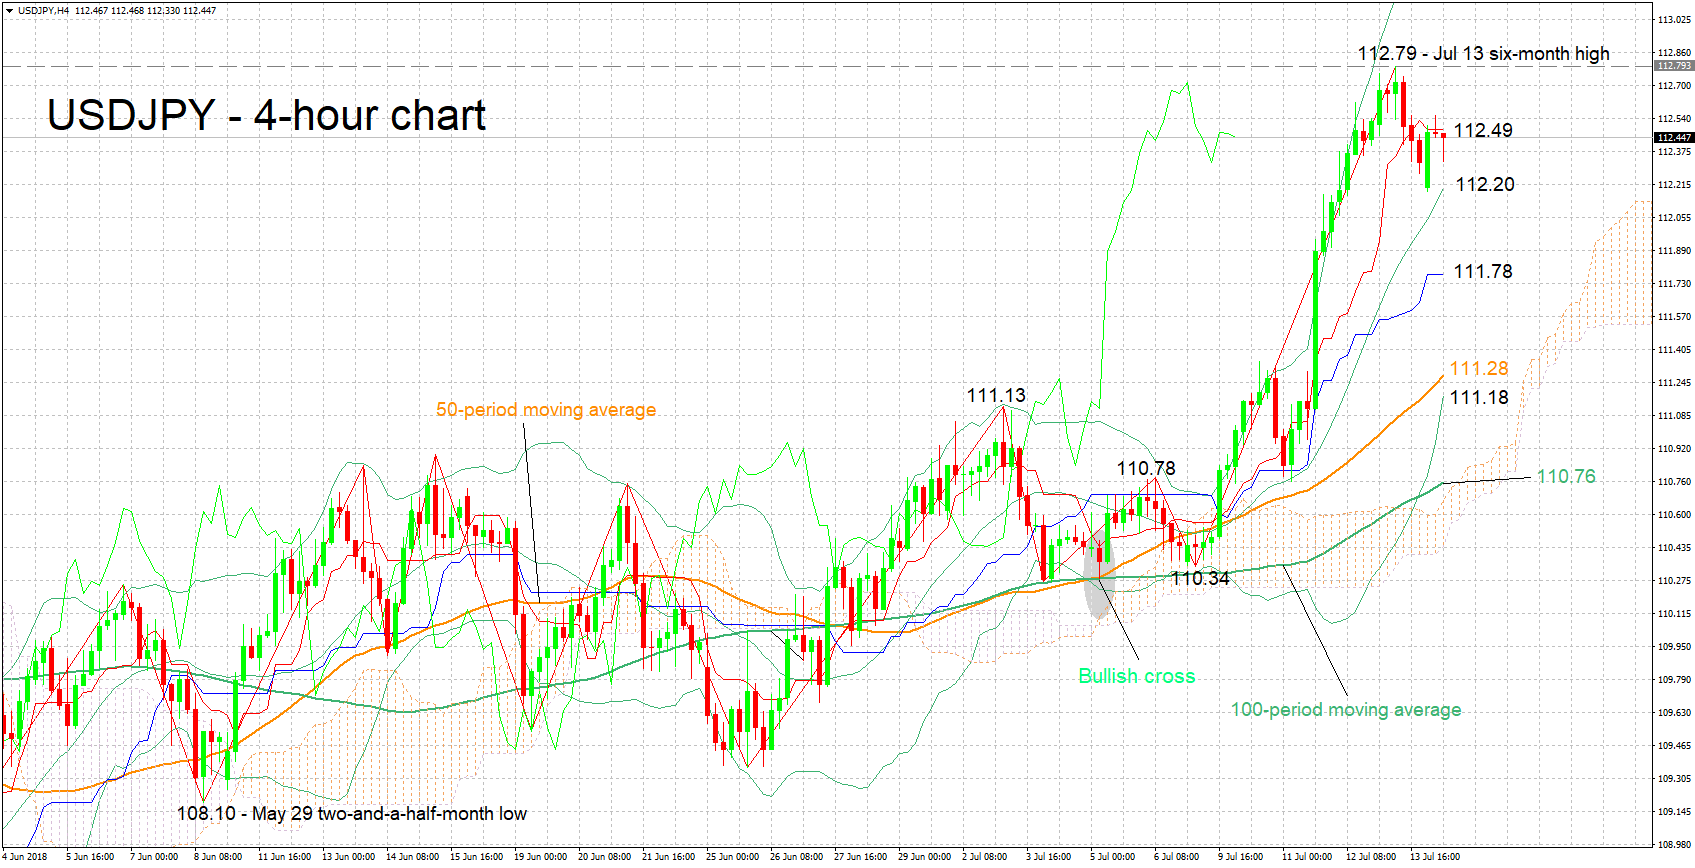
USDJPY has declined a bit after touching a six-month high of 112.79 on Friday. The Tenkan-sen remains above the Kijun-sen line, this supporting the case for a bullish bias, though the two lines have flatlined. The latter is an indication that positive momentum has eased. Fresh catalysts such as today's retails sales release out of the US can push the momentum in either direction.
Better-than-expected retail sales prints are likely to generate buying interest for USDJPY. Immediate resistance seems to be taking place around the current level of the Tenkan-sen at 112.49. Further above, the attention would turn to the region around last week's six-week high of 112.79, including the 113 round figure.
On the downside and in case of weaker-than-anticipated readings, support may come from the zone around the middle Bollinger line – a 20-period moving average line – at 112.20, including the 112 handle. Sharper losses would shift the focus to 111.78, this being the current level of the Kijun-sen.
EUR/AUD Daily Outlook
Daily Pivots: (S1) 1.5710; (P) 1.5742; (R1) 1.5772; More....
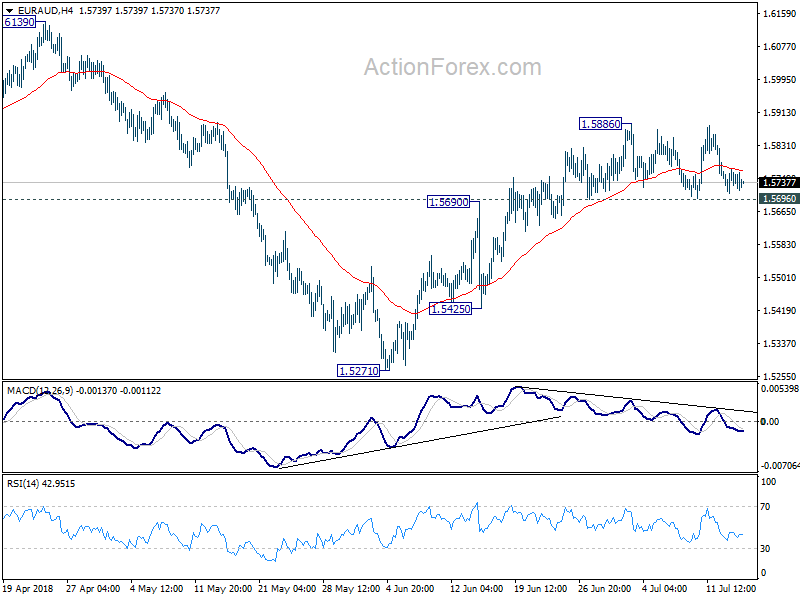
EUR/AUD is still bounded in range of 1.5696/5886 and intraday bias remains neutral for the moment. Further rise is expected with 1.5695 support holds. On the upside break of 1.5886 will resume the rebound from 1.5271 and target a test on 1.6189 high. Nonetheless, the momentum and structure of such rise from 1.5271 are not too convincing. Break of 1.5696 will suggest near term reversal and turn bias to the downside for 1.5425 support for confirmation.
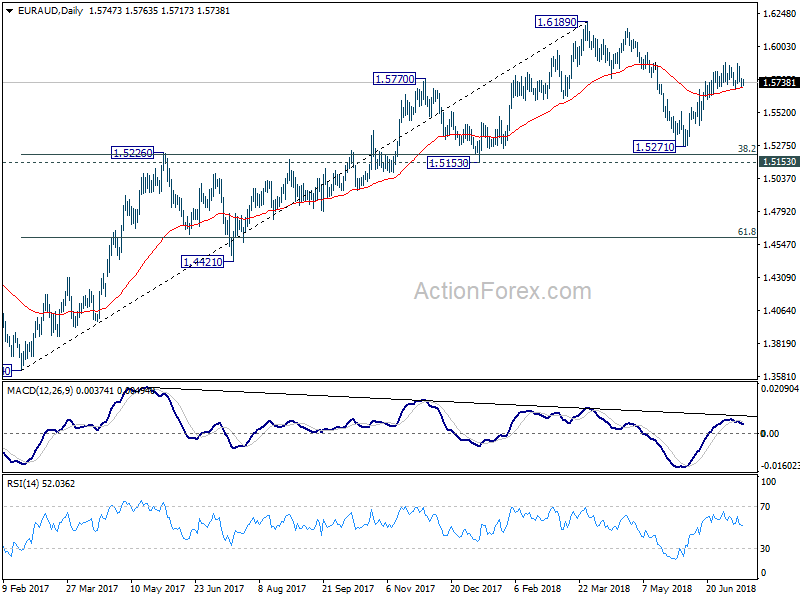
In the bigger picture, current development suggests that fall from 1.6189 is a corrective move and has completed at 1.5217 already. Key support levels of 1.5153 and 38.2% retracement of 1.3624 to 1.6189 at 1.5209 were defended. And medium term rise from 1.3624 (2017 low) is still in progress. Break of 1.6189 will target 1.6587 key resistance (2015 high).
China GDP Growth Rate
Sentiment towards the Chinese economy was dealt a slight blow, following reports of the nation growing at its slowest pace since 2016 during the second quarter of 2018.
Chinese GDP growth expanded 6.7% year on year, slightly lower than the 6.8% growth witnessed in the previous quarter amid escalating trade tensions. While the latest GDP figures may raise concerns over global growth, it must be kept in mind that China was able to secure an annual growth rate of 6.8% year on year in the first half of 2018. When factoring how the current pace of growth still remains firmly above the governments annual growth target of 6.5%, the overall outlook for the Chinese economy remains encouraging. As the third quarter gets under way, markets will be closely watching how the global trade developments play out and what impacts it may have on the Chinese, US and global economy.
EUR/GBP Daily Outlook
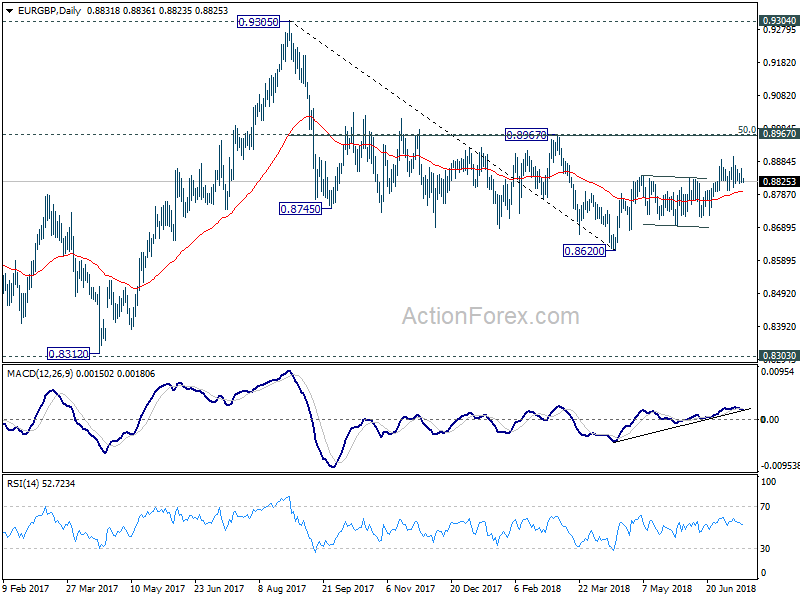
Daily Pivots: (S1) 0.8813; (P) 0.8841; (R1) 0.8856; More...
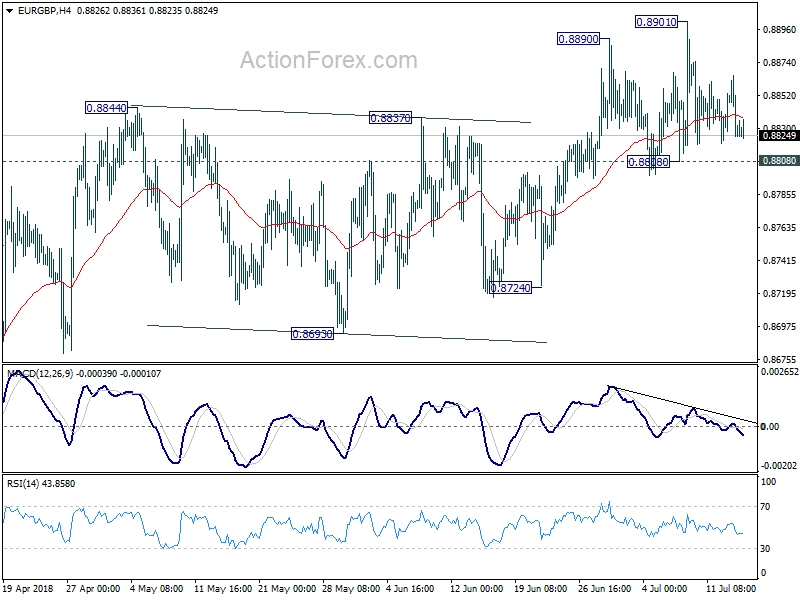
Intraday bias in EUR/GBP remains neutral for the moment. As long as 0.8808 minor support holds, further rise is mildly in favor. On the upside, break of 0.8901 will resume the rebound fro 0.8620 and target 0.8967 cluster resistance (50% retracement of 0.9305 to 0.8620 at 0.8963). However, break of 0.8808 support will be the first sign that whole rebound from 0.8620 is completed. Deeper fall would then be seen to 0.8724 support for confirmation.
In the bigger picture, EUR/GBP is staying in long term consolidation pattern from 0.9304 (2016 high). Such consolidation pattern could extend further. Hence, in case of strong rally, we'd be cautious on strong resistance from 0.9304/5 to limit upside. Meanwhile, in another decline attempt, we'd expect strong support from 0.8116 cluster support (50% retracement of 0.6935 to 0.9304 at 0.8120) to contain downside.
EUR/CHF Daily Outlook
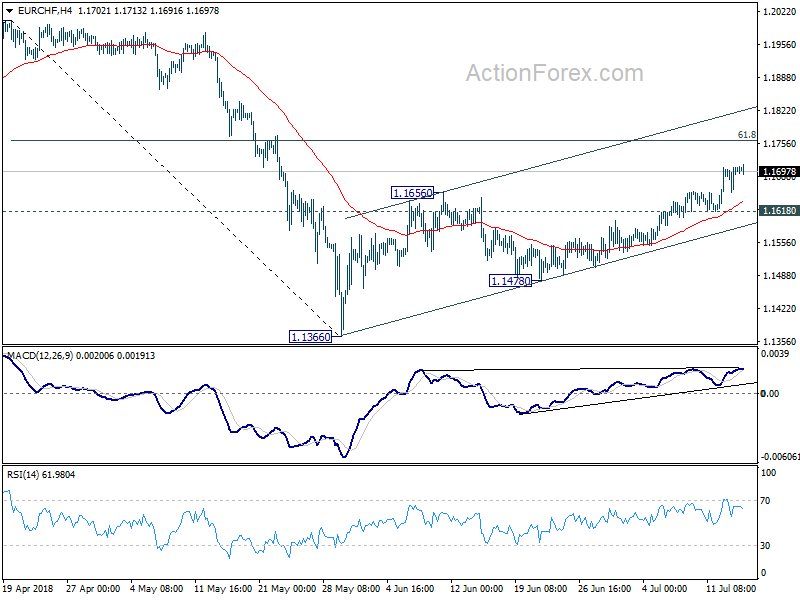
Daily Pivots: (S1) 1.1673; (P) 1.1691; (R1) 1.1725; More...
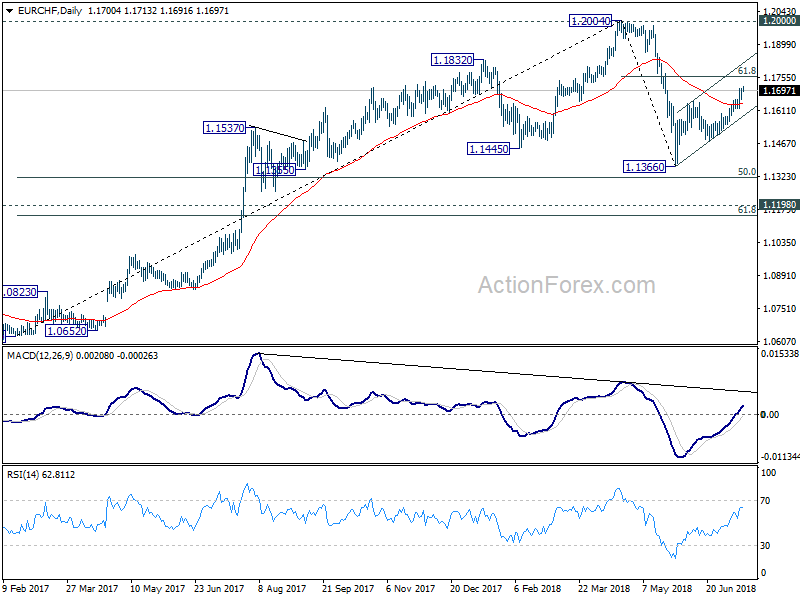
Intraday bias in EUR/CHF remains on the upside at this point. Further rise would be seen to 61.8% retracement of 1.2004 to 1.1366 at 1.1760. However, as rebound from 1.1366 is seen as the second leg of the corrective pattern from 1.2004, we'd expect strong resistance from 1.1760 to limit upside. On the downside, below 1.1618 will turn bias back to the downside for 1.1478 support and below. However, sustained trading above 1.1760 will pave the way to retest 1.2004 high next.
In the bigger picture, 1.2004 is seen as a medium term top with bearish divergence condition in daily and weekly MACD. 1.2000 is also an important resistance level. Hence, the corrective pattern from 1.2004 is expected to extend for a while before completion. Hence, we're not anticipating a break of 1.2004 in near term. Another decline cannot be ruled out yet. But in that case, strong support should be seen at 1.1198 (2016 high), 61.8% retracement of 1.0629 to 1.2004 at 1.1154 to contain downside.
AUD/USD Daily Outlook
Daily Pivots: (S1) 0.7387; (P) 0.7406; (R1) 0.7444; More...
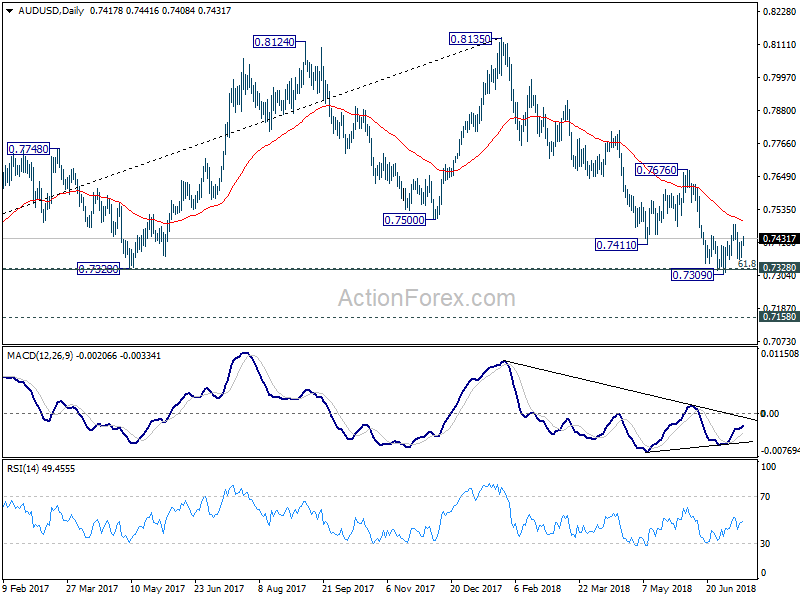
Intraday bias in AUD/USD remains neutral first. The consolidation from 0.7309 could extend further and stronger recovery cannot be ruled out. But after all, upside should be limited below 0.7676 resistance to bring larger fall resumption. On the downside, below 0.7359 will target 0.7309 support first. Sustained trading below 0.7328 cluster support (61.8% retracement of 0.6826 to 0.8135 at 0.7326) will extend the fall from 0.8135 to 0.7158 support next.
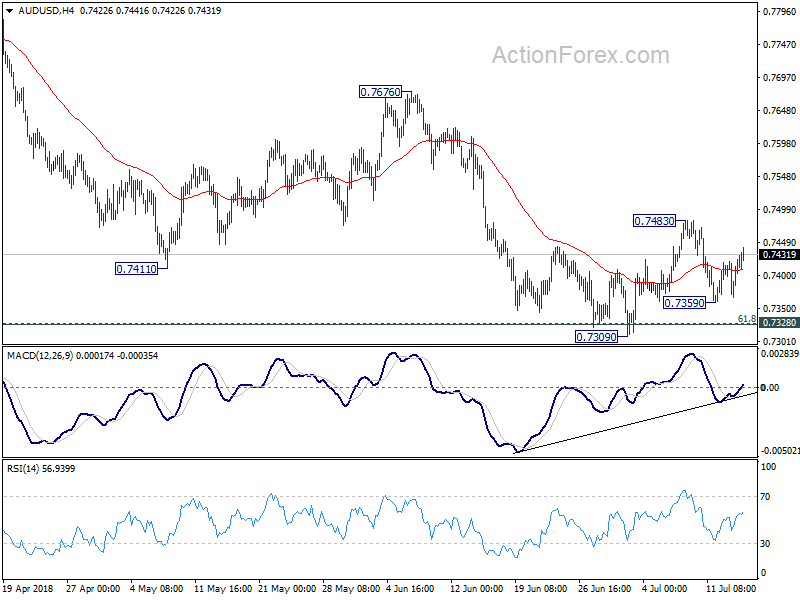
In the bigger picture, medium term rebound from 0.6826 is seen as a corrective move that should be completed at 0.8135. Deeper decline would be seen back to retest 0.6826 low. This will now remain the favored case as long as 0.7676 resistance holds.
USD/CAD Daily Outlook
Daily Pivots: (S1) 1.3132; (P) 1.3171; (R1) 1.3192; More...
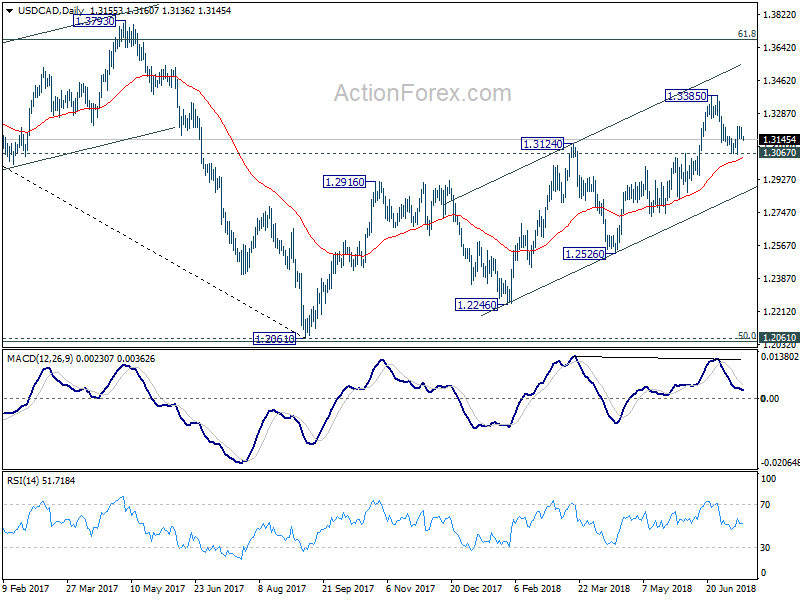
Intraday bias in USD/CAD remains neutral for the moment. We're preferring the case that pull back from 1.3385 has completed at 1.3063 already. Above 1.3216 will bring retest of 1.3385 first. Break will resume whole rally from 1.2061 for 1.3685 fibonacci level. However, firm break of 1.3067 resistance turned support will bring deeper fall to channel support (now at 1.2856).
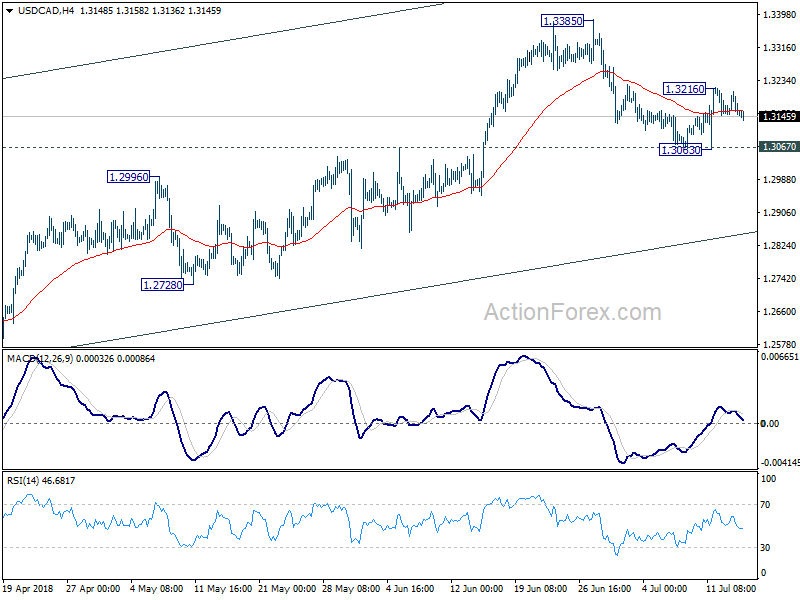
In the bigger picture, as long as channel support (now at 1.2856) holds, we'll holding to the bullish view. That is, fall from 1.4689 (2015 high) has completed at 1.2061, ahead of 50% retracement of 0.9406 (2011 low) to 1.4689 (2015 high) at 1.2048. Further rally should be seen for 61.8% retracement of 1.4689 to 1.2061 at 1.3685 and above. However, sustained break of the channel support will argue that rise from 1.2061 has completed and will bring deeper fall to 1.2526 support to confirm.