

Sample Category Title
EUR/CHF Weekly Outlook
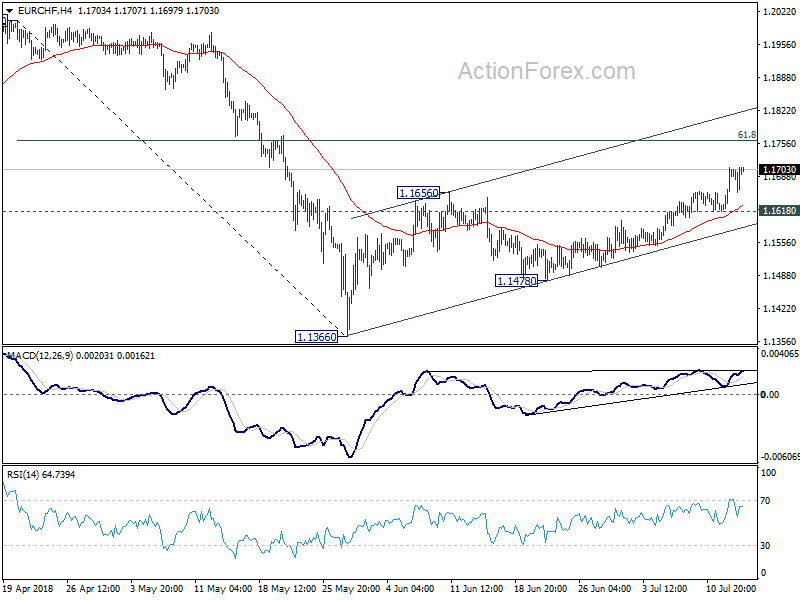
EUR/CHF's rebound from 1.1366 low resumed last week by breaking 1.1656 resistance and reached as high as 1.1707. Initial bias remains on the upside this week for 61.8% retracement of 1.2004 to 1.1366 at 1.1760. As such rebound is seen as the second leg of the corrective pattern from 1.2004, we'd expect strong resistance from 1.1760 to limit upside. On the downside, below 1.1618 will turn bias back to the downside for 1.1478 support and below. However, sustained trading above 1.1760 will pave the way to retest 1.2004 high next.
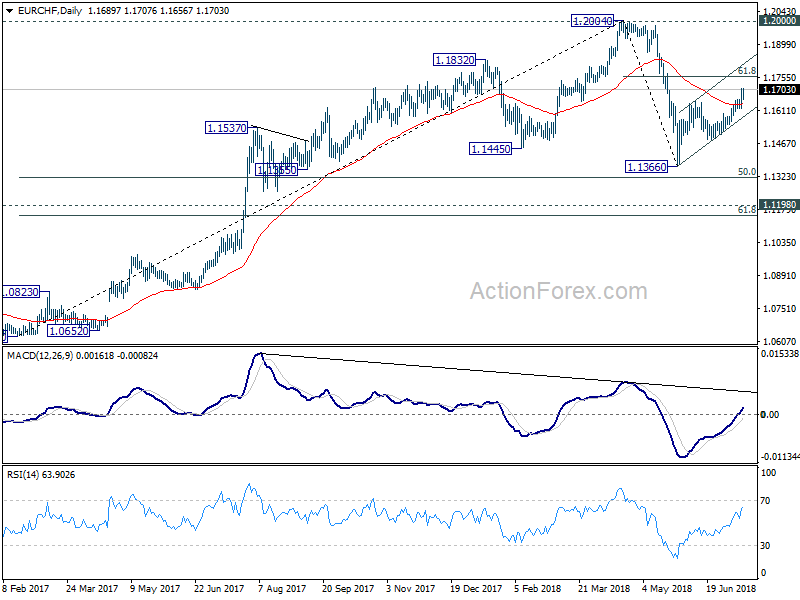
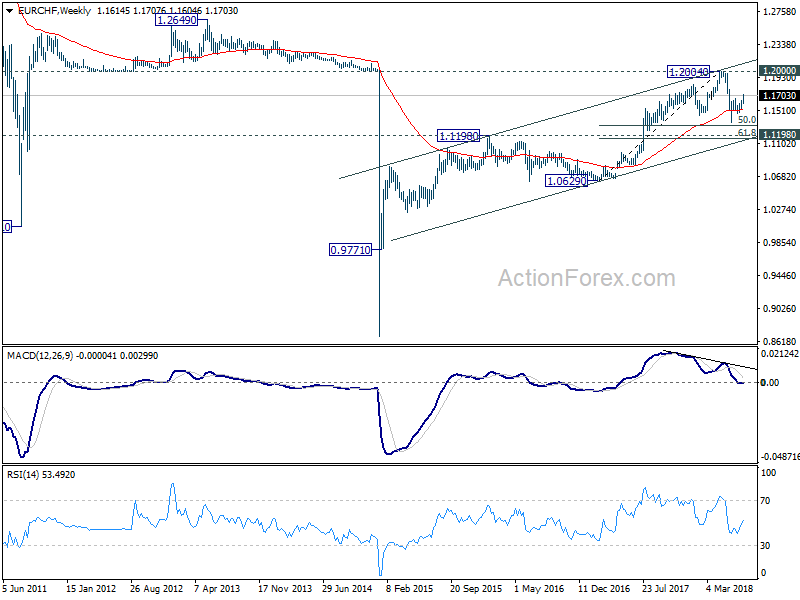
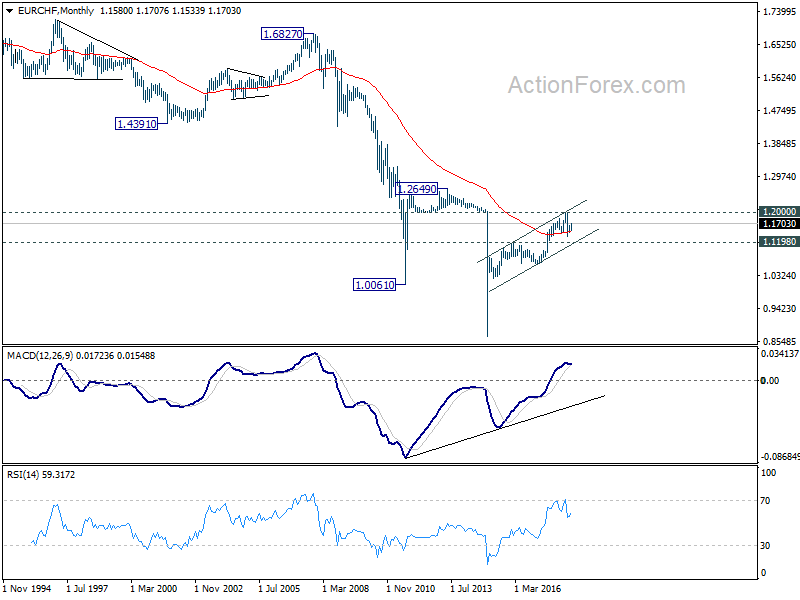
In the bigger picture, 1.2004 is seen as a medium term top with bearish divergence condition in daily and weekly MACD. 1.2000 is also an important resistance level. Hence, the corrective pattern from 1.2004 is expected to extend for a while before completion. Hence, we're not anticipating a break of 1.2004 in near term. Another decline cannot be ruled out yet. But in that case, strong support should be seen at 1.1198 (2016 high), 61.8% retracement of 1.0629 to 1.2004 at 1.1154 to contain downside.
Dollar Not Ready to Resume Up Trend Yet, Risk Appetite to Continue
Yen and Swiss Franc ended as the weakest ones last week as global stock markets ended higher. There were some jitters in risk sentiments after US announced to move on with tariffs on additional USD 200B in China imports, which come effective as soon as in September. But investors were quickly relieved after China's refrained response. While China still pledged to retaliate, there is no far no detail on the plan, not even leaked. On the other hand, while Dollar ended as the strongest one, the lack of further escalation in trade war limited its strength. Indeed, the late pull-back of the greenback on Friday argues that it's not ready to resume recent up trend yet. Australian Dollar ended as the second strongest as particularly lifted by rebound in Asian markets. Sterling survived resignation of two ministers and Trump's blasting of the softer Brexit plan, ended as the third strongest. Canadian Dollar was just mixed as the lift by hawkish BoC rate hike was offset by the sharp fall in oil price.
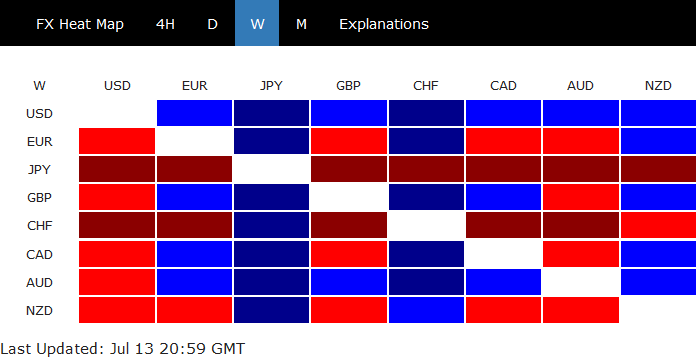
Going through all the noises, the main development last week was the weakness in Yen and Franc. That was primarily built on strength in global equities. In particular, NASDAQ hit record highs as it resumed the larger up trend. Near term strength in equities is anticipated. There could be some more positive news as European Commission President Jean-Claude Juncker visits China and Japan on Monday and Tuesday. China is known to look into EU to expand partnership on trade and investment, and on other issues like climate change. Juncker will also sign an Economic Partnership Agreement with Japan during the visit.
However, it should be noted that the risks of trade war is just temporarily taking a back seat and a lot of development is happening. The section 232 investigation in auto tariffs is undergoing and could be completed in weeks. That will be a huge blow to European and North American car industry. And China could be ready to step up with its rhetoric again once stocks rebounded to a level that's comfortable for investors to see another selloff. So, for now, we don't anticipate risk appetite to stay long.
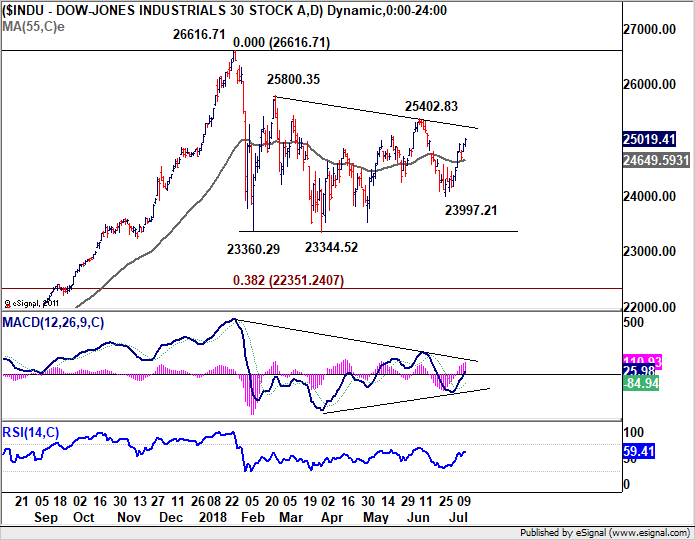
DOW rebounded as medium term consolidation extends
Technically, DOW's strong rebound last week suggested that fall from 25402.83 has completed at 23997.21 already. That temporarily removed the risk of further decline through 23344.52 support. Instead, favors are now on further rebound back to 25402.83, and possibly above to 25800.35. But after all, recent price actions are corrective looking. And even the rebound from 23997.21 is not impulsive looking. Hence, we'd hold on to the view that consolidation pattern from 26616.71 is not completed yet and there will be another fall through 23344.52 before up trend resumption.
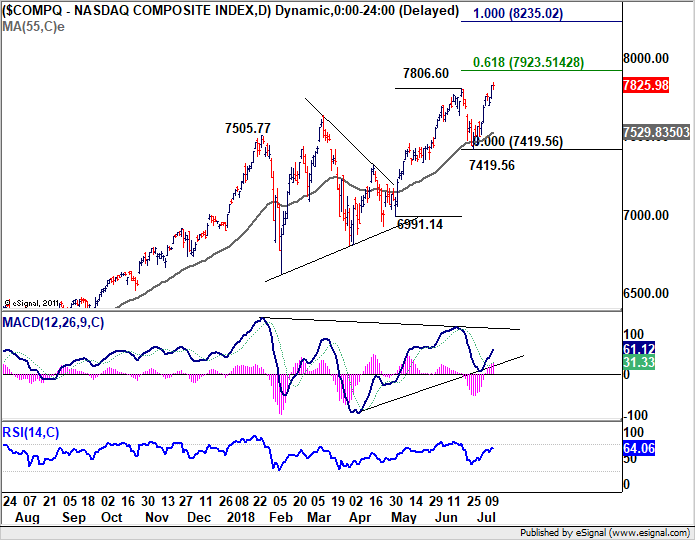
NASDAQ hit record high with convincing momentum
On the other hand, the near term upside momentum in NASDAQ is much more convincing. And that's how an up trend resumption should look like. Further rise should be seen to 61.8% projection of 6991.14 to 7806.60 from 7419.56 at 7923.51. Nonetheless, considering bearish divergence in daily MACD, we'll pay attention to loss of momentum above 7923.51 and at it approaches 8000 handle.
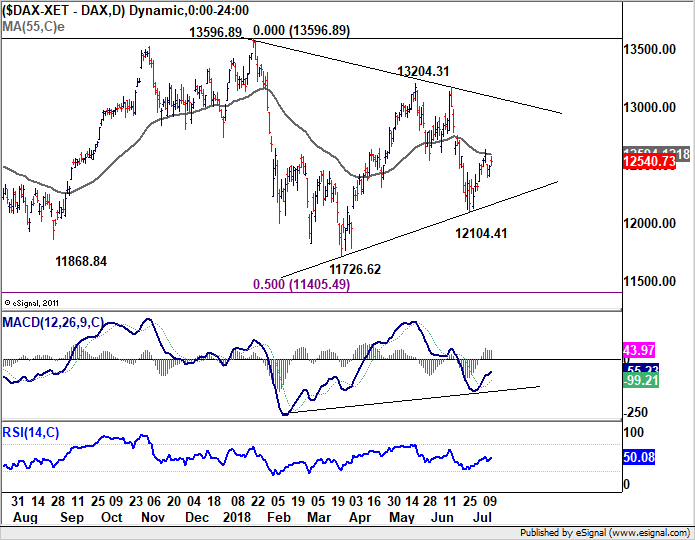
DAX rebound capped by auto tariff risks
German DAX closed the week just up 0.36% and it struggled to break through 55 day MACD so far. Near term outlook is neutral as the index is bounded in converging range since 13596.89. While a break of last week's high at 12837.79 could extend the rebound from 12104.41. Strong resistance will likely be seen below trend line resistance (now at 12583.79). On the downside, a break below last week's low at 12398.47 would likely resume the fall from 13204.31 through 12104.41 support. The development will very much depends on how the US auto tariffs play out.
Nikkei showed promsing momentum
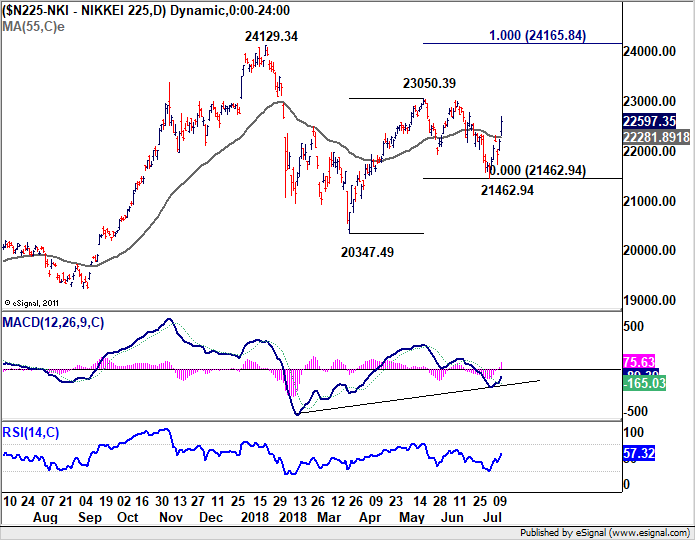
In Asia, the technical development in Nikkei is very promising. The strong break of 55 day EMA suggests that pull back from 23050.39 has completed with three waves down to 21462.94 already. The rebound from 20347.49 looks set to resume. A test on 23050.39 resistance would likely be seen this week. Break will then pave the way to 100% projection of 20347.49 to 23050.39 from 21462.94 at 24165.84, which is close to 24129.34, later in the month on in August. For now, we're not anticipate a strong break of this resistance level yet. And, remember that Japan got no exemptions from US steel tariffs. The upcoming auto tariffs will also have negative impacts on Japanese car makers. So, the momentum above 23050.39 will be closely watched.
China SSE survived tariff threats
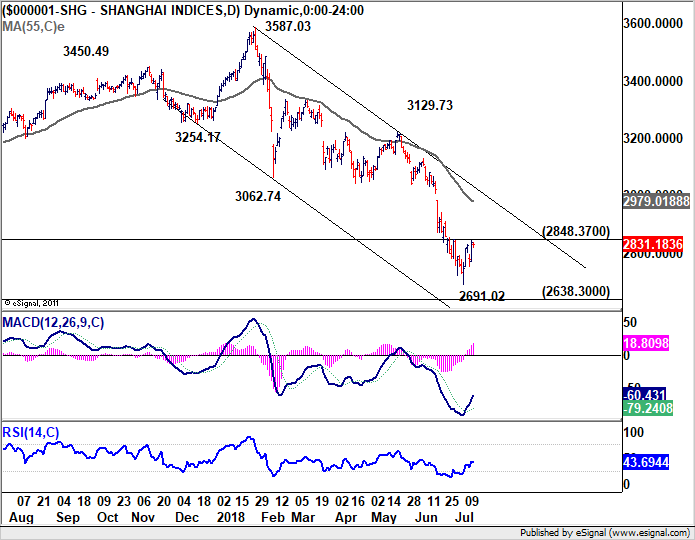
The China Shanghai SSE survived Trump's tariff threat on tariffs. After initial set back it rebounded strongly to close at 2831.18. The development reinforced our view that the support zone between 2016 low at 2638.3 and 2700 psychological level is a very strong one that was defended. For now, further rise is in favor through 2848.37 resistance. In the case, we'd likely see SSE have a go at 55 day EMA (now at 2979.01). But there is no prospect of regaining 3000 handle. Indeed, the Chinese government could start to feel comfortable to harden its trade rhetoric again above 2900. The index should revisit 2638/2700 again before turning around.
DXY failed to break 95.24 but development affirmed underlying bullishness
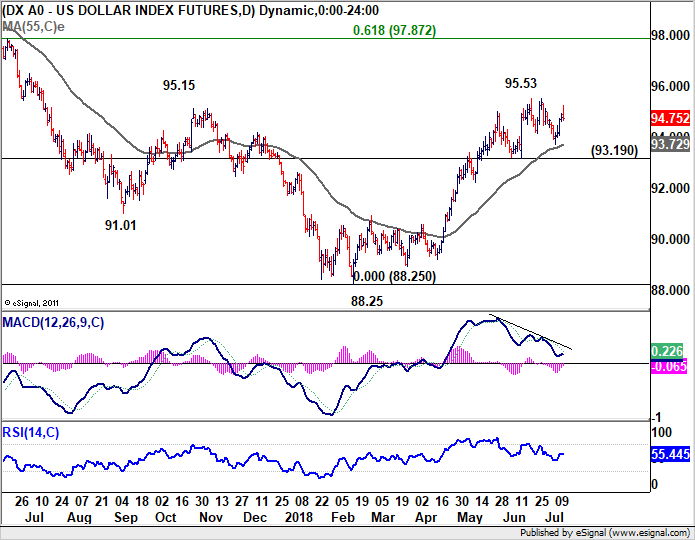
Dollar index drew support above 55 day EMA and rebounded to as high as 95.24. But upside was limited below 95.53 resistance so far. The late Friday sell-off suggests that it's not ready to resume recent rally from 88.25. Nonetheless, recent development affirms the view that price actions from 95.53 are merely corrective and rise from 88.25 isn't over yet. On the upside, break of 95.53 will target 61.8% retracement of 103.82 to 88.25 at 97.87. Though, break of 93.19 will dampen our bullish view and bring deeper pull back.
TNX staying in consoliation with near term upside prospect
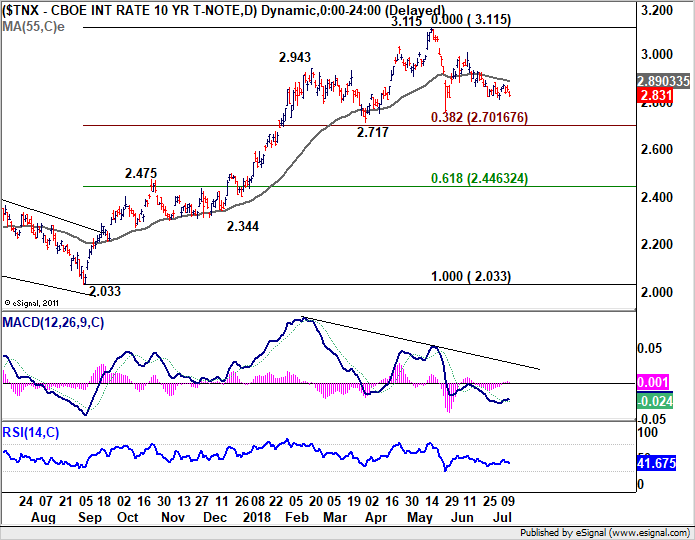
Haven't talk about 10 year yield so a while and it's rightly so. Using BoE Cunliffe's word, there have been some "stodginess" in TNX since May as consolidation continues. So far, the development affirm our view that price actions from 3.115 are corrective in nature. For the near term, considering diminishing downside momentum, there is prospect of a rebound. But there is little sign of upside range breakout yet. And we'd reiterate that 3.0-3.2 represents multi-decade trend defining resistance zone. So it's not that easy to get through. Though, even in case of deeper pull back, we'd expect strong support from 38.2% retracement of 2.033 to 3.115 at 2.701 to contain downside and bring rebound.
Position trading strategy
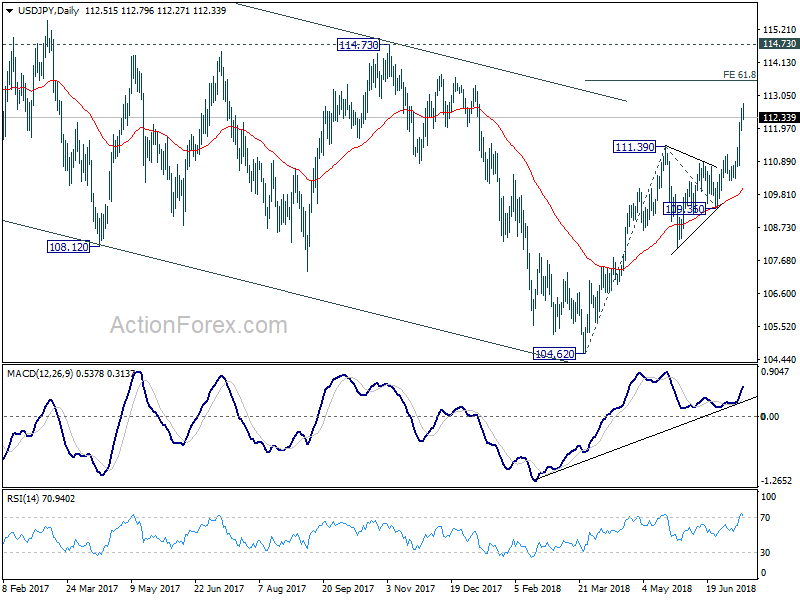
Overall, we'd expect risk appetite to continue in near term even though it may not last too long. Comparing the near term outlook of Asian and European stocks, we'd prefer to sell Yen over Swiss Franc. Dollar is preferred to European and others as it's staying in near term up trend. However, as last week's rally attempt "sort of" failed, we'd choose to buy on a pull-back rather than chase the current rally. We'll try to buy USD/JPY at 38.2% retracement of 110.34 to 112.79 at 111.85, with stop at 111.20, below 61.8% retracement and 4 hour 55 EMA. 114.00 will be the initial target, above 61.8% projection of 104.62 to 111.39 from 109.36 at 113.54 but below 114.73 resistance. We'll monitor the momentum to see whether it can take our 114.73 resistance decisively.
USD/JPY Weekly Outlook
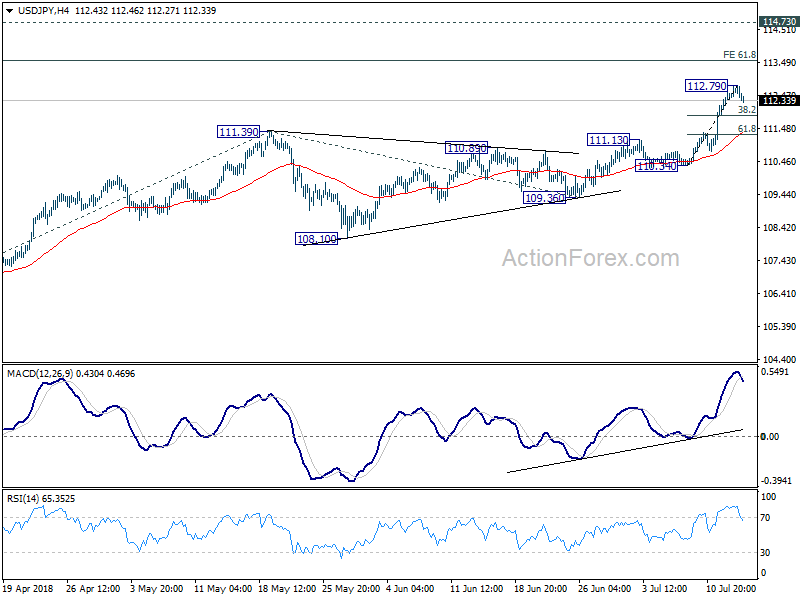
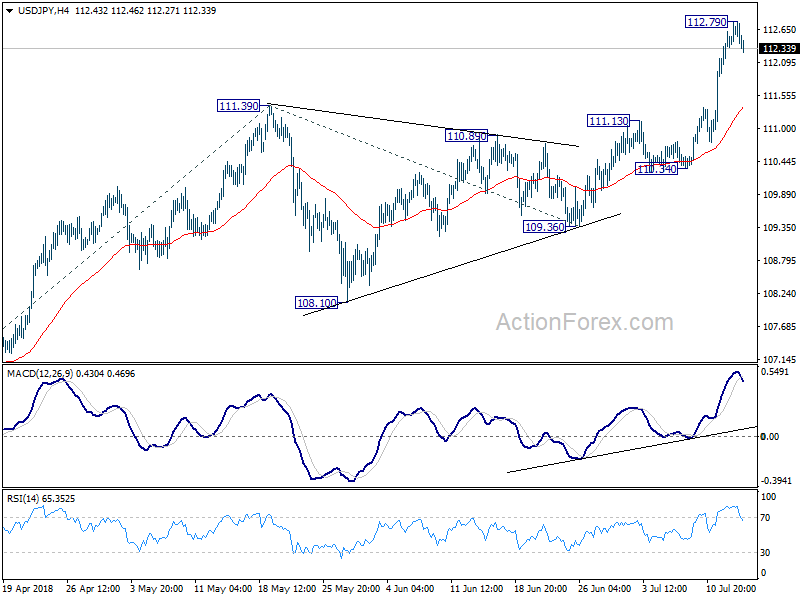
USD/JPY surged to as high as 112.79 last week and formed a temporary top there with subsequent retreat. Initial bias is neutral this week for consolidation first. Downside should be contained well above 111.13 resistance turned support to bring rally resumption. Current development affirms the case of medium term reversal. Above 112.79 will target 61.8% projection of 104.62 to 111.39 from 109.36 at 113.54 first. Break will put focus on 114.73 key resistance for confirming our bullish view.
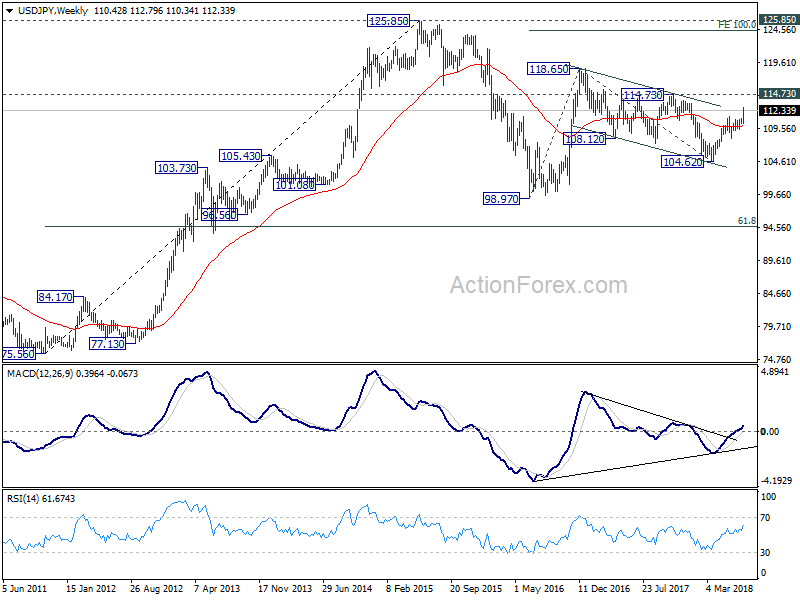
In the bigger picture, current development, with the solid break of medium term channel resistance from 118.65 (2016 high), affirm our view that corrective fall from there has completed with three waves down to 104.62. Decisive break of 114.73 resistance will likely resume whole rally from 98.97 (2016 low) to 100% projection of 98.97 to 118.65 from 104.62 at 124.30, which is reasonably close to 125.85 (2015 high). This will now be the preferred case as long as 119.36 support holds.
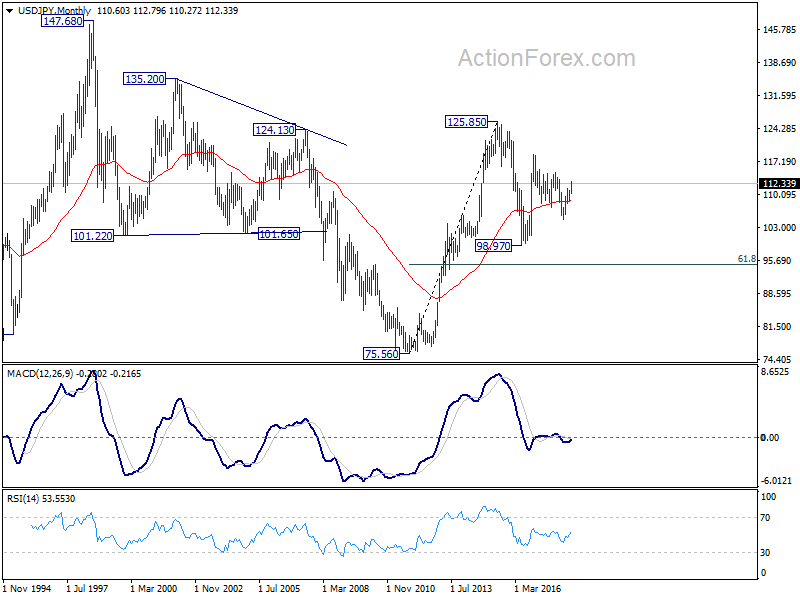
In the long term picture, the rise from 75.56 (2011 low) long term bottom to 125.85 top is viewed as an impulsive move, no change in this view. Price actions from 125.85 are seen as a corrective move which could still extend. In case of deeper fall, downside should be contained by 61.8% retracement of 75.56 to 125.85 at 94.77. Up trend from 75.56 is expected to resume at a later stage for above 135.20/147.68 resistance zone.
Summary 7/16 – 7/20
Monday, Jul 16, 2018
[php_everywhere instance="1"]
Tuesday, Jul 17, 2018
[php_everywhere instance="2"]
Wednesday, Jul 18, 2018
[php_everywhere instance="3"]
Thursday, Jul 19, 2018
[php_everywhere instance="4"]
Friday, Jul 20, 2018
[php_everywhere instance="5"]
Weekly Economic and Financial Commentary: Price Pressures Still Building
U.S. Review
Price Pressures Still Building
- In the midst of tighter labor markets and backlogged supply chains, inflation continued its upward climb in June. Tariff implementation adds upside risk to inflation.
- Producer prices for final demand rose 0.3 percent last month, pushing the year-over-year rate up to 3.4 percent. Similarly, the CPI came in at 2.9 percent on a year-over-year basis in June, marking the strongest pace in over six years.
- After what was otherwise a strong week for inflation data, import prices declined 0.4 percent in June.
Price Pressures Still Building
In the midst of tighter labor markets and backlogged supply chains, inflation continued its upward climb in June. U.S. producers are feeling the burden of tighter supply chains through rising input costs, which suggests added pressure on businesses to eventually pass some of that pricing burden onto consumers.
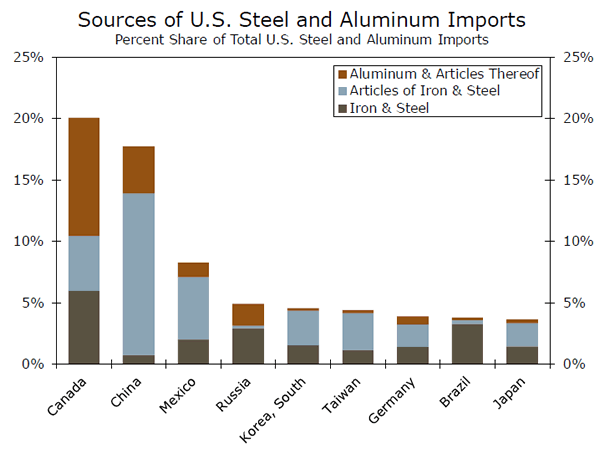
Tariff implementation adds upside risk to inflation. Steel and aluminum tariffs were extended to the European Union, Mexico and Canada on June 1. Manufacturers that transform, or use, metals into intermediate or end products may start to see production costs rise, as Canada is the largest, and Mexico is the third-largest, source of imports for both products (chart on first page). We have begun to see slight effects of tariffs in producer prices, and have potential to see tariffs push consumer prices higher later this year.
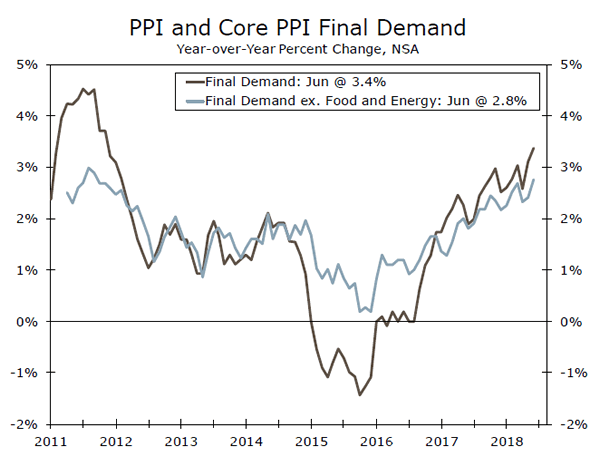
Producer prices for final demand rose 0.3 percent last month, pushing the year-over-year rate up to 3.4 percent, a fresh six-year high (top chart). The gain in producer prices for June suggests underlying price pressures are still building. Higher costs of fuel have caused a rise in transport costs, while the rise in service input prices is yet another indication that the tight labor market is adding pressure to prices. While higher energy prices have led the pickup in producer prices, non-energy materials for manufacturing and construction are up 6.5 percent since last June–steel and aluminum tariffs are likely contributing to this upward push in input costs.
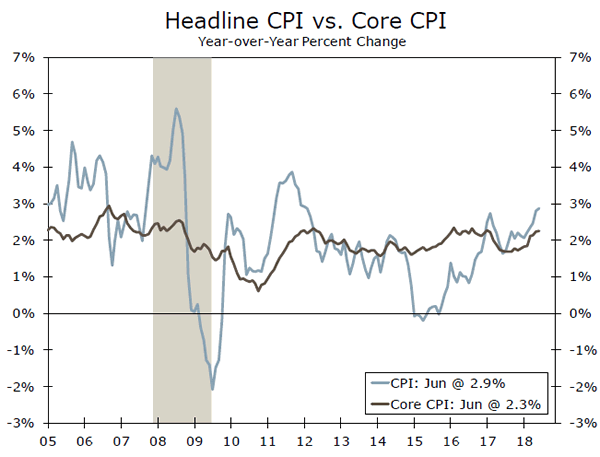
A similar story of rising inflation followed for the consumer. The CPI came in at 2.9 percent on a year-over-year basis in June, marking the strongest pace in over six years (middle chart). The cost of food, shelter and gas have all seen steady gains over the past year. Energy goods, which represent about five percent of the index, led the strength in headline CPI. However, declining costs for electricity and utility gasoline over the past few months suggest this fuel-driven trend may ease in coming months. Core inflation has signaled firming in the underlying trend in inflation has firmed. The core CPI came in at 2.3 percent in June, further support that inflation is at the Fed's target, likely keeping it on track to raise rates twice more this year.
We expect to see core CPI remain near its current rate through the second half of the year. Minimal slack in the economy points to price pressures intensifying. Broadening tariffs, including the possibility of consumer goods getting directly hit, create some upside risk to our inflation forecast of 2.3 percent in Q3.
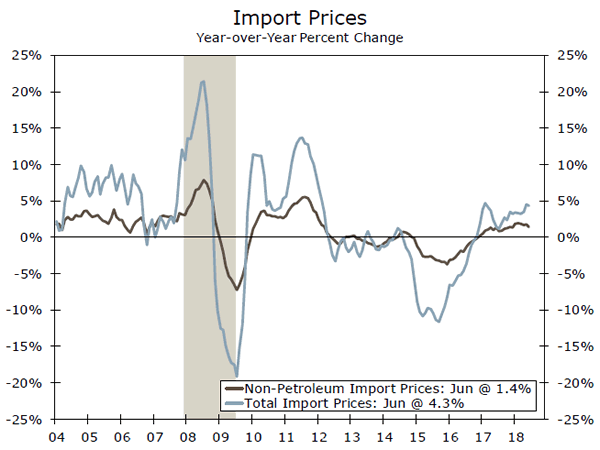
After what was otherwise a strong week for inflation data, import prices declined 0.4 percent in June. So far this year, import price inflation has been subdued due to a stronger dollar and softening in global growth. All major categories of imports posted price declines in the month. It is important to note that tariffs are not included in the import price index, since they are added on later. However, the recent flattening in the underlying pace of import price growth should help ease the final cost burden to purchasers of imports when tariffs are applied.
U.S. Outlook
Retail Sales • Monday
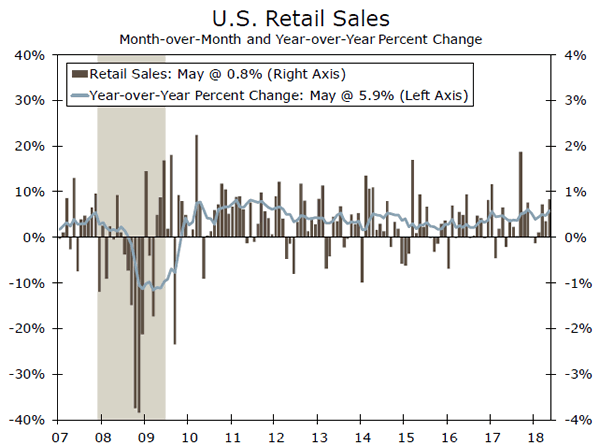
Retail sales came in stronger than expected in May. Sales jumped 0.8 percent, while prior month sales in April were also revised up to a 0.4 percent gain. Gasoline station sales grew 2.0 percent, in part due to rising gas prices. However, even excluding sales at gasoline stations, sales grew at a strong 0.7 percent clip. The strongest sectors in May were miscellaneous stores and building material and garden equipment and supplies dealers, which increased 2.7 and 2.4 percent, respectively. Furniture and home furnishing stores and sporting goods, hobby, and book stores sales declined for the month.
Control group sales, which are used in the calculation of GDP, increased 0.5 percent, while growth in April's index was also revised up from 0.4 percent to 0.6 percent. The strength of May's retail sales, as well as the upward revisions to prior month sales, are consistent with a second quarter rebound in personal consumption expenditures following a relatively weak start to the year.
Previous: 0.8% (Month-over-Month) Wells Fargo: 0.5% Consensus: 0.6%
Industrial Production • Tuesday
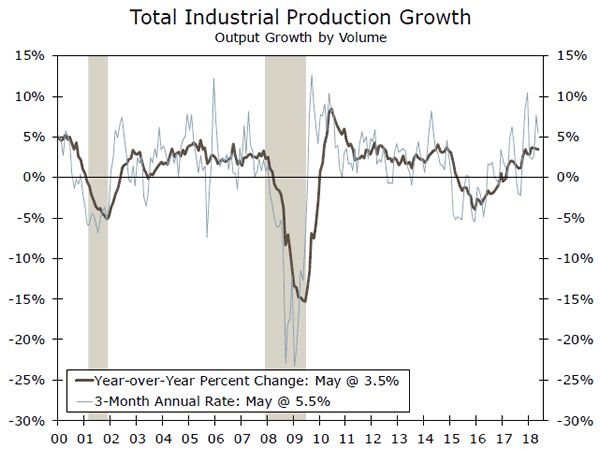
Industrial production dropped 0.1 percent in May, with much of the decline due to a 0.7 percent fall in manufacturing output. Some of the weakness in manufacturing can be attributed to disruptions in the auto sector caused by a major fire at a parts supplier. However, nondurable manufacturing also dropped with declines in a majority of the sub-sectors. Outside of manufacturing, mining and utilities production was stronger in May. Utilities continued to expand and registered a 1.1 percent gain. Higher energy and commodity prices also continued to boost mining activity, which increased 1.8 percent.
Soft measures such as the ISM index, continue to paint a much rosier picture of the factory sector than what is currently being reflected in the hard data. Despite May's overall lackluster report, we continue to expect industrial activity to pick up to a level that is more consistent with the sentiment being expressed through the various manufacturing surveys.
Previous: -0.1% (Month-over-Month) Wells Fargo: 0.5% Consensus: 0.5%
Housing Starts • Wednesday
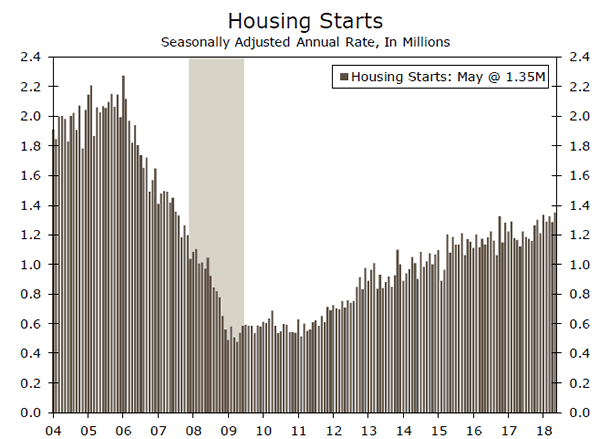
Housing starts increased more than expected in May, rising 5.0 percent to a 1.35 million-unit pace. Single family starts increased 3.9 percent, while multifamily starts grew 7.5 percent. The bulk of new housing starts occurred in the Midwest, which jumped 62.2 percent in May. Meanwhile, starts fell 15 percent in the Northeast. The South, which typically accounts for roughly half of all new starts, declined 0.9 percent. Starts also fell for the second consecutive month in the West, falling 4.1 percent in May. Construction in the West remains exceptionally strong, however, and is up 22.4 percent year-to-date.
Residential construction remains on solid ground and is up 8.9 percent on a year-to-date basis. However, most of May's gain was in the Midwest, and building permits fell 1.2 percent for the month. Tightening supply constraints may be causing delays for smaller homebuilders. We expect housing starts to not be as strong in June.
Previous: 1,350K Wells Fargo: 1,314K Consensus: 1,322K
Global Review
The BoC Tightens Amid Escalating Trade Tensions
- In a week dominated by trade war headlines, the Bank of Canada (BoC) elected to hike its main policy rate 25 basis points for the fourth time in the past year
- In the United Kingdom, data from the production side of the economy broadly signaled a rebound in economic growth in Q2, which should allow the Bank of England (BoE) to raise its main policy rate at its August meeting.
- The big news this week was the United States' decision to initiate a process that could lead to another $200 billion in tariffs on imports from China.
The BoC Tightens Amid Escalating Trade Tensions
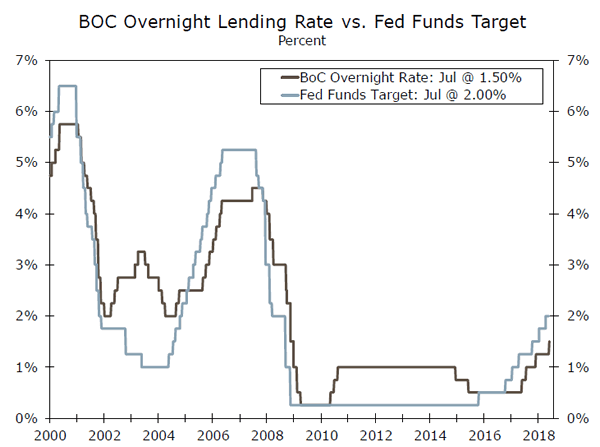
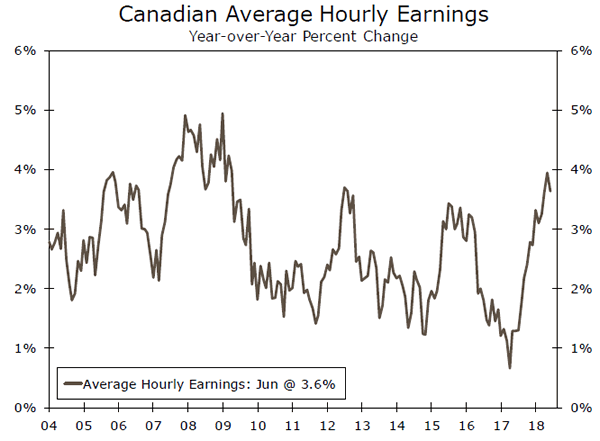
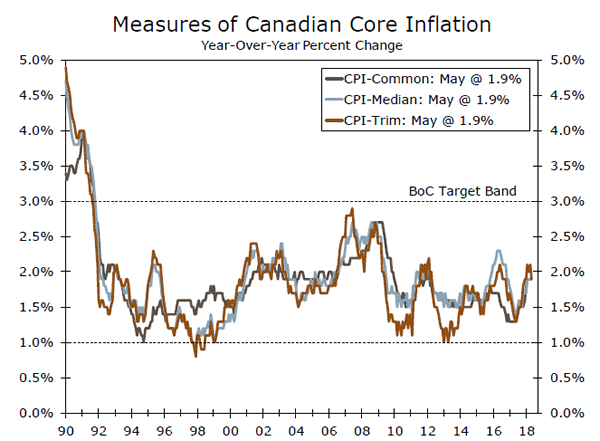
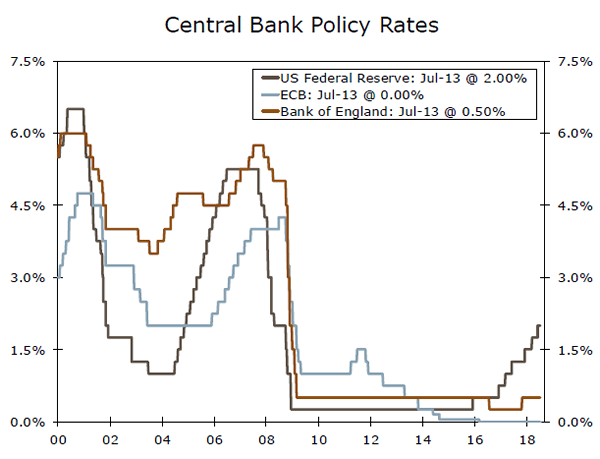
In a week dominated by trade war headlines, the Bank of Canada (BoC) elected to hike its main policy rate 25 basis points for the fourth time in the past year (see chart on front page). Core measures of inflation are near the middle of the BoC's target range, and average hourly earnings growth in May was the highest since 2009 (top chart). Although economic growth has downshifted a bit in recent quarters, the underlying trend at present is enough to gradually reduce any remaining spare capacity in the economy.
Trade uncertainty is the most immediate risk to an otherwise solid outlook for the Canadian economy. The BoC noted in its press release that the effect of trade uncertainty on Canadian investment and exports is likely to be larger than they originally estimated, and that "the possibility of more trade protectionism is the most important threat to global prospects." Canada sent 76 percent of its goods exports to the United States in 2017, and exports make up almost a third of Canadian GDP. Thus, escalating trade tensions with Canada's southern neighbor could have a significant impact on growth. Given the fairly strong fundamentals currently in place, we expect the BoC to hike once more in 2018, but the risks are tilted to the downside in our view.
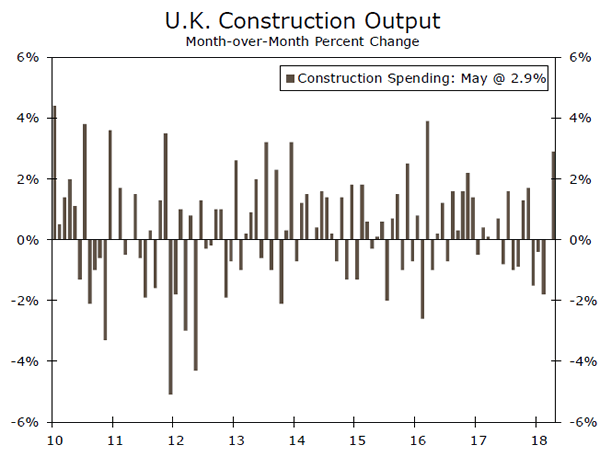
In the United Kingdom, data from the production side of the economy broadly signaled a rebound in economic growth in Q2. Manufacturing output rose 0.4 percent in May, the first positive month-over-month reading since December, and monthly construction output growth rose at the fastest pace since April 2016 (middle chart). A sustained pick-up in construction output in particular would be a welcome sign, as Brexit-related uncertainty likely weighs on this fixed investment sector more than most. With economic growth rebounding and inflation continuing to recede, we look for the Bank of England (BoE) to hike rates at its August meeting. Growth is likely to remain fairly modest, however, and with Brexit lurking in the background, the BoE is likely to undertake any additional tightening at a gradual pace.
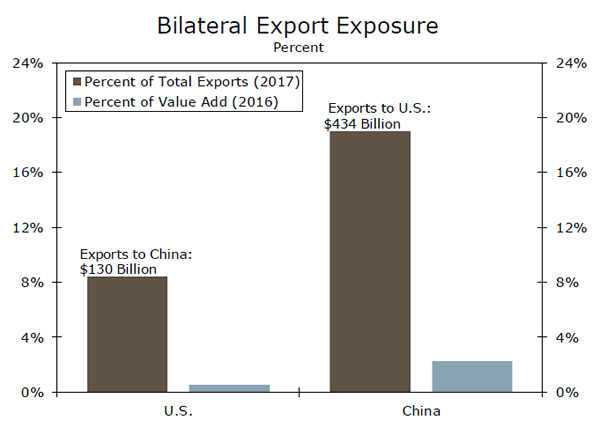
The big news this week was the United States' decision to initiate a process that could lead to another $200 billion in tariffs on imports from China. The trade saga has been ongoing for much of the Trump presidency, and the China-U.S. developments initially began with goods-specific tariffs that impacted China along other countries, such as tariffs on washing machines, solar panels and steel and aluminum imports. In June, the U.S. announced and eventually implemented a country-specific, 25 percent tariff on about $34 billion in Chinese goods, effective July 6. China retaliated in-kind, and tariffs on another $16 billion in Chinese goods are pending over the next few weeks.
It was against this backdrop that President Trump once again upped the ante, as the United States Trade Representative (USTR) proposed an additional 10 percent tariffs on products of China with an annual trade value of approximately $200 billion. Should the United States go through with this proposal, a potential effective date remains unknown, though public hearings for the proposal will occur from August 20-23, making September the earliest the tariffs could likely be imposed.
Global Outlook
China GDP • Monday
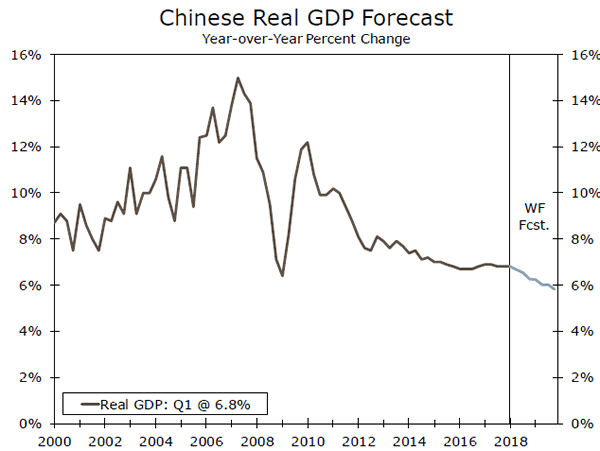
Real GDP in China grew 6.8 percent in Q1 year over year, matching the pace of growth seen in the prior two quarters. However, recent monthly indicators point to a likely slower pace of GDP growth registered in Q2. Retail sales rose just 8.5 percent in May year over year, the slowest pace of growth since 2003, and fixed investment spending grew a similarly slower 6.1 percent, reinforcing the continued downshift in capital-intensive production as the economy continues to move in line with its advanced counterparts.
The Chinese central bank also recently cut its required reserve ratio 50 bps, and this easing of monetary policy along with ongoing trade disputes caused the Chinese renminbi to depreciate markedly against the U.S. dollar in recent weeks. We look for the expansion in China to remain intact, albeit at a slower pace than the double-digit growth rates the economy enjoyed in previous years, and forecast real GDP growth of 6.7 percent in Q2.
Previous: 6.8% (Year-over-Year) Wells Fargo: 6.7% Consensus: 6.7%
United Kingdom CPI • Wednesday
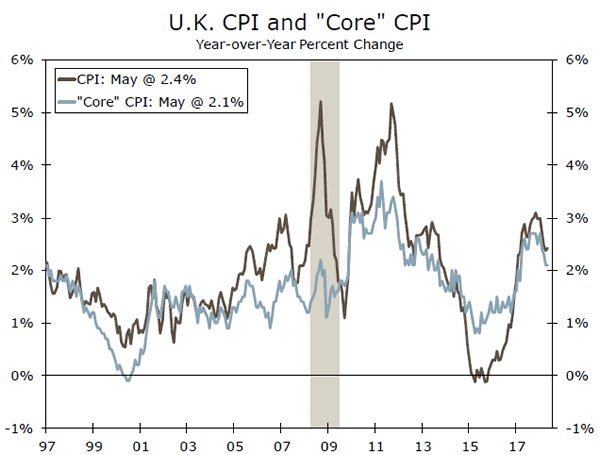
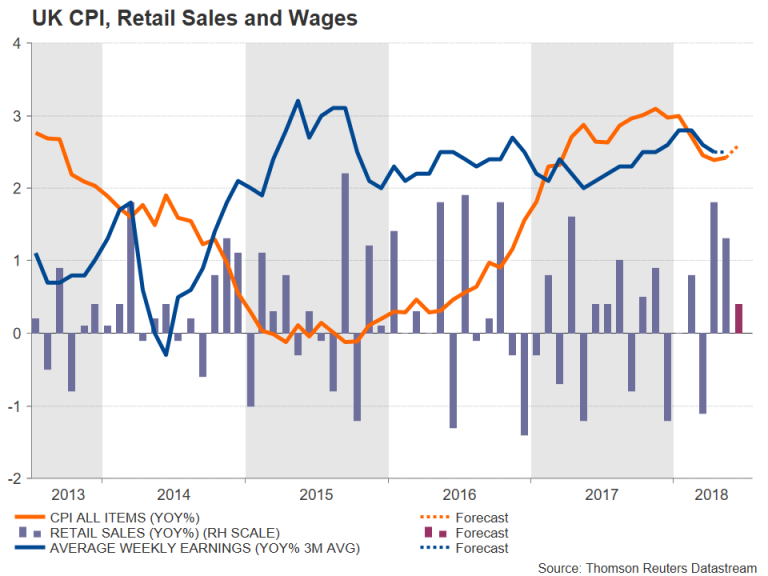
Consumer price inflation has continued its return toward the Bank of England's (BoE) 2 percent target in recent months after surpassing 3 percent in late 2017. As price pressures continue to recede and real income growth slowly returns, consumer spending should also pick up. We may be starting to see evidence of this shift, as retail sales beat consensus estimates and rose 1.3 percent in May month over month, while real wages should also continue their gradual upward trend.
After remaining on hold in May due to weaker-than-expected Q1 data, we look for the BoE to raise rates 25 bps at its August meeting. Although inflation has moved lower and Brexit negotiations remain a concern, the labor market remains tight, and consumer spending looks poised to rebound. These factors should support stronger GDP growth and gradual policy normalization in the coming quarters.
Previous: 2.4% (Year-over-Year) Wells Fargo: 2.5% Consensus: 2.6%
Canada CPI • Friday
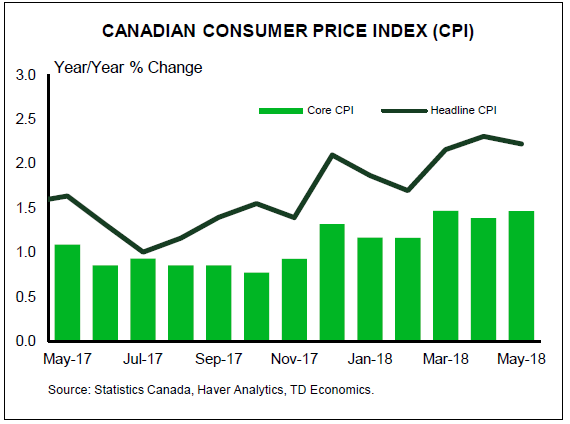
Consumer prices have continued their steady upward trend in Canada, with the CPI rising 2.2 percent most recently in May, year over year. While inflation has been moving higher within the Bank of Canada's (BoC) target band, real GDP downshifted in Q1, growing only 1.3 percent year over year after the breakneck 4 percent pace registered in Q1-2017. But, faster monthly GDP growth so far in Q2 should support GDP growth of more than 2 percent for the quarter.
On-target inflation and other signs that the Canadian economy is operating near full capacity led the BoC to raise its overnight lending rate 25 basis points this week. The Canadian dollar has fallen in the wake of ongoing trade disputes, and new tariffs on U.S. imports will also put upward pressure on prices. Although we acknowledge that trade uncertainties remain, we look for the BoC to hike rates once more this year amid a likely uptick in economic growth and continued upward trend in prices.
Previous: 2.2% (Year-over-Year) Wells Fargo: 2.5%
Point of View
Interest Rate Watch
Tariffs, Inflation and the Fed
Changes to U.S. trade policy are becoming more difficult for central bankers to shrug off as tensions escalate. Last week's minutes from the June FOMC meeting showed "most participants noted that uncertainty and risks associated with trade policy had intensified." That was before the Trump administration this week moved forward with plans to impose tariffs on an additional $200 billion of goods from China.
On the surface, tariffs on a widening array of goods stand to be inflationary for the United States, which would suggest the need for a tighter policy stance by the Fed now that inflation has returned to the FOMC's target. However, the imposition of tariffs would be a one-time level shift in prices. Such one-time changes can lead to a meaningful movement in the price level, but do not result in a sustainably higher rate of inflation that leads the Fed to adjust its policy path.
The temporary effect on inflation will, in all likelihood, lead the FOMC to look through any increase associated with the initial rise in tariffs. The need to look through a tariffrelated bump in inflation would be further fueled by downside risks to the outlook as investment gets shelved and real purchasing power diminishes. As trade concerns have grown, fewer Fed officials believe risks to economic growth are tilted to the downside.
Not So Clear Cut Late Cycle
Looking through a tariff bump in inflation, however, is not likely to be straightforward. Inflation is already poised to rise as capacity has become increasingly strained at this late stage of the cycle. Therefore it could be difficult to disentangle the effects of tariffs from longer-lasting forces.
One way in which tariffs could still end up contributing to such longer-term inflation dynamics is via inflation expectations. Seeing prices pick up may lead consumers and businesses to think there is more inflation to come and influence their willingness to push for higher wages and raise prices. Here too, such willingness may stem from the tight state of the economy, although when it comes to inflation expectations, the distinction is less likely to matter for the Fed.
Credit Market Insights
Government Debt & the Yield Curve
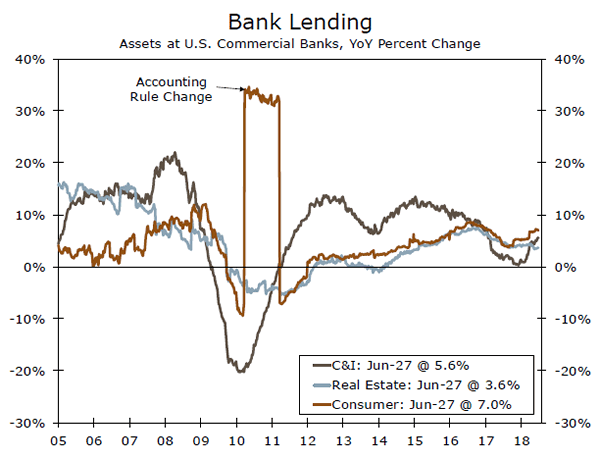
The government debt service ratio in advanced economies' has remained relatively constant since the Great Recession. This is largely due to the low interest rate environment. While low interest rates are typical during a recovery, to encourage private spending and investment, they also decrease the government's cost of stimulating economic activity through debt financing.
Between Q4-2009 and Q4-2012, the aggregate government debt-to-GDP ratio for advanced economies rose 9 percent year over year. However, advanced economies are still financing economic growth by taking on debt, with the government debtto- GDP ratio growing more than 4 percent between Q4-2013 and Q4-2017.
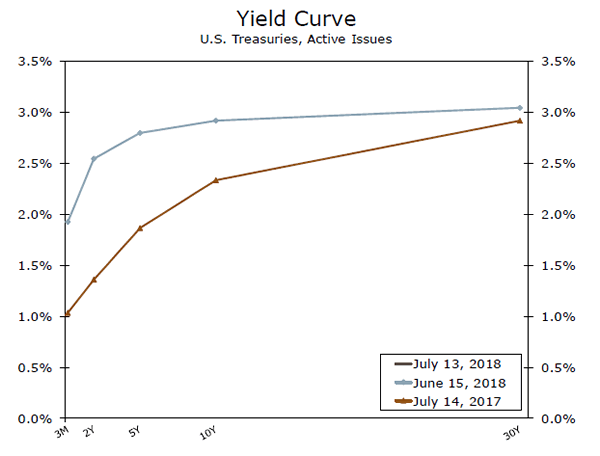
Earlier this week, we released a report examining the yield curve, the implications of its potential inversion and causes behind its flattening. We found a preference for longer-term Treasuries as a possible cause of flattening. One way for countries to finance rising debt is to issue more debt. A study by the OECD* found that countries are focusing issuance on long-term instruments. This extra pressure on longterm yields could also contribute to the flattening of the yield curve.
Looking forward, advanced countries' debtto- GDP ratios remain an area to watch as interest rates continue their upward trend amid a flatter yield curve.
Topic of the Week
Softwood Lumber and Home Prices
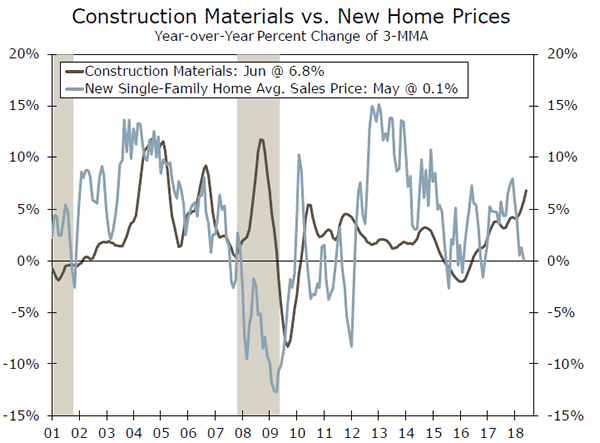
Construction materials prices are up more than 8 percent over the past year, the highest growth rate since late 2008 (top chart). A major factor driving this trend is higher softwood lumber prices, which have jumped since the United States announced final duties of about 20 percent on Canadian softwood lumber imports in November. According to the National Association of Homebuilders, framing and trusses account for the largest share of construction costs for a single-family home, at 16.6 percent. Therefore, rising lumber prices can have a marked effect on the cost of building new homes across the United States.
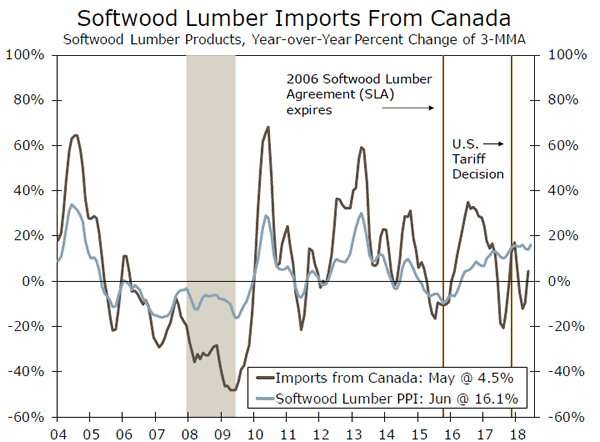
From October to June, wholesale prices for softwood lumber have risen 17 percent (bottom chart). Lumber prices were already rising before tariffs were imposed, due to timber losses from mountain pine beetle, transportation bottlenecks and rising demand from the housing market. However, tariffs also play an important role because of Canada's huge weight in the U.S. lumber market. Canada supplies 90-plus percent of softwood lumber imports to the United States and nearly 30 percent of American lumber consumption. Softwood lumber imports from Canada declined in the first quarter but are up slightly year-to-date; U.S. homebuilders and other purchasers have few alternatives, and have had to swallow price increases.
New homes account for only about 10 percent of U.S. home sales, limiting the impact of construction costs on overall housing prices. However, persistently low inventories of existing homes in the current cycle mean that new homes are an important source of marginal supply, especially in rapidly-growing markets. New home inventory was up 11 percent year-over-year in May compared to a decline of 5.2 percent in existing home inventory. High construction costs and labor shortages, however, are making it harder for builders to provide new supply, particularly at the low end of the market where margins are thinner. Rising interest rates and limited supply of entry-level homes are increasingly standing in the way of first-time homebuyers.
The Weekly Bottom Line: Tariffs Make Fed’s Job Tougher
U.S. Highlights
- For the second week in a row, action on Chinese import tariffs dominated the economic news, but markets remained positive overall, likely reflecting relief that oil prices have come off their recent highs.
- Since China retaliated to the first salvo of U.S. tariffs, the U.S. is moving ahead with the process to impose a further 10% tariffs on $200 bn of Chinese goods, after a two-month consultation period. Tariffs will make the Fed's job of reading inflation signals more difficult.
- So far June CPI data showed inflation rising steadily, as expected. But, it is still too early to see much impact from tariffs in consumer prices
Canadian Highlights
- Canadian markets had a mixed week, as the TSX composite index marked new highs despite soft energy prices that weighed on the loonie.
- The Bank of Canada hiked its key policy rate to 1.50% (from 1.25%). Despite unabated risks facing the economy, the accompanying communication struck an upbeat tone.
- More rate hikes are coming, but until there is meaningful clarity on the international trade environment and household balance sheets, they are likely to be few and far between.
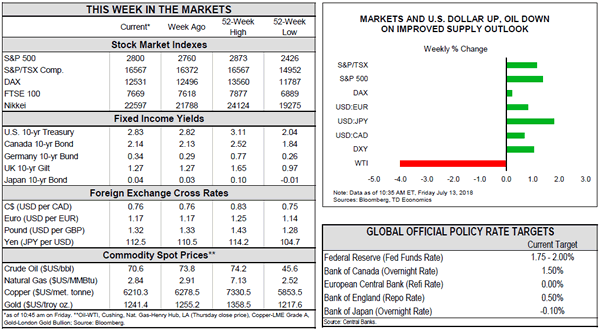
U.S. - Tariffs Make Fed's Job Tougher
For the second week in a row, action on Chinese import tariffs dominated the economic news, in what was a relatively quiet week for data. Markets remained positive overall, despite the headlines, likely reflecting relief that oil prices have come off their recent highs.
President Trump had previously threatened that if China retaliated to the first tranche of U.S. tariffs, he would order further 10% tariffs on $200 bn worth of Chinese imports. China indeed retaliated, and so this week the U.S. Trade Representative (USTR) started the process of making good on this threat by publishing a list of goods which would be subject to a 10% tariff. To be clear, these tariffs are not immediate; they need to go through a two-month process before being enacted. The USTR will hold a public consultation period ending on August 30th.
So far, China has held off on announcing knee-jerk retaliatory tariffs. It remains to be seen what steps China might take. In the meantime, this creates uncertainty for businesses, and likely further volatility in the trade data, as businesses attempt to ramp up shipments ahead of the potential tariffs. In this way, and in prices for many commodities, even potential tariffs have an impact on real economic activity.
These tariffs will raise input prices for many American businesses, but the extent to which they are passed on to consumer prices will depend on the competitive environment of the industry. If businesses can't pass on price increases to their customers (for fear of losing too much market share), they may have to cut costs by reducing staff or planned investments. Both of these actions will crimp growth in the overall economy. If tariffs are fully passed on to consumers you get higher inflation, and slower growth by a different channel. The federal government may mitigate the negative impact by funneling the tax revenues back into the economy.
For the second week in a row, action on Chinese import tariffs dominated the economic news, in what was a relatively quiet week for data. Markets remained positive overall, despite the headlines, likely reflecting relief that oil prices have come off their recent highs.
In a perfect world, the Fed will look through one-time price increases caused by tariffs. However, if tariffs are placed on a wide variety of goods further up the supply chain, it makes it difficult to disentangle how much inflation is due to a hot economy, and how much is the result of tariffs. That raises the risk the Fed misinterprets the inflation signal.
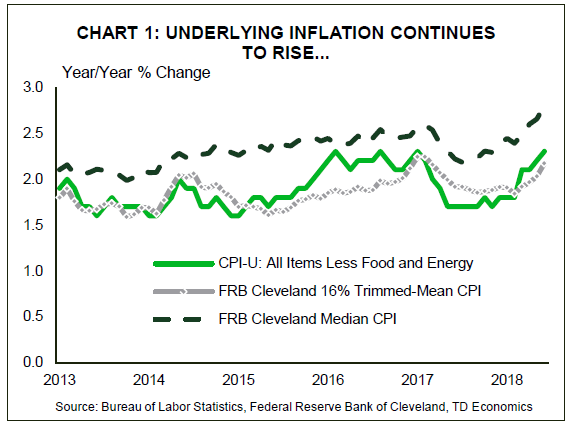
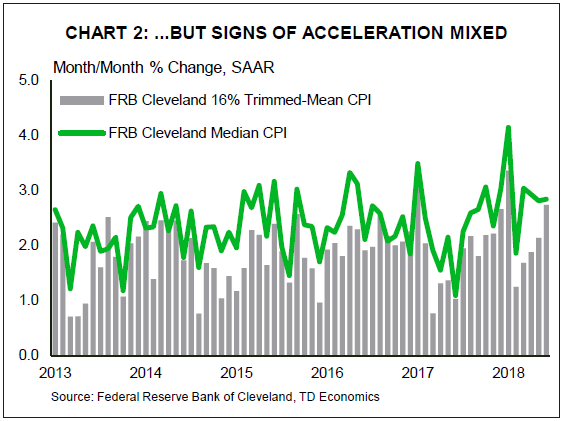
This suggests the Fed is likely to be very cautious. This week's June CPI data was too early to pick out evidence of import tariffs. Overall the data showed yr/yr inflation continued to rise as expected, reaching 2.9% (Chart 1). Core inflation was 2.3% yr/yr, having risen steadily for the past year. The upswing in annual inflation in part reflects comparisons to low readings last year. Monthly increases look steadier (Chart 2), with little acceleration in June.
Next week Chair Powell testifies before Congress on the economy. It should have been a straightforward good news story of a strong economy, with inflation rising in a non-threatening way and gradual increases in interest rates. Now, he is likely to face questions on the impacts of tariffs, which are both uncertain and hard to forecast.
Canada - Poloz Pulls the Trigger, Path Forward Still Cloudy
Who said summer was boring? There was lots of excitement to be had this week. The Bank of Canada's rate hike on Wednesday sent the loonie higher in its immediate aftermath. The gain was not to last however, as oil prices fell later that day, with the benchmark WTI contract set to end the week down about U.S. $4 per barrel. Oil outweighed rates when it came to the loonie, which looks set to close out the week below 76 cents U.S. at the time of writing – a drop of about half a cent from Monday's market open. Despite all of these developments, the S&P/TSX, while choppy, made an all-time high on Tuesday, followed by several through the day on Thursday.
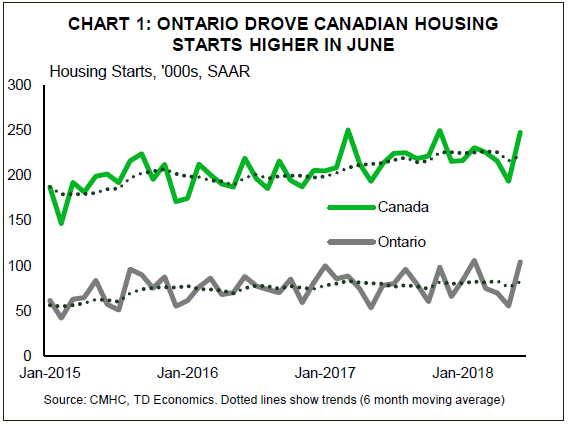
On the economic front, Tuesday saw housing starts data for June, which saw activity bounce back to hit 248k (at an annual pace). Driving the gain was a sizeable increase in multi-family activity, with Ontario in the driver's seat (Chart 1). How much of the elevated activity of late can be put down to condo pre-sales during earlier, hotter markets remains to be seen, but decent building permit figures suggest that builders will keep breaking ground.
Of course, the main event was the Bank of Canada's rate decision on Wednesday, where the policy interest rate was taken higher for a fourth time in a year, to 1.50%. Nearly all of the communication from the Bank of Canada struck an upbeat tone and the growth outlook was upgraded, somewhat surprising given the risks to the Canadian economy. The improved view on growth came despite the incorporation of additional drag on trade and investment due to trade policy uncertainty, suggesting that the Bank sees a robust underlying economy.
In a normal world, this sort of communication and outlook would be a signal that more tightening is imminent. Additional rate hikes are likely, but will probably be well spaced out. The speed limiter comes down to two key factors. Domestically, the sensitivity of highly indebted households to rate hikes remains an open question. Our research suggests that each rate hike, all else equal, has about a 30% larger impact on household finances than a decade earlier. This appears to be borne out in the credit and consumer spending data, which have decelerated markedly this year, but with mortgage rule changes muddying the water, it is hard to be 100% sure.
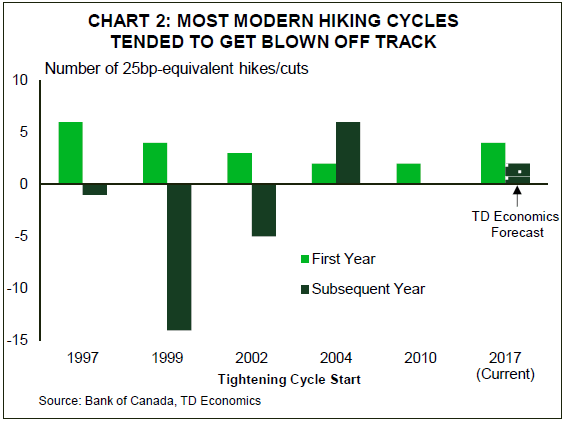
The other factor is President Trump. The President's visit to Europe and the UK this week provided more evidence of the scant regard in which he appears to hold longstanding relationships, trade or otherwise. We still have little reason to expect a speedy resolution of NAFTA negotiations, and at the same time, U.S.-China trade tensions continue to heat up. Extreme events, such as a NAFTA dissolution or auto tariffs, fortunately remain outside risks, but if one treats monetary policy as a risk setting exercise – as Poloz has indicated he does – these risks surely must be taken into account. Indeed, the history of the Bank of Canada under inflation targeting has largely been one of rate tightening cycles blown off course by external events (Chart 2). Monetary policy cannot address structural factors, but it can help the adjustment. So until we have more resolution on the external environment (and a better picture of household balance sheet dynamics), caution should rule the day.
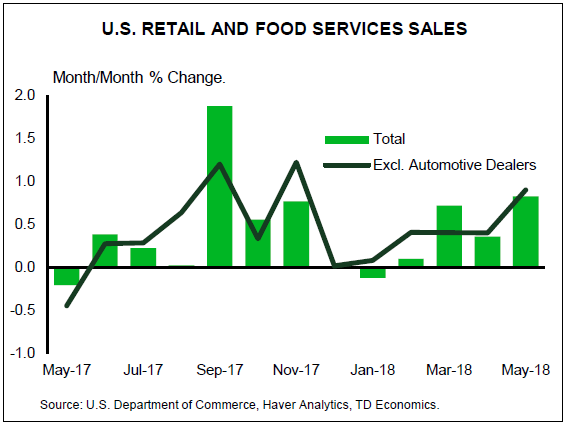
U.S.: Upcoming Key Economic Releases
U.S. Retail Sales - June
Release Date: July 16, 2018
Previous: 0.8%, ex-auto: 0.9%, control group: 0.5%
TD Forecast: 0.4%, ex-auto 0.2%, control group: 0.4%
Consensus: 0.5%, ex-auto 0.4%, control group: 0.4%
We look for a 0.4% rise in both headline and core retail sales, as core sales moderate after a long string of strong increases. This should still leave Q2 real consumer spending tracking near a 2.5% pace.
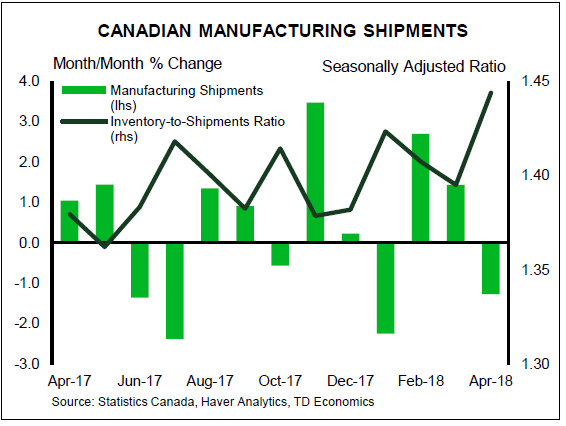
Canada: Upcoming Key Economic Releases
Canadian Manufacturing Sales - May
Release Date: July 17, 2018
Previous: -1.3% m/m
TD Forecast: 0.5% m/m
Consensus: N/A
TD looks for manufacturing sales to post a 0.5% advance for May. Energy production should post a partial rebound after refinery shutdowns led to an 11% pullback in petroleum shipments for April. However, this will be offset by weaker auto production amid supply chain disruptions, which shaved 5% off May exports. Outside these two industries we look for a broad advance in activity, consistent with robust survey data. However, real manufacturing sales should see little change after accounting for the rise in factory prices.
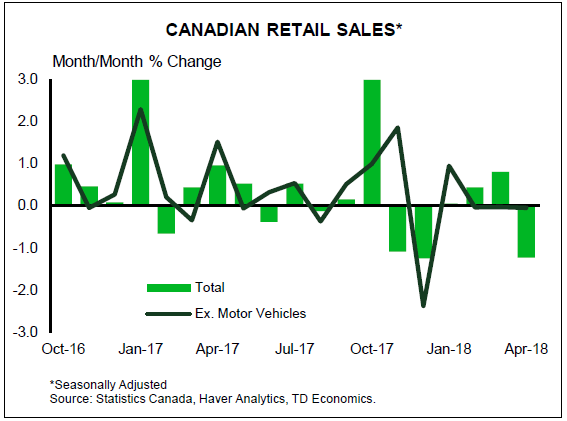
Canadian Retail Sales - May
Release Date: July 20, 2018
Previous: -1.2%, ex-auto: -0.1%
TD Forecast: 1.3%, ex-auto: 0.5%
Consensus: N/A
Retail sales should rebound by 1.3% in May, with motor vehicle sales leading the advance after severe weather led to a sharp pullback in April. As a result, sales ex-autos should post a more modest 0.5% gain Motor vehicle sales are unlikely to recover fully from April given a steady deceleration in credit growth, but should nonetheless provide a significant tailwind to the headline print. Gasoline station sales will also make a positive contribution on higher prices, while volumes should benefit from the return to more favourable weather and driving conditions. Outside of these two components we look for a moderate expansion in retail activity as the healthy labour market and early signs of stabilization in housing allow consumers to loosen their purse strings. Meanwhile, real retail sales should come in near the nominal print owing to the modest increase in consumer prices for May.
Canadian Consumer Price Index - June
Release Date: July 20, 2018
Previous: 0.1% m/m, 2.2% y/y, Index: 133.4
TD Forecast: 0.0% m/m, 2.3% y/y, Index: 133.4
Consensus: N/A
We expect headline CPI to inch higher to 2.3% y/y, with prices flat on the month. Energy prices were lower on the month on a pullback in gasoline prices but will be a net boost on a y/y basis and exchange rate pass-through is also a tailwind. In general we view risks to the report as skewed to the upside after protracted weakness in core categories. CPIXFE in particular registered flat to lower m/m reads over the prior two months partly on one-offs. As a result, exclusion based measures will continue to underperform the BoC core measures, which remain near 2.0%. Looking ahead, we expect CPI to be range bound in the low 2s into Q3.
Trade War and Trump European Trip Boost US Dollar
The US dollar was higher across the board against major pairs on Friday. Trade war concerns rose heading into the weekend and the comments from US President Donald Trump during the week sparked a rally of USD buying. Trump has been outspoken on NATO, trade and the Brexit deal while economic indicators and the US Fed have been supportive of the greenback. The Trump administration has said that it would add 10 percent tariffs on additional $200 billion Chinese goods if the Asian nation retaliates. U.S. Federal Reserve Chair Jerome Powell highlights the week with his semi annual testimonies.
- US retail sales expected to slow down
- Fed Chair Powell to testify before congress and senate committees
- Canadian inflation and retail sales data out on Friday
Dollar Firmer on Trade Tensions and Fed Comments
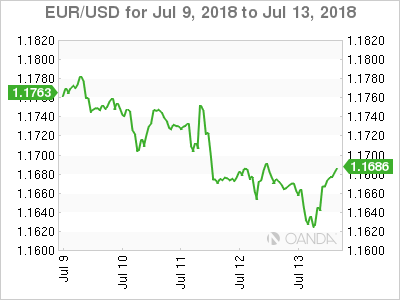
The EUR/USD fell 0.80 in the last five sessions. The single currency is trading at 1.1648 after the EUR lost ground int he first four days of the week, only to mount a half hearted recovery on Friday. The pair started the week trading at 1.1763 and will close at 1.1685. Hawkish Fed member rhetoric and strong inflation indicators in the US did their part on the fundamental side, but with geopolitics playing such an important part the focus of investors was on the ongoing trade war with China. The USD became a safe haven and attracted flows looking to hedge against uncertainty.
The U.S. Federal Reserve has lifted interest rates twice already in 2018 and Fed members have been out in numbers endorsing one or two more additional hikes. The tone of the testimonies from Chair Powell to the congress and senate committees will guide the currency.
European inflation data will be released on Wednesday and is expected to remain steady at 2.0 percent. US retail sales data is expected to drop to a small gain of 0.4 percent but the emphasis will be on Fed Chair Powell’s testimony alongside other member comments during the week. The G20 financial summit will be held in Buenos Aires starting on Friday, July 20 which will be interning as trade spats have escalated to tariff wars but have yet to fully impact global markets.
Yen Loses Safe Haven Appeal
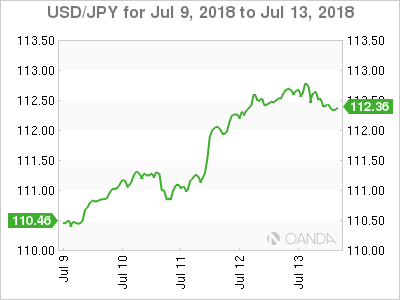
The USD/JPY gained 1.83 percent during the week. The currency pair is trading at 112.47 with the yen one of the biggest losers against the USD in the past five sessions. The Japanese currency shed its safe haven status as a major source of its exports has been targeted in the trade wars (auto) and the US yield curve flattening making the greenback a more attractive destination.
Bank of Canada Hike Can’t Compete with Trade Concerns
The USD/CAD gained 0.65 percent in the last five days. The currency pair is trading at 1.3174 even after the Bank of Canada (BoC) made the benchmark interest rate 25 basis points higher on Wednesday. The official rate is now 1.50 percent, closing the gap with the Fed funds rate alongside some hawkish forecasts of the economy by Governor Poloz.
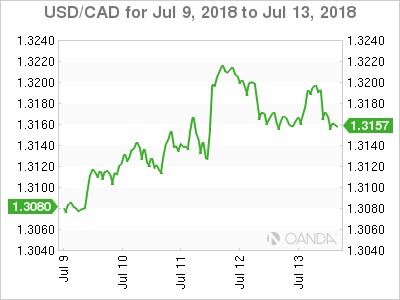
The main headwind for the loonie has been the current geopolitical climate, trade in particular. The Canadian economy is heavily dependant on its relationship with the US and the Trump administration has been pushing for a deep NAFTA renegotiation in exchange to exempt Canada form other tariffs.
The loonie got little support from oil prices with West Texas Intermediate falling since the higher than expected supplies coming online. The weekly inventories posted a large drawdown, but ends of disruption in Libya and a softer stance on Iranian oil by the US is pushing crude prices down. US officials are considering dipping into the oil receiver to prevent a sharp price increase.
Brexit Pressure and Trump Comments Take Down Pound
The GBP/USD lost 0.81 percent in the last week. The currency pair is trading at 1.3178 in the aftermath of a softer Brexit plan drafted by Prime Minister Theresa May was published. The strategy has already resulted in multiple resignations from hard line Brexiteers in May’s government but so far has been short on details. The EU withdrawal bill will be voted next week and then the UK government will sit down with the EU to keep hashing out the Brexit negotiation
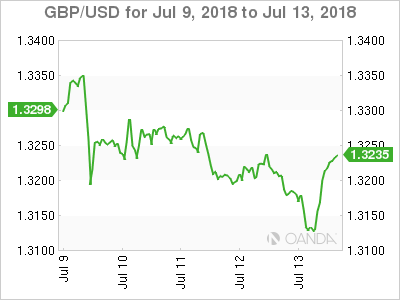
UK data will be released that could end up putting the Bank of England (BoE) August rate hike out of reach. Labor data, inflation and retail sales are all due during the week. The Brexit negotiation continues to be a bumpy ride and that is only on the domestic side, EU negotiators might not agree with May’s promises back home regardless of the political cost.
Sunday, July 15
- 10:00pm CNY GDP q/y
Monday, July 16
- 8:30am USD Core Retail Sales m/m
- USD Retail Sales m/m
- 6:45pm NZD CPI q/q
- 9:30pm AUD Monetary Policy Meeting Minutes
Tuesday, July 17
- 4:30am GBP Average Earnings Index 3m/y
- 4:30am GBP BOE Gov Carney Speaks
- 10:00am USD Fed Chair Powell Testifies
Wednesday, July 18
- 4:30am GBP CPI y/y
- 8:30am USD Building Permits
- 10:00am USD Fed Chair Powell Testifies
- 10:30am USD Crude Oil Inventories
- 9:30pm AUD Employment Change
Thursday, July 19
- 4:30am GBP Retail Sales m/m
Friday, July 20
- 8:30am CAD CPI m/m
- 8:30am CAD Core Retail Sales m/m
Sterling recovers as UK-US trade deal is back on track
Trump said in a joint press conference with UK Prime Minister Theresa May that "we agreed today that as the U.K. leaves the EU we will pursue an ambitious U.S.-U.K. trade deal." And he added that "the United States looks forward to finalizing a great bilateral trade deal" with the UK."
Regarding Brexit negotiation, Trump said it's "not an easy negotiation to be sure" and the deal UK reached "is OK with me". He added "just make sure we can trade together."
Trump called the Sun story "generally fine" but some of his comments were left out. He noted "I said very good things about her" in the interview". May is a "total professional". Trump also said "when I saw her this morning I said, 'I want to apologize, because I said such good things about you."
Sterling recovers strongly ahead of weekly close.
Week Ahead – China GDP Eyed amid Escalating Trade Row; Inflation Data to Dominate
China will publish second quarter growth figures next week, putting the focus on China’s economy which has been under attack by the Trump administration. Inflation numbers from Canada, Japan, New Zealand and the United Kingdom will also come under the spotlight, as well as employment reports out of Australia and the UK. It will be a quieter week for the United States where only a handful of releases are due, but investors will be watching for President Trump’s next move in his trade fight with the rest of the world.
Aussie and kiwi look to domestic data for support
The Australian and New Zealand dollars are still reeling near roughly two-year lows that were plumbed early last week ahead of the enaction of the first round of tariffs on Chinese imports by the US. The two antipodean currencies had already been under downside pressure for much of the year on the back of the narrowing and now negative yield spread with the US. With both the Reserve Bank of Australia and the Reserve Bank of New Zealand set to stay on hold for some time yet, it will require a significant shift in the inflation outlook in the respective countries to bring the two central banks out of neutral mode.
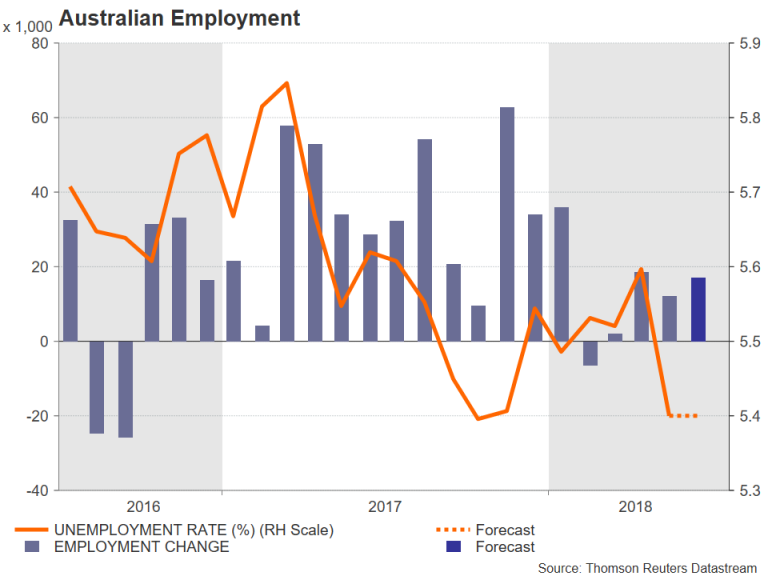
New Zealand will see the release of quarterly inflation data on Tuesday pertaining to the April-June quarter. Given the weakening growth picture in the country in recent months and with annual CPI falling near the bottom end of the RBNZ’s 1-3% target band during the first quarter, a disappointing inflation reading for the second quarter would raise the prospect of the next change in rates being a cut than an increase. In Australia, the RBA will publish the minutes of its June policy meeting on Tuesday, and employment figures will follow on Thursday. While the growth outlook in Australia is stronger than across the Tasman Sea, inflationary pressures remain low. A tightening labour market has so far not done much in pushing up wages. But a further expected improvement in employment in June would reassure investors that wage growth should pick up over time.
Chinese growth expected to soften in Q2
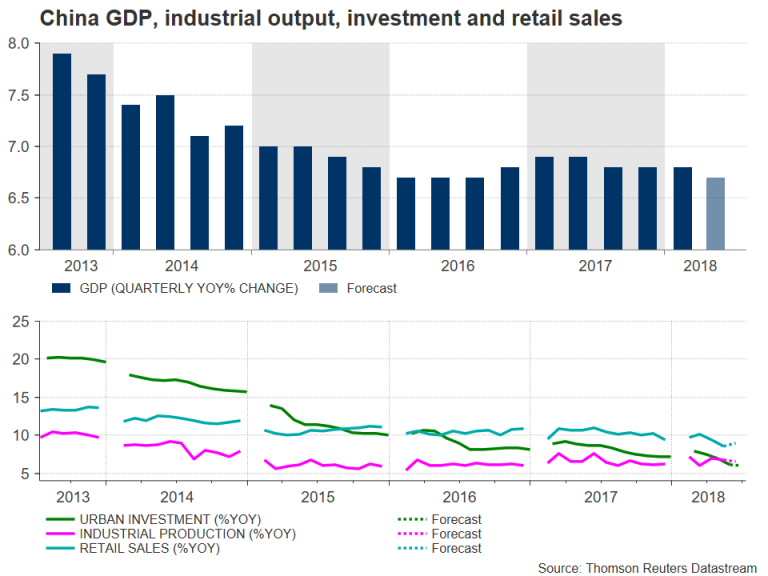
China will be the first among the large economies to publish second quarter growth data next week. The GDP numbers due on Monday are forecast to show growth slowing from 6.8% to 6.7% year-on-year in the three months to June. That would make it the mildest pace of expansion since the third quarter of 2016. However, while the trade dispute with the US has been simmering for the past few months, it’s too early for there to be a notable impact from the US tariffs already in place and any slowdown would be down to the government’s deleveraging efforts and crackdown on risky lending. These effects can already be seen in weaker investment readings. Fixed asset investment slowed to an annual rate of 6.1% between January-May, the lowest since 1996. It is expected to slow further in June to 6.0% in figures to be released alongside the GDP report. Completing Monday’s set of data from China will be industrial output and retail sales numbers for June.
Japanese inflation stuck below 1%
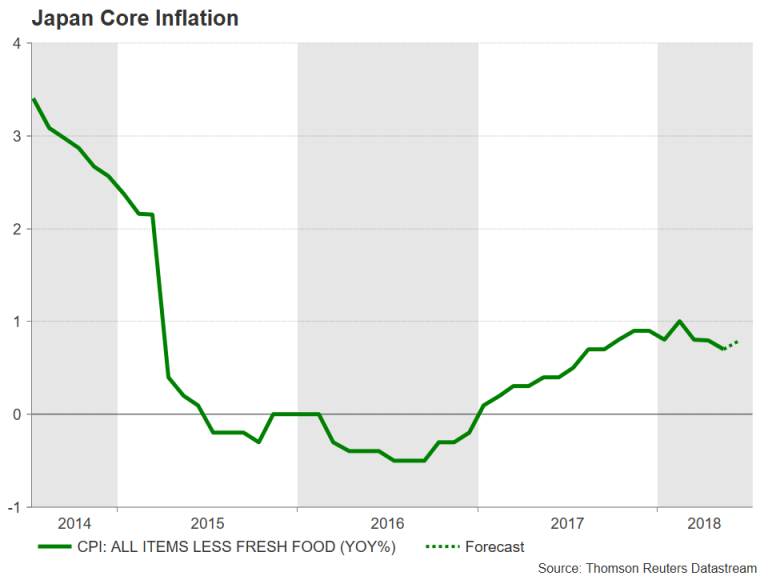
The Bank of Japan’s progress in lifting inflation towards its 2% goal has stalled in recent months. After hitting a 3-year high of 1% in February, the 12-month rate of core CPI has since eased to 0.7%. It is forecast to tick higher in June to 0.8%. But the snail’s pace progress means the BoJ will stick on the course of ultra-loose monetary policy for a while longer. The inflation figures are due on Friday and ahead of that on Thursday, June trade numbers will be released. Japanese export growth rebounded sharply in April and May following a dip in the first quarter. Another strong reading in June would be further confirmation of a return to positive growth in the second quarter.
Last major data from UK before BoE meeting
The Eurozone and the UK will also see inflation figures next week, though with the Eurozone ones being the final readings, they’re not anticipated to attract much attention. Headline inflation in the euro area accelerated to 2% in the preliminary print and no revision is expected on Wednesday. It’s been a somewhat different story in the UK where inflation has been above 2% since 2017 and has surprised many analysts as well as policymakers by the pace at which it’s declined after it shot to 3.1% late last year following the pound’s deprecation from the Brexit referendum in 2016. However, UK inflation data due on Wednesday are forecast to show the CPI rate turning higher again, rising to 2.6% year-on-year in June from 2.4% in May. The core rate is also expected to edge up, by 0.1 percentage points to 2.2%.
Other data to watch out of the UK are Tuesday’s labour market report and Thursday’s retail sales numbers. Britain’s unemployment rate is forecast to remain unchanged at 4.2% and average weekly earnings are also anticipated to hold steady at 2.5% y/y in the three months to May. Retail sales meanwhile are expected to moderate in June, with sales growing by 0.4% month-on-month compared with 1.3% in the prior month.
The three reports will be the last major indicators for the Bank of England to gauge before its August 2 policy meeting. A strong set of figures will therefore be seen as boosting the chances of a rate hike and would lift the pound.
Fed Chairman Powell testifies
The inflation theme will continue with Canada, while there will also be more retail sales data to sift through, with both Canada and the US reporting their monthly series. The Canadian and retail sales numbers are due on Friday but with the Bank of Canada’s rate hike out of the way and the developments in the oil market, the data may not prove a significant driver for the Canadian dollar.
In the US, the retail sales release on Monday will be the main highlight. Retail sales are forecast to rise by 0.5% m/m in June, less than the 0.8% growth in May but nevertheless representing another solid pace. On Tuesday, the focus will be on industrial and manufacturing production figures, which are expected to show a rebound in June after a contraction in May. Building permits and housing starts for June are due on Wednesday, and on Thursday, the Philly Fed manufacturing index will round up the week.
Positive surprises, particularly in the retail sales numbers, could help the US dollar extend its gains beyond this week’s 6-month high of 112.79 yen. However, a bigger risk for the greenback is likely to be Fed Chairman Jerome Powell’s testimony before Congress on Tuesday, where he will give his latest monetary policy assessment to US lawmakers. Investors will be watching if the Fed is becoming concerned about overshooting its inflation target and whether the central bank is worried about the impact of the escalating trade tensions on the US economy.
Australia & New Zealand Weekly: Non-Mining Infrastructure Upswing Has Considerable Further Upside …
Week beginning 16 July 2018
- Non-mining infrastructure upswing has considerable further upside.
- Australia: Westpac-MI Leading Index, RBA minutes, employment.
- NZ: CPI, REINZ house sales & prices.
- China: GDP.
- US: Fed Chair Powell's semi-annual testimony to congress, retail sales.
- Key economic & financial forecasts.
Information contained in this report current as at 13 July 2018.
Non-Mining Infrastructure Upswing Has Considerable Further Upside ...
The non-mining infrastructure construction sector is a key growth driver of the Australian economy. This includes projects in both the public and private sectors. Here we gauge the current momentum in activity and assess prospects for 2018 and 2019.
This is a timely update with the round of annual state budgets now complete (with the exception of South Australia, where the budget was delayed due to the recent state election).
Hereafter reference is to non-mining infrastructure, unless stated otherwise.
The backdrop is that Australia is playing catch-up, investing in much needed infrastructure, particularly in the capital cities. This follows an extended period of under investment, in part crowded out by the mining boom and then delayed post the GFC as governments for a time focused on fiscal repair and showed a lack of appetite for additional borrowings to fund such spending. More recently, the states have made greater use of their existing balance sheets to assist with funding of projects.
The pressing need for additional infrastructure has been compounded by rapid population growth, with increases well in excess of expectations - creating growing pains in our two largest capital cities of Sydney and Melbourne.
Infrastructure activity undertaken in the March quarter was valued at $16.5bn, directly representing 3.8% of the economy. To place this in context, infrastructure eclipses new home building activity, which was $16.2bn in March and the gap is set to widen.
Infrastructure: a roller-coaster ride since 2012
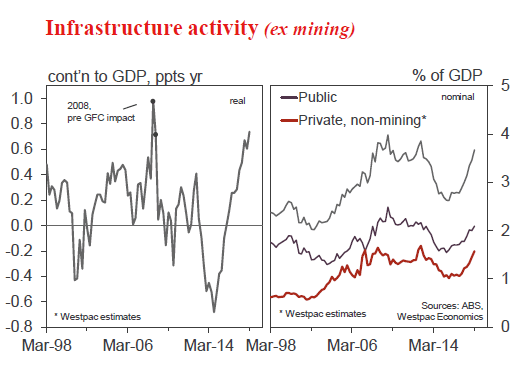
The five year period from 2012 was a roller-coaster ride for the infrastructure sector. Activity weakened from the end of 2012 through to mid-2015, with a peak-to-trough decline of almost one-third. Subsequently, infrastructure activity rebounded sharply. Work surged by 23% over the year to March 2018 and is now 54% above the low of mid-2015, to be 6% above the earlier peak.
These large swings in activity materially impacted overall economic growth. The infrastructure drag at its largest was a subtraction of 0.6ppts from annual GDP growth in mid-2014. The sharp turnaround has seen infrastructure activity directly add 0.75ppts to GDP growth over the past year. That is, the sector (which is a little less than 4% of the economy) directly accounted for 25% of all economic growth over the past year.
By way of historical experience, with the exception of a shortlived spike in 2008, ahead of the GFC impact, this is by far the largest direct boost to activity from infrastructure activity (see chart opposite). Earlier peak contributions are in the order of 0.4-0.5ppts, such as in 2004, 2005 and 2012.
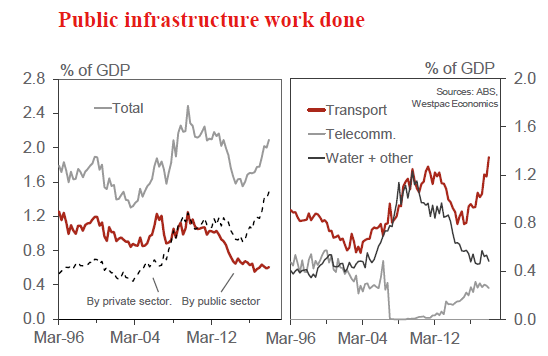
Infrastructure investment spans a number of segments. Typically, projects are focused on transport, telecommunications, electricity generation, as well as water & sewerage. There are spill-over effects from the public sector to private non-mining investment, most clearly with some projects undertaken as PPPs, Public Private Partnerships.
Over the past year, the upswing in infrastructure activity has been concentrated in transport projects (accounting for 56% of the total increase, the bulk of which are public works) and electricity (responsible for 30% of the rise, largely in the private sector), while water and sewerage accounted for 10% of the lift.
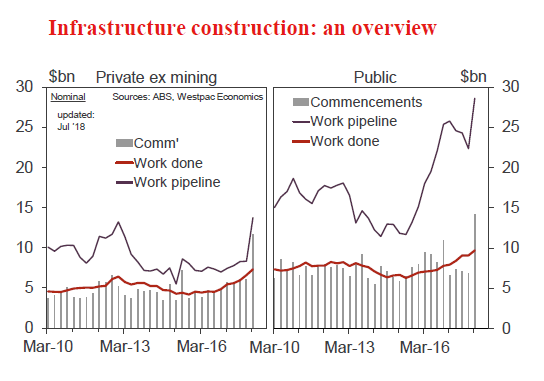
At the start of this year, public transport infrastructure projects under construction (or at the committed stage) were valued at $112bn, as reported by the Deloitte Access Economics Investment Monitor. This is up from $56bn two years earlier.
This boost to public transport investment is centred, but not confined to, NSW and Victoria, which together account for 73% of projects under construction, well in excess of their share of national output and national population, both around 58%.
Infrastructure activity: sharp upswing to continue
With infrastructure activity having rebounded over the past two years to currently be a little above the previous peak of 2012, the question is where to next, a consolidation at these high levels or is the prospect for further strong growth? Indications are that there is considerable further upside to investment spending and that growth is set to be brisk.
The pipeline of work outstanding on infrastructure projects currently under construction is actually expanding not shrinking as construction work fails to keep pace with the commencement of new projects. In the March quarter, the pipeline of work yet to be done jumped to $42bn, up from $33bn at the start of 2017 and from $22bn at the end of 2015. Recently, in Victoria work has commenced on the $10.9bn Melbourne Metro rail project and the $6.7bn West Gate Tunnel Project. Both are PPP's, suggesting some of the work may be recorded by the ABS as undertaken by the private sector.
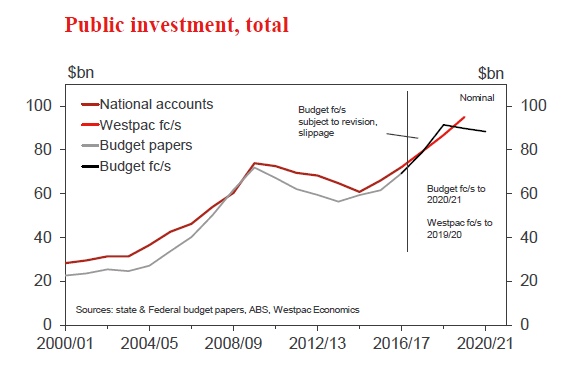
Turning to the state budgets, we find that they reveal that the states intend to ramp-up investment in 2018/19, with a focus on infrastructure, as well as investment in non-residential building and equipment spending.
Aggregating the annual state budgets, as well as including the Federal budget, indicates that public investment grew by 12.5% in the 2016/17 financial year, followed by an estimated 14% increase in 2017/18, and is forecast to accelerate to a near 16% expansion in 2018/19.
A word of caution, in 2017/18 work failed to meet budget forecasts, with considerable slippage, largely in NSW. By way of comparison, a year ago, the budget papers predicted investment would increase by 22% in 2017/18 and rise by 6% in 2018/19. At the time, we assessed that the 2017/18 forecast was ambitious, and discounted it somewhat. While some ongoing slippage is inevitable, given the scale of the transport projects underway, we note that the forecast for 2018/19 is less ambitious.
Relative to a year ago, construction work in NSW has been pushed back. In addition, new projects have received the final go ahead, boosting investment plans in Victoria for 2018/19 and 2019/20, and boosting plans in NSW for 2019/20 and 2020/21 (over and above slippage).
This leads us to a discussion of the Federal Budget forecasts for overall public demand, which as well as including public investment, covers spending on health and other consumption goods and services. Note that public demand directly accounts for almost 25% of the Australian economy. Public demand having increased by 4.5% in 2015/16, 5.0% in 2016/17 and an estimated 5.0% in 2017/18 is forecast in the Federal Budget to increase by a more modest 3.0% in 2018/19 and by 2.75% in 2019/20. The ongoing strength of the investment upswing suggests that the Federal Budget forecasts for public demand will be exceeded, potentially comfortably so.
As highlighted previously, incorporated in our overall growth view for Australia (GDP growth of 2.7% this year and 2.5% for next year) is an upbeat expectation for non-residential construction activity, led by the public sector. We expect public demand growth of 4.5% for 2018/19 and 3.5% for 2019/20.
Investment pipeline to be boosted by additional projects
The state budget papers understate the outlook for public investment. Notably and understandably, funding for projects that are still at the 'under consideration' stage are not included in the budget figures - even though there may be a clear and publicly stated intention to proceed in the near term.
In the case of Victoria, the Melbourne Metro rail project and the West Gate Tunnel project are included in the budget forward estimates. However, two notable projects not included in the forward estimates are the $16.5bn North-East Link project and the Melbourne Airport train link, for which the Commonwealth Government has provided $5bn in funding, subject to a matching grant from Victoria. The state government is committed to the North East Link project and expects the tender process to commence in the next term of government (the upcoming state election is on November 24 this year).
Similarly, in NSW, the budget forward estimates do not fully include a number of multi-billion dollar transport projects which are under active consideration by the current government. The NSW state election is to be held of March 23 2019.
The pipeline of public transport projects currently under consideration is estimated by Access Economics to be $60bn, of which 70% are in NSW and Victoria.
To finish, we turn to private sector investment in electricity generation. Work on such projects, where the focus is on investment in renewable energy (wind-farms, solar and battery storage), accounted for a sizeable 30% of the increase in total infrastructure activity over the past year. Here as well the outlook is positive. The value of work yet to be done on projects currently under construction is expanding not shrinking, up 67% on a year ago. Moreover, there is a sizeable pipeline of projects under consideration, estimated in the Investment Monitor to be $10bn, in addition to $1.5bn of projects already at the committed stage, together exceeding the value of projects currently under construction, at $8.3bn.
In summary, activity in the non-mining infrastructure construction sector is increasing at a brisk pace. To date, the lift in work represented a rebound, reversing the sharp pull-back from late 2012 to mid-2015. Going forward, indications are that there is considerable further upside to investment spending and that growth is set to remain brisk. The backdrop is that Australia is playing catch-up, investing in much needed infrastructure, particularly in the capital cities, a pressing need compounded by rapid population growth, with increases well in excess of expectations. Over the past two years, governments have added major transport projects to the investment pipeline and with other projects under active consideration the pipeline is set to expand further as we move into 2019 and beyond.
The week that was
Apart from yet another escalation of global trade tensions, it has been a positive week for our economy, with consumers showing greater optimism over the outlook and business conditions remaining well above average.
The Westpac-Melbourne Institute consumer sentiment survey was the key release of the week, highlighting growing optimism amongst consumers towards the economic outlook. This was true of both the one and five year view, with each index around 12 points above the five-year average. Despite this growing optimism over the economy, households remain much more circumspect regarding their family finances. This imbalance between economic and family finance assessments continues to be driven by weak wage growth and high levels of household debt. The limited buffer that many indebted households have against their mortgage amplifies this tension. A clear positive in the mix however is the passing of the Government's multiyear tax package: middle-income households' sharp jump in sentiment this month is a vote of confidence in support of the tax cut's effect. Towards consumption and housing, views on the household family budget dominate. While our time to buy a major household item series has risen to be near the top of the range of the last two years, it remains below average overall and well below levels consistent with buoyant consumer spending. Highlighting continued affordability pressures, the time to buy a dwelling series is well below its long run average, despite house price growth having dissipated. Price expectations look to be holding consumer demand for housing back as well, with more than half of all consumers expecting prices to be unchanged or lower in twelve months' time.
It is important to note that the July survey was completed before President Trump formally announced a 10% tariff on another $200bn of Chinese imports to the US – an escalation previously mooted when the last round of tariffs came into effect. Being levied on four times more imports than his previous round of tariffs, it is not surprising that markets have been unnerved, particularly in Asia. For Australia, the risk in this burgeoning trade war is not so much the initial shock to trade, which is likely to be small, but rather the flow-on consequences for wealth and investment. Via financial markets, wealth will take the first hit. Come 2019 however, if tensions are sustained or escalate further, there could also be a negative headwind for business investment and employment, both here and across the world. As we look ahead then, consumer and business sentiment will be an important barometer of the potential economy-wide shock to Australia from these trade frictions.
On business conditions and confidence, the June NAB business survey reports that both remain strong despite easing in recent months. Business confidence is currently in line with its long-run average; while conditions are well above. Within the condition detail: trading is holding near its recent highs and profitability is robust; but the employment index has continued to trend lower. On the latter however, this barometer of jobs growth still suggest that near-term gains in employment will be more than sufficient to hold the unemployment rate at its current level, assuming stable participation. Assessing the growth pulse by sector: the NAB survey indicates momentum has eased back in the construction sector as it strengthened in business services. Against these two areas of strength, persistent consumer sector weakness is a stark contrast.
Taking a step back from the current run of data, a research bulletin on the profile of owner-occupier interest only borrowers was released this week. The HILDA data to 2016 that this research is based on highlights that: owner-occupier interest only loans are spread fairly evenly across the major capital cities; and that the quality of these loans improved between 2014 and 2016 as lending conditions were tightened. Interestingly, those with interest only loans tend to have higher incomes and are more likely to be self-employed or on fixed term contracts. Though it pre-dates the latest round of APRA's macro-prudential policy tightening, this data acts as a very useful starting point for developing an understanding of the evolving state of housing finance in Australia.
Finally to the US, where the June employment report and CPI collectively highlighted the financially constrained state of the US consumer. The primary restraint for consumption evident in the data is an absence of real wage gains. In the June quarter, annual real hourly earnings growth came in at just 0.1%yr. As hours worked are also unchanged over the period (indeed since 2014), the established worker is yet to see a meaningful benefit from the post-GFC recovery. Technology and globalisation are at play here; however, the domestic supply of labour still returning to work 10 years after the GFC is arguably the major impediment to accelerating wage inflation. Employers won't be forced to boost pay and conditions to attract workers for a while yet, with at least another year of strong employment growth necessary to erode remaining slack.
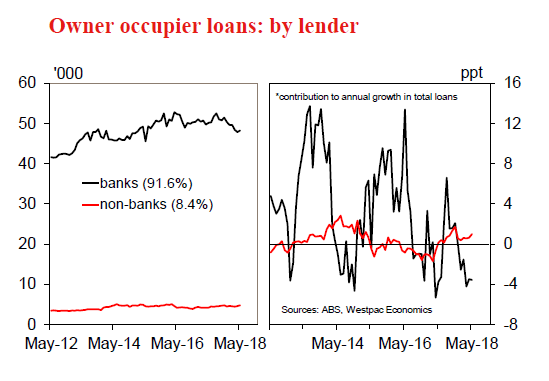
Chart of the week: Housing finance
Australian housing finance approvals were firmer than expected in May, the number of owner occupier loans rising 1.1% vs an expected 2% decline, and the value of investor loans up 0.1%.
The lender detail shows a strong 4.5%mth gain for non bank lenders, up 12.9%yr. However the number of bank loans, which accounts for over 90% of finance approvals, still posted a 0.8% gain – the implied net shift in market share still looks minor, worth about 1ppt over the last year.
Overall, the May finance data is a little at odds with other housing market data that suggests conditions have weakened further through May-June, auction markets in particular. That was thought to be in response to tighter lending criteria. Again though, the May finance detail suggests little incremental change in lending conditions. Hopefully the next few months will clarify the situation. Until then we suspect the finance data is the 'odd one out'.
New Zealand: week ahead & data wrap
A game of two halves
Caution among consumers has played an important part in the economy's loss of momentum this year. While we expect growth to remain subdued, there's reason to think that households' fortunes will look a bit better in the second half this year than they did in the first. The inflation picture for New Zealand could also look somewhat different by year-end.
While consumer spending has seen some moderate gains in recent months, the trend has clearly softened over the first half of 2018. The latest credit and debit card figures showed a 0.8% increase in retail spending in June, which was a little stronger than forecast. But comparing the three months to June with the preceding three months, spending levels have essentially been flat.
Last week we noted that financial markets have been slow to recognise the cooling in the New Zealand economy this year. In contrast, we've been flagging the likelihood of a first-half slowdown for some time. In particular, the softness in consumer spending is in line with the slowdown that we've seen in the housing market, as a range of new Government policies have weighed on house prices and sales.
We've also been pointing out that things could look different again by next year, as increased fiscal stimulus starts to fill in some of the gaps left by a more subdued private sector. For households, that turning point may have already arrived. From 1 July the Government's Families Package came into full force. The package includes winter energy payments for the elderly and those on benefits, a tax credit for newborns, and increases in Working for Families payments. That's on top of an increase in the accommodation supplement that came into effect in April.
All together, this amounts to more than a billion dollars a year going into people's pockets. And importantly, it's targeted towards lower-income households who are more likely spend than save it.
That said, households will still face some headwinds over the second half of this year. One is that the housing market is likely to remain soft as the Government continues with its measures to dampen housing speculation. Restrictions on foreign buyers of property are expected to come into force sometime next month. Then from early next year, the use of negative gearing by property investors will start to be phased out. These measures will weigh on property values, and as a result are likely to weigh on people's willingness to spend as well.
Another issue is the cost of fuel. The rise in world oil prices and a weaker New Zealand dollar meant that petrol prices had already risen to new highs by early June. The Auckland regional fuel tax (from July) and a national increase in excise duty (expected to be from September) will add further to the cost of filling up over the second half of the year. Higher fuel prices tend to detract from spending in other areas.
On balance, though, we think that households will fare a little better over the second half of this year than they did in the first half. We'll be watching for signs of a pickup in spending growth over the coming months.
Looking ahead to next week, the highlight is likely to be the June quarter CPI on Tuesday. We expect a 0.6% rise for the quarter, which would see the annual inflation rate rise from 1.1% to 1.7%. Fuel and food prices are likely to make the biggest positive contributions. We also expect that the lower New Zealand dollar over the last year will put some upward pressure on the retail prices of imported goods.
Perhaps more importantly, we expect these same factors to push inflation just above 2% by the end of this year – putting it in the upper half of the Reserve Bank's target range for only the second time in seven years. In contrast, the Reserve Bank's forecasts in its May Monetary Policy Statement saw inflation remaining below 2% until the end of 2020.
We don't think that the rise in inflation this year will necessarily be sustained. Domestic inflation pressures are growing as the economy uses up its spare capacity, but this tends to be a gradual process. In the meantime, the tradables portion of the CPI is still driving most of the variation in the inflation rate. That means that maintaining inflation around 2% next year would require a further surge in world oil prices and/or an ongoing slide in the exchange rate.
Data Previews
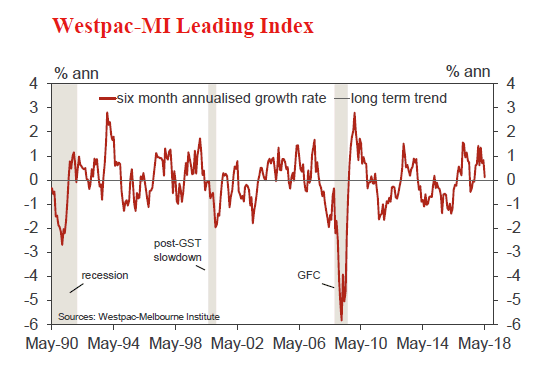
Aus Jun Westpac–MI Leading Index
- Jul 18, Last: 0.11%
The six month annualised growth rate in the Leading Index dropped from +0.83% in April to +0.11% in May. This was the weakest read since September last year with a clear shift lower in the first half of 2018, albeit with the index growth rate still pointing to momentum running slightly above trend.
The June reading will include a mixed bag of component updates. On the positive side: the ASX200 is up 3.0% vs 0.5% last month; the Westpac-MI Consumer Expectations Index, rose 5.1% vs a 1% fall last month; and the Westpac-MI Unemployment Expectations Index improved slightly. On the downside: commodity prices slipped 0.6% (in AUD terms) vs +0.6% last month; dwelling approvals were down 3.2% vs a 5% fall last month; and the yield spread narrowed 20bps, partly reflecting rising short term rates.
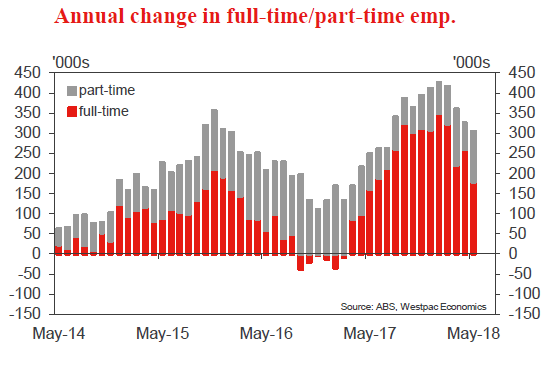
Aus Jun Labour Force - total employment '000
- July 19, Last 12k, WBC f/c: 17k
- Mkt f/c: 16.5k, Range: 5k to 30k
Australian employment rose 12.0k in May undershooting both the market (+19k) and Westpac's (+17k) forecasts. Fulltime employment fell 20.6k while part-time employment rose 32.6k. Overall this can be taken as a soft update with total hours worked falling 1.4% in the month. But it should be noted that hours worked are very volatile month-tomonth and they rose 1.2% in April.
Our forecast for June is a 17k increase in employment. This is broadly in line with results over the last two months and around the middle of the 2018 ytd average of 12.4k and the year to May 2018 average of 25.3k.
A factor that may affect June employment was the 31 May Fair Work Commission announcement of a 3.5% increase in the minimum wage, but note last year's increase of a similar scale was followed by still robust job gains. Seasonal effects are small for June employment change with June's seasonal factor for total employment slightly smaller than May's.
Aus Jun Labour Force - unemployment rate %
- July 19, Last 5.4%, WBC f/c: 5.4%
- Mkt f/c: 5.4%, Range: 5.4% to 5.6%
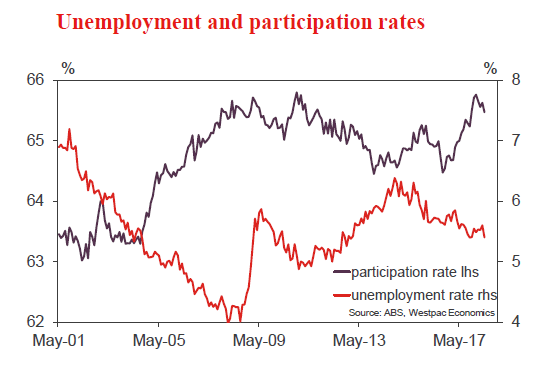
Despite the moderate increase in employment in May, the unemployment rate dipped to 5.4% from 5.6%, a significant drop in one month (5.40% from 5.60% at two decimal places).
Driving the change in unemployment was a 14.8k decline in the labour force with the participation rate falling to 65.47% from 65.62% which was not too far off the recent high of 65.75%.
Changes in the participation rate have tended to closely follow changes in employment. Participation rose during the employment upswing in the second half of 2017, and consequently moderated through the employment slowdown in 2018. As such, the unemployment rate has been relatively steady through this period. • We are forecasting an unchanged unemployment rate of 5.4% and unchanged participation rate of 65.6%.
NZ Jun REINZ house sales and prices REINZ house prices and sales
- Jul 17, Sales, Last: +0.8%. Prices, Last: 3.7%yr
After a brief resurgence around the turn of the year, the New Zealand housing market has cooled again. Prices are now falling in Auckland, Wellington and Christchurch, and rising slowly elsewhere. Measured nationwide, house prices have been roughly flat.
The 'bright-line' test for taxing capital gains was extended from two to five years in late March, and this is impacting the market at present. The next negative factor for the market will be the foreign buyer ban, set to become law within a month. However, one offsetting positive for the market at present is falling mortgage rates.
The June REINZ data (delayed from last week) is expected to continue the recent trend of slowing sales and flat prices.
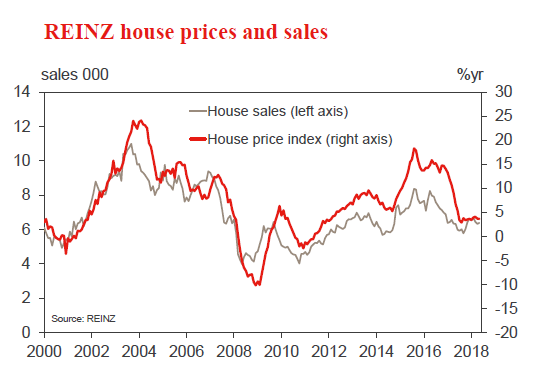
NZ Q2 CPI
- Jul 17, Last: 0.5%, Westpac f/c: 0.6%, Mkt f/c: 0.5%
We expect a 0.6% rise in consumer prices for the June quarter. This would see the annual inflation rate rise to 1.7%, after a brief drop to 1.1% in the March quarter.
The biggest positive contributions will be from higher fuel prices and a largely seasonal rise in food prices. We also expect a modest uptick in imported goods prices, as a result of the lower New Zealand dollar over the past year. Domestic airfares and accommodation will see seasonal declines as the peak tourist period comes to an end.
We expect annual inflation to reach 2.1% by the end of this year, as fuel prices turn from a drag to a boost. However, we're not convinced that this effect will persist into next year.
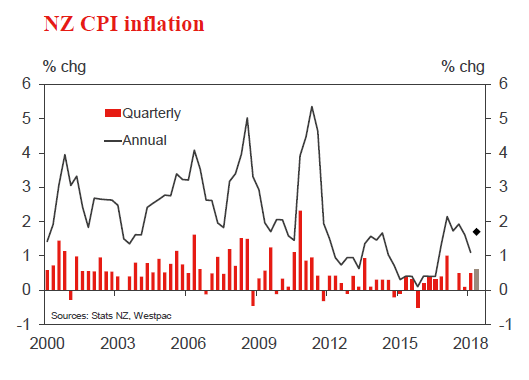
China Q2 GDP
- Jul 16, last 6.8%, WBC 6.6%
The past few months have been an interesting time for China. Momentum in their PMIs has remained robust despite decelerating external demand. Against this however, the pursuit of 'quality development' has resulted in growth in non-bank lending being heavily restricted and only partly offset by increased lending by banks.
For GDP, we therefore look for a deceleration in annual growth to 6.6%yr from 6.8%yr in Q1. On a quarter by quarter basis, that equates to a 1.6% gain, up on Q1's 1.4% but below the 1.8% increases of mid-2017.
A further slowing in growth is expected in the second half of 2018, once the seasonal Q2 kick higher fades and as consumers remain unable/unwilling to accelerate their marginal consumption to offset.
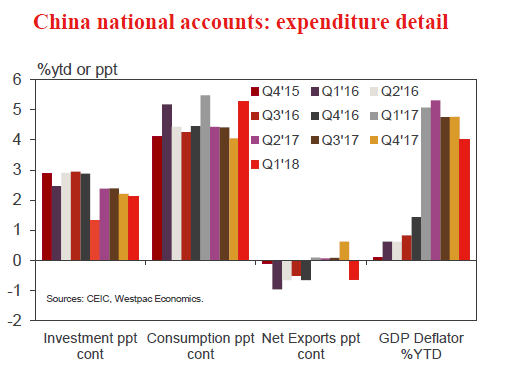
US Jun retail sales
- Jul 16, last 0.8%, WBC 0.7%
Retail sales surprised in May, the 0.8% headline gain double the market's expectation. The Apr outcome was also edged higher to 0.4%. Highlighting the breadth of the sales gain, excluding autos & gas, May activity was also up 0.8%, while the control group gained 0.5%.
Come June, a similar result is likely. We forecast a 0.7% rise in total sales, and circa 0.5% for core retail. Importantly, this does not mean we are expecting a strong Q2 consumption print when GDP is released in a few weeks time.
Also available to May, the broader personal consumption data makes clear that total consumption (including services) has been weaker than retail sales of late. And also, that once deflated for inflation, spending growth in Q2 has only been a little stronger than the weather-affected Q1.
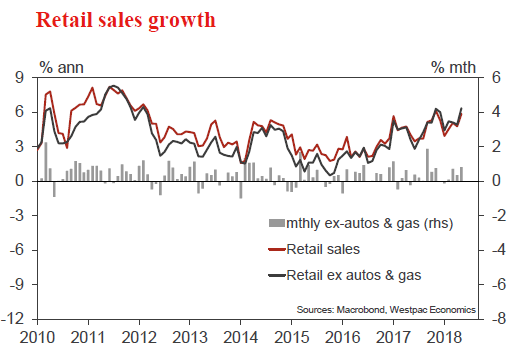
Theresa May Seeks a Compromise on Brexit, But Will the EU Listen?
The past days have been a wild ride for the British pound, with the Brexit saga receiving multiple new chapters. Key Brexiteer ministers have resigned, and while this has been interpreted as a negative in the sense that it threatens Theresa May’s position as PM and hence increases the likelihood for a no-deal Brexit, it also provides a unique opportunity for the EU-UK negotiations to move forward.
In a rather dramatic start to the week, the Brexit narrative came back to the forefront as the UK Brexit and Foreign secretaries, David Davis and Boris Johnson, handed in their resignations. These leading Brexiteers left in protest at PM Theresa May’s new plan for Brexit, describing it as a compromise they just could not accept. Financial markets were uncertain over how to interpret the news.
Davis’s resignation was initially read as encouraging – on the margin – in the sense that with one of the most prominent Euro-sceptics out of the way, the EU-UK negotiations may now be able to finally move forward. The pound moved slightly higher, only to come plunging down following headlines that Johnson had quit too. Johnson’s departure was seen as one too many, raising the likelihood for a Brexiteers’ rebellion within the Conservative Party that challenged Theresa May’s position as Prime Minister. Such a revolt, by extent, would also throw a wrench in the Brexit negotiations, keeping them in a deadlock for longer and increasing the likelihood for a no-deal outcome.
New Brexit plan: Striking a compromise
The UK administration’s new Brexit blueprint essentially looks to strike a compromise on the Irish border issue – avoiding a “hard” border between the two Irelands – by asking the EU for complete access to the single market for all goods. To achieve that, the UK would maintain “a common rulebook for all goods”, which essentially implies it would have to accept all current and most future EU regulations on goods – something that Brexiteers campaigned to get rid of.
On a more important note, the plan is somewhat ambiguous about what happens with services, which account for roughly 80% of UK GDP. The agreement states the UK would keep “regulatory flexibility” on that front, which would crucially result in limited access to the EU market for UK firms, as the paper itself admits. Ever since the plan’s publication, UK financial business leaders have come out in droves to express their concerns about how such a loose relationship would hamstring their revenues and ability to create jobs, potentially becoming a drag on UK economic growth. Lloyds Bank CEO Inga Beale, for instance, noted that many other banks, insurers, and financial services firms would now be joining her “at pace” in setting up subsidiaries in Brussels. On the free movement of people, the plan is blurry as well, stating the UK will “end free movement” but also implying that EU citizens would get preferential treatment under new migration rules.
In its current form, this is a rather controversial plan that is unlikely to be accepted by EU negotiators. On the surface, it separates the four freedoms of the single market, by seeking to continue the free movement of goods while limiting the free movement of people, capital, and services. That said, it still may be a foundation for negotiations, i.e. a stepping stone for the talks to finally move forward, with the UK showing it’s willing to make some concessions along the way.
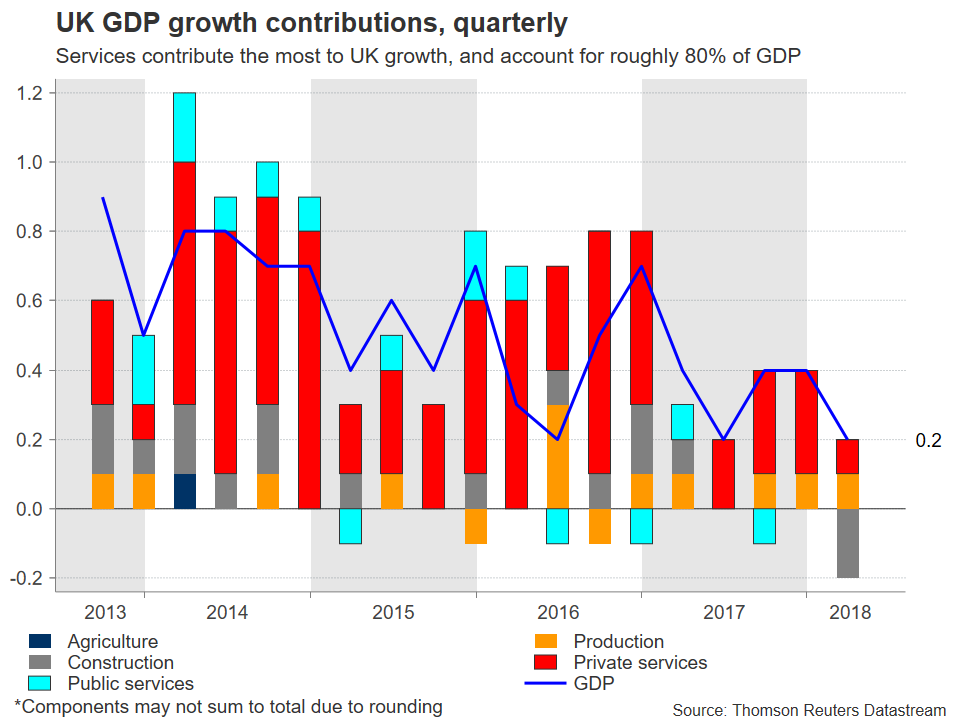
Probability for extreme forms of Brexit rising?
“Soft” versus “hard” Brexit has been the name of the speculation game ever since the referendum took place, with the former implying close ties to the EU and the latter a very loose relationship, or even a no-deal outcome. In a sense, recent developments may have increased the likelihood for both of these scenarios.
To explain – on the one hand, the probability for a Tory rebellion that ousts May has increased, and hence so has the probability for a no-deal outcome. Even in the absence of a no-confidence vote – which many believe May could currently win – if she loses the support of the Brexiteers in her party completely, that could drain her political capital further and limit her ability to push legislation through Parliament, eventually forcing her out. If she is replaced by someone who is not as keen on making compromises, a Brexiteer like Johnson for instance, that would probably hold the talks back.
On the other hand, the more “extreme” voices on Brexit have now left the building, giving way to more pragmatic individuals to negotiate. Thus, should May manage to remain in power, there is optimism that the talks could finally bear fruit. Her White Paper, although falling short of solving many issues, is correctly perceived as a negotiating platform, marking the beginning of a process that may involve more concessions on the road to a satisfactory deal for both parties.
Reality bites
Brexit was never going to be easy. The EU was clear from the beginning that frictionless access to the single market would be impossible without the free movement of people accompanying it. Hence, compromises have to be made, and the negotiating process finally appears to be on track for that to happen, which is encouraging.
Now, the ball is in the EU’s court. How the EU 27 nations respond to May’s White Paper will be crucial in determining whether the negotiations can move forward. Will they reject it as “unworkable” and send the talks back to square one, or will they acknowledge it’s a position for negotiating, and come back with counterproposals? EU chief negotiator Michel Barnier’s next remarks will likely provide a taste of what is to come. And if the EU rejects it flat out, one has to wonder if the UK government will have time to come up with some other realistic proposal ahead of the nation’s official departure from the EU in March, considering how long it took to draft this one.
While monetary policy will also play a large role – especially since markets are still uncertain if the BoE will raise rates in August – the broader direction of the British pound may be decided primarily by whether there is some progress in the negotiations ahead of the next EU summit in October, or not. Anything that adds credence to the prospect of an orderly and smooth Brexit, where the UK maintains a relatively tight trading relationship with the bloc, could propel sterling higher. On the contrary, any signs that PM May is losing her grip on power, or that her latest proposals will not even constitute a negotiating platform for the talks, could spell more bad news for the pound.
The future is uncertain, but one thing is clear. As EU diplomats never get tired of repeating: the clock is ticking.