Sample Category Title
Central Bank Members Lead The Calendar To Start The Week
At 10:00 GMT, MPC Member Broadbent will deliver the opening remarks at the Economics and Psychology conference hosted by the BOE, in London. GBP crosses can be moved by this event.
At 13:00 GMT, ECB President Mario Draghi will testify about the economy, monetary policy, and virtual currencies before the European Parliament Economic and Monetary Affairs Committee, in Brussels. EUR crosses can be moved by any reference to monetary policy.
At 13:10 GMT, FOMC Member Kashkari will speak at a scheduled event. USD crosses may experience volatility during this time.
At 15:00 GMT, ECB President Mario Draghi will to testify on the European Systemic Risk Board before the European Parliament Economic and Monetary Affairs Committee, in Brussels. EUR crosses can be moved by this event.
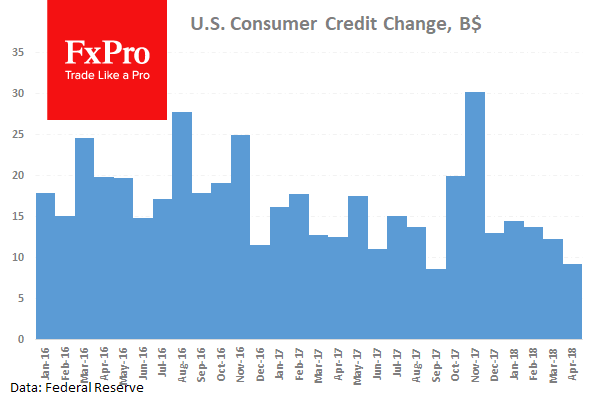
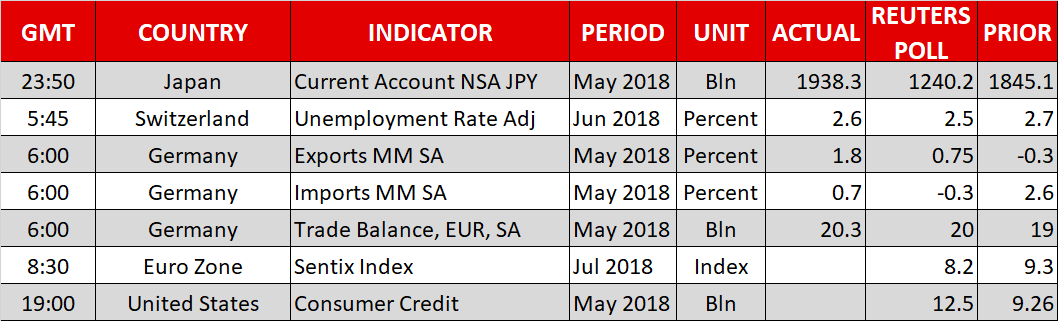
At 19:00 GMT, Consumer Credit Change (May) is expected to come in at $11.50B from a previous reading of $9.26B. This data shows that consumer credit has been falling in recent months and has come in under expectations for five months in a row. The expectation again is for an increase in the number today. Increases in this metric are a sign of consumer confidence as consumers take on more debt and lenders feel confident issuing loans. USD pairs can be moved by this data.
Major data releases for today:
On Tuesday at 08:30 GMT, UK Gross Domestic Product data will be released.
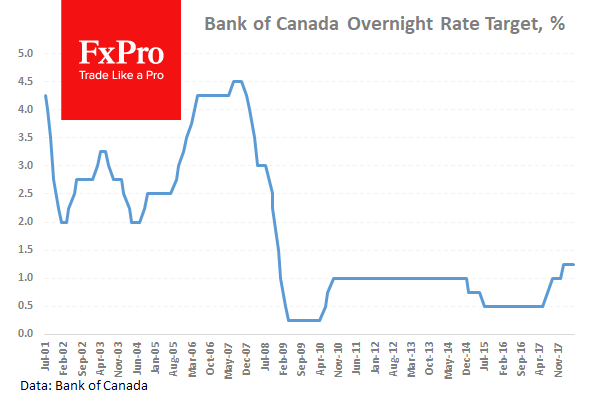
On Wednesday at 14:00 GMT, Bank of Canada Interest Rate Decision and Rate Statement data will be released. The Monetary Policy Report will follow at 15:00 with the Press Conference commencing at 15:15.
On Thursday at 06:00 GMT, German Harmonized Index of Consumer Prices data will be published.
At 11:30 GMT, The ECB Monetary Policy Meeting Accounts will be released.
At 12:30 GMT, US Consumer Price Index data will be made public.
Eurozone Sentix Investor Confidence rose to 12.1 in technical counter-movement
Eurozone Sentix Investor Confidence rose to 12.1 in July, up from 9.3 and beat expectation of 9.0. Sentix noted in the release that Eurozone expectations may "stabilize slightly" after the sharp fall in June. But that seems more of a "technical counter-movement". It noted that the Economic Index for Germany had dropped for the sixth time in a row to just 16.2.
Also, the next of of trade dispute between the US and the rest of the world "has been reached and countermeasures by the EU and China are under way. Sentix noted if Trump now targets the European car industry, the "trade dispute could lead to more than a slowdown in economic sentiment." At the same time, central banks, at the path of stimulus remove, are "unlikely to play a support role".
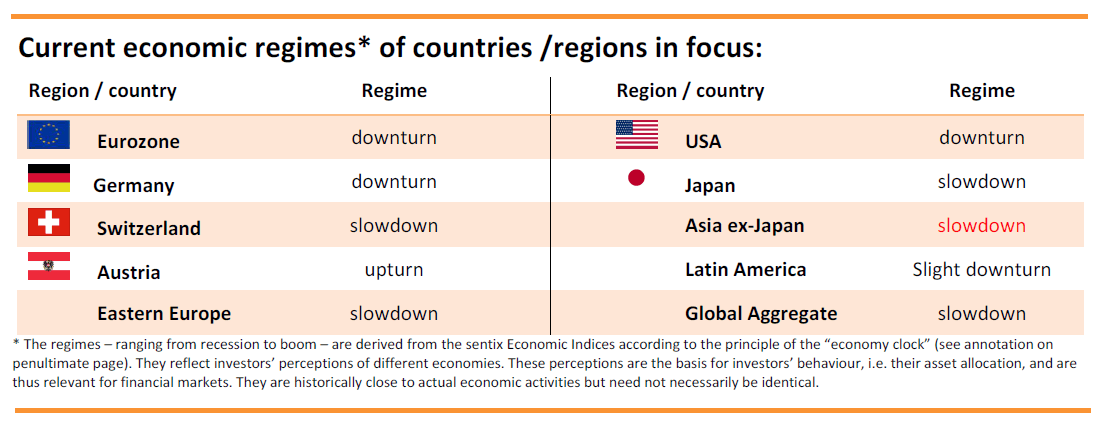
Sentix added that the global environment is also showing more and more signs of an economic slowdown. For Japan, for example, we are recording the sixth consecutive decline in the overall index and economic expectations for Asia ex Japan are slumping by more than 10 points. US economic expectations are also falling to their lowest level since August 2012.
EURUSD Rebounds To Challenge The Neckline Of Triple Bottom Formation
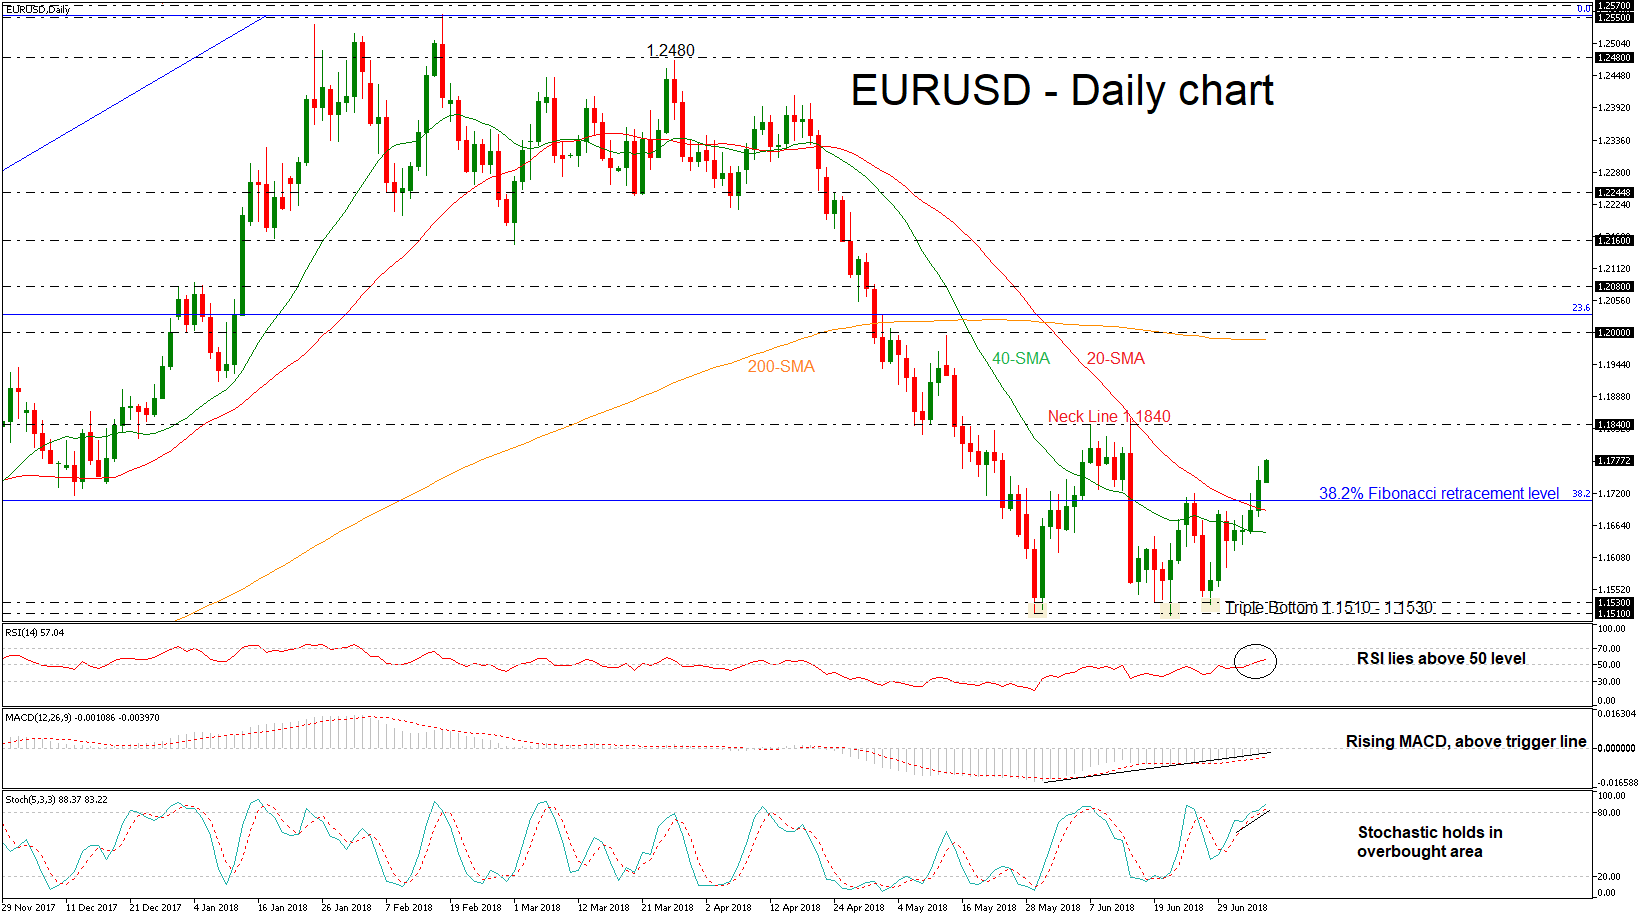
EURUSD has been outperforming over the last three weeks, following the touch on the 1.1510 support level on June 21. Also, during Friday's session, the common currency successfully surpassed the 38.2% Fibonacci retracement level of the upleg from 1.0340 to 1.2550, around 1.1707. The short-term technical indicators are bullish and point to more strength in the market.
The positive bias in the near term is supported by the deterioration in the momentum indicators. The %K line of the stochastic oscillator has risen sharply into overbought levels. Moreover, the RSI is holding above the 50 level and is moving north, while the MACD oscillator is approaching the bullish territory and lies above its red-trigger line.
In the wake of positive pressures, the market could meet resistance at the 1.1840 barrier, which is the neckline of the triple bottom formation. The significant troughs stand within the 1.1510 – 1.1530 zone. A jump above this key level could challenge the 1.2000 psychological barrier, which stands near the 200-day simple moving average (SMA).
Conversely, a move to the downside, below the 38.2% Fibonacci and the 20- and 40-SMAs could see immediate support at the 1.1510 – 1.1530 area. Further losses could drive the price towards the 50.0% Fibonacci of 1.1450, forcing the continuation of the negative outlook in the medium term.
Overall, the world's most traded currency has been developing within a reversal pattern (triple bottom). Near-term weakness is expected to remain as long as price action takes place above 1.1530 and below the neckline (1.1840).
Gold Manages To Pick Up Speed, Posts 2-Week High
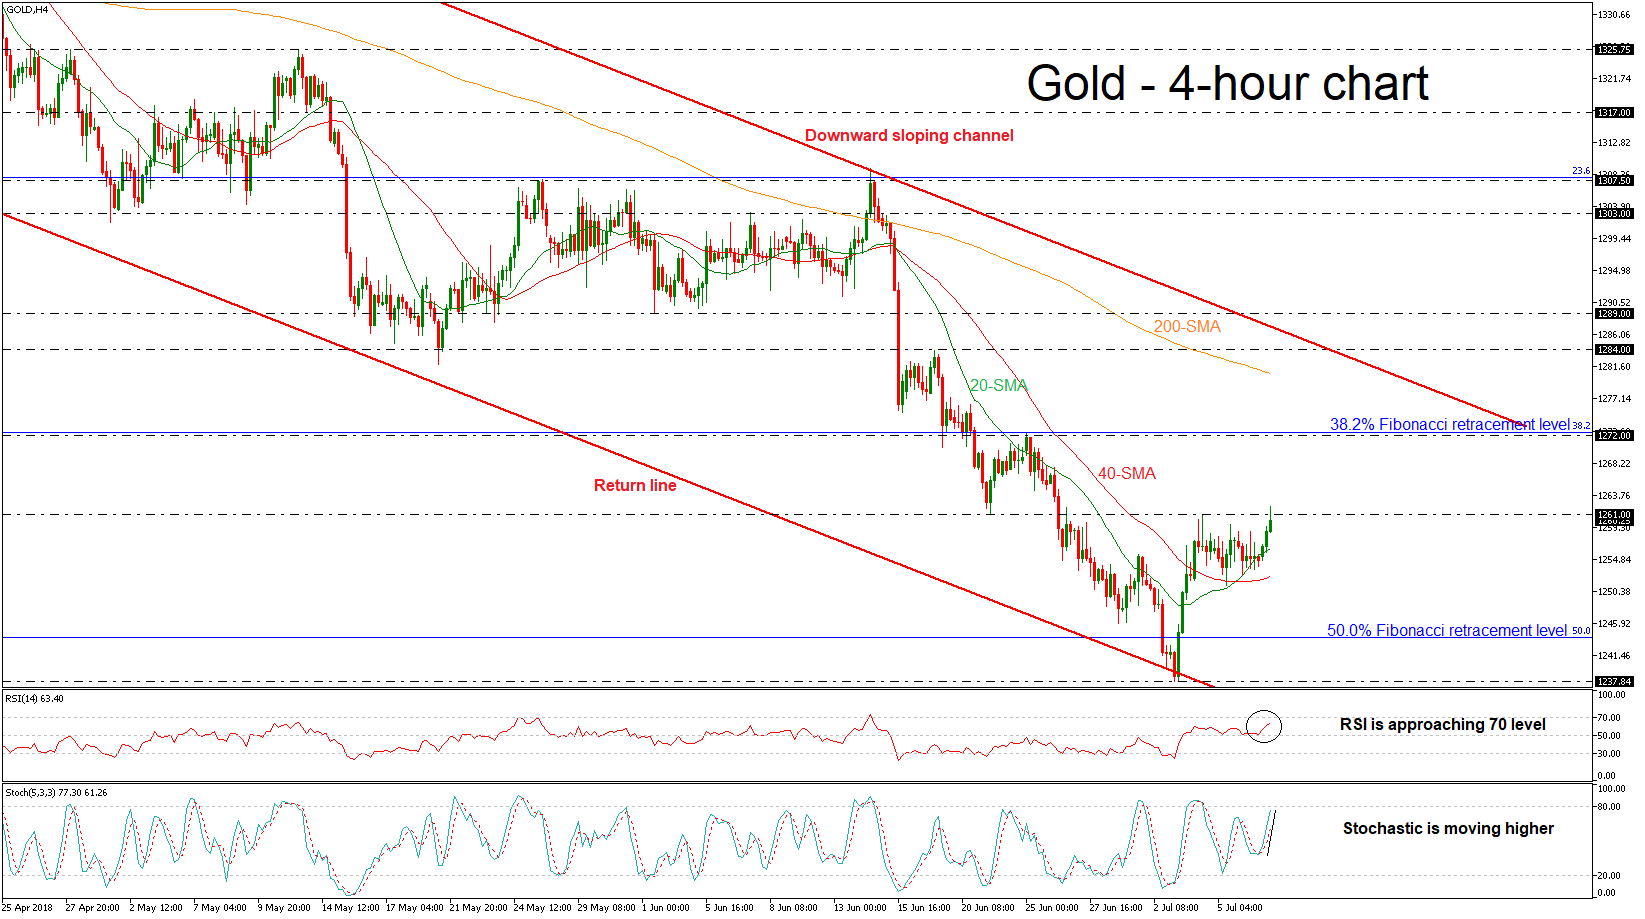
Gold has created a new two-week high of 1262.13 over today's European session and is trying to have a session close above the 1261 barrier in the 4-hour chart. The technical indicators are sending bullish signals, supporting the upside movement in price action and suggesting that the softness may come to an end.
The Relative Strength Index (RSI) is moving towards the threshold of 70, while the %K line of the stochastic oscillator is approaching the overbought zone with the %D line.
If the market manages to pick up speed and surpasses 1261, the 38.2% Fibonacci retracement level of the upleg from 1122 to 1366, around 1272 could offer nearby resistance. A significant close above the latter could push the commodity even higher until the 200-simple moving average (SMA) near 1280 at the time of writing.
Should prices decline, immediate support could be found around the 40-SMA of 1252. Then a leg below that level could meet the 50.0% Fibonacci region of 1244, increasing downside pressures in the near term.
To conclude, the precious metal has been holding within a downward sloping channel since April 11, indicating that the price remains in a bearish mode in the long term.
Sterling In Focus As UK Brexit Chief Resigns
Here are the latest developments in global markets:
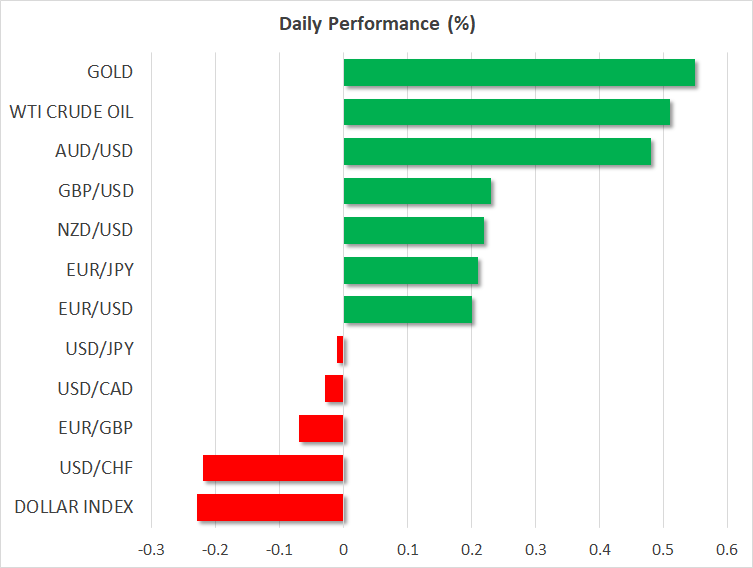
FOREX: The US dollar index – which measures the greenback’s performance against a basket of six major currencies – is down by 0.23% on Monday, following a slightly disappointing US employment report on Friday. Elsewhere, pound/dollar is up by the same amount, after the UK Brexit Secretary David Davis resigned his post.
STOCKS: Wall Street indices closed higher on Friday, after the US employment report for June showed that wage growth remains subdued. The tech-heavy Nasdaq Composite led the charge, climbing by 1.34%, while the S&P 500 and Dow Jones followed in its tracks, gaining 0.85% and 0.41% respectively. Moreover, futures tracking the Dow, S&P, and Nasdaq 100, are all pointing to a notably higher open today. Asia was a sea of green on Monday as well, with Japan’s Nikkei 225 and Topix up by 1.21% and 1.20% correspondingly. In Hong Kong, the Hang Seng jumped 1.71%. Europe was a similar story; all the major benchmarks are expected to open significantly higher, futures suggest.
COMMODITIES: Oil prices are up on Monday, with WTI and Brent crude advancing by 0.51% and 0.67% respectively. The oil market remains caught between multiple narratives, with expectations that major producers like Saudi Arabia will soon raise their production being counterbalanced by supply outages in Canada, Libya, and Venezuela. Moreover, tensions between the US and Iran are very high. Iran threatened to block a strategic oil-shipping waterway last week, and the US navy replied it will ensure freedom of navigation and flow of commerce. In precious metals, gold is up by 0.55% on Monday, currently trading near $1,259 per ounce, drawing strength from the continued correction lower in the US dollar.
Major movers: Sterling jumps as Brexit chief resigns; dollar softens after jobs report
The British pound opened with a small positive gap on Monday, following news that the UK Brexit Secretary, David Davis, has resigned. Davis criticized PM May’s new Brexit plan – which was agreed by the UK cabinet on Friday – indicating it would leave Parliament with a weak negotiating position. While many details are still unknown as the UK plan will only be made public later this week, it appears that it solves the thorny issue of the Irish border by establishing free trade for goods. Judging by the market reaction, investors likely interpreted the development as increasing the odds for a “softer Brexit”, as one of the leading Brexiteers left the administration and the negotiations may soon be able to move forward – if the EU accepts the plan, of course.
The dollar tumbled on Friday, following the US employment report for June, which was a touch softer than expected. While nonfarm payrolls came in above expectations, wage growth disappointed. Average hourly earnings rose at the same pace as previously in yearly terms, missing the forecast for a slight acceleration. The unemployment rate unexpectedly jumped to 4.0% from 3.8%, though that was probably owed to a similar jump in the labor force participation rate. Fed rate-hike odds barely moved; one more 25bps rate hike is fully priced in for this year, while markets see a 40% probability for a second one, according to the Fed funds futures.
On the trade front, while the US-China trade standoff escalated on Friday, with the two nations imposing tariffs on $34bn worth of products, markets paid little attention. US stock indices closed higher, while the Japanese yen – widely considered a haven asset – ended the day lower against the euro and the pound. The move was well-signaled in advance and hence, came as no surprise. What matters now, is whether the two sides will continue imposing measures on each other in tit-for-tat fashion, entering a vicious loop of escalation as neither wants to back down, or whether the prospect of more dialogue and negotiations will reappear.
In the commodity currencies, the loonie jumped on Friday after stronger-than-expected employment data from Canada sealed the deal for a rate increase by the BoC later this week. Meanwhile, aussie/dollar and kiwi/dollar are up by 0.48% and 0.22% respectively today, recovering some of the notable losses they posted recently.
Day ahead: Eurozone Sentix index and US consumer credit data due
Monday’s calendar is a rather light one in terms of releases, featuring the Sentix index out of the eurozone and consumer credit data out of the US.
July’s Sentix index that gauges investor sentiment in the eurozone is slated for release at 0830 GMT. The measure is anticipated to record its sixth straight monthly decline. Specifically, it is projected to stand at 8.2, its lowest since September 2016. Political uncertainty in Italy and rising protectionist rhetoric on the front of global trade by the US have been factors weighing on investor morale in previous months.
US consumer credit data for May are due at 1900 GMT; a rise in credit is expected during the month.
Remaining in the background during Monday’s trading are concerns over global trade and Brexit-related uncertainty after the resignation of Brexit Secretary David Davis (see Major movers section).
ECB President Mario Draghi will be speaking at the EU Parliament’s ECON committee at 1300 GMT, while he will be returning to the rostrum at 1500 GMT.
Meanwhile, a news conference at 1300 GMT featuring German Chancellor Angela Merkel and Chinese PM Li Keqiang after German-Sino consultations might be of interest, especially in the aftermath of the latest trade developments.
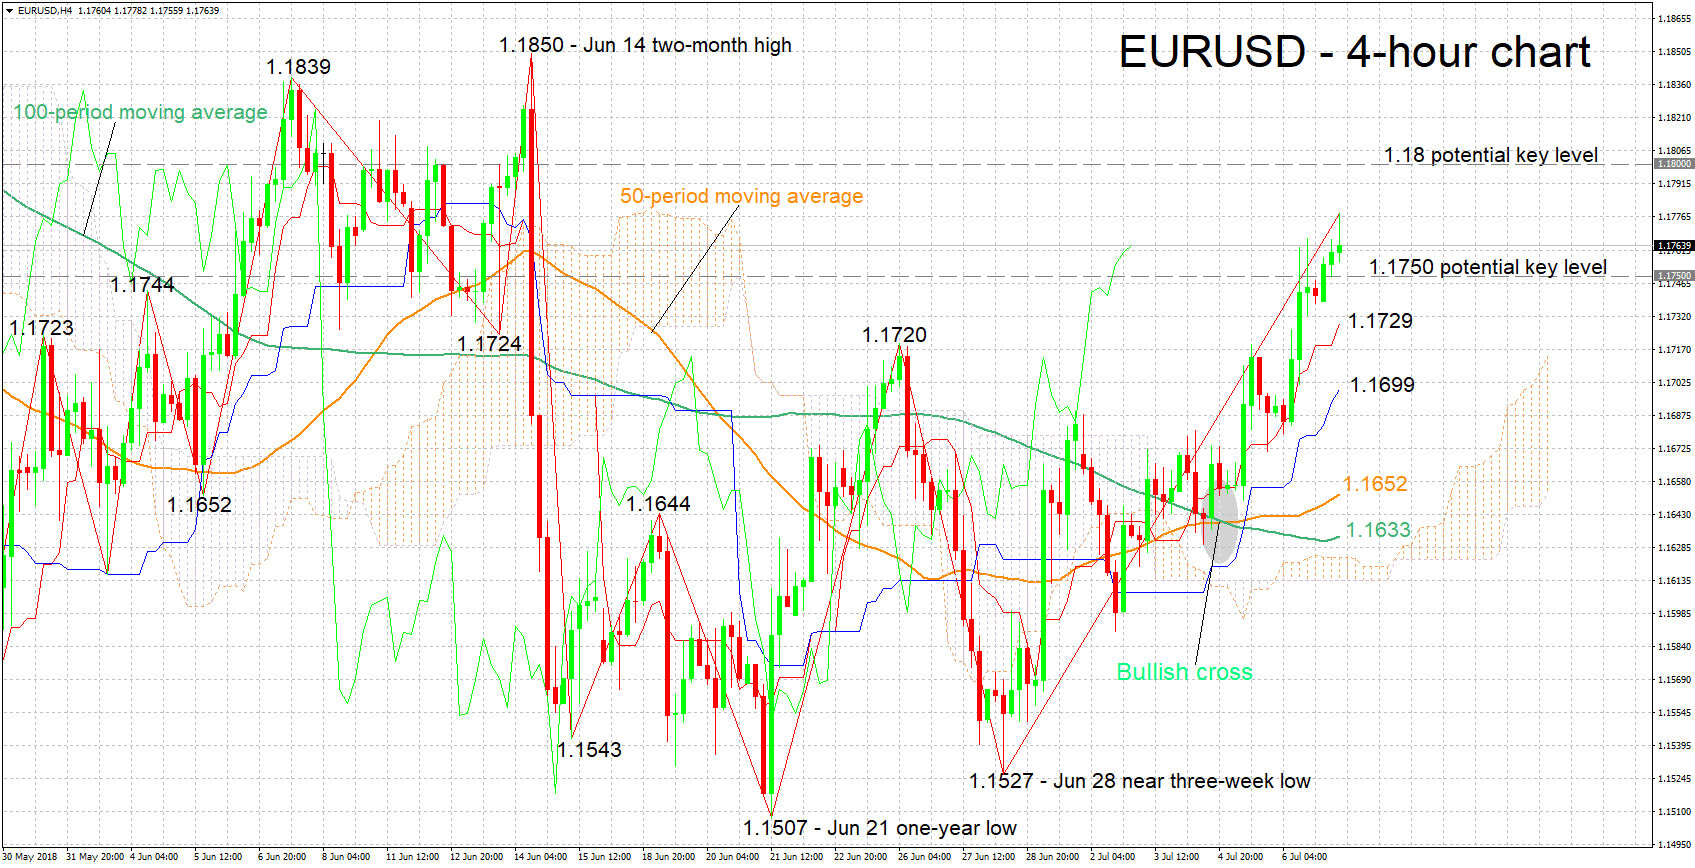
Technical Analysis: EURUSD short-term bullish as it hits near four-week high; possibly overbought
EURUSD has gained roughly 250 pips after touching a near three-week low of 1.1527 in late June. Earlier on Monday, it recorded a near four-week high of 1.1778. The Tenkan-sen remains above the Kijun-sen in support of a bullish short-term picture. The Chikou Span, though, may be pointing to an overbought market, the implication being that a near-term reversal is not to be ruled out.
The Sentix index does not typically act as a major market mover but still an upbeat report could boost the pair. Resistance to advances could come around the 1.18 round figure, before the attention starts to increasingly turn to the two-month high of 1.1850 from around mid-June.
On the downside and in case of a downbeat survey by Sentix, support could come from the zone around the 1.1750 level which was somewhat congested in the past. Notice this region failed to provide resistance earlier in the day and may instead act as support. Further below, the attention would turn to the areas around the current levels of the Tenkan-sen (1.1729) and Kijun-sen (1.1699) lines for additional support.
EURUSD Outlook: Bulls Penetrate Daily Cloud And Look For Fresh Extension Higher
The Euro maintains firm tone at the beginning of the week and attempts to extend gains from last Friday, when US jobs data sent the greenback lower, as slower than expected wage growth overshadowed strong non-farm payrolls data which exceeded forecasts.
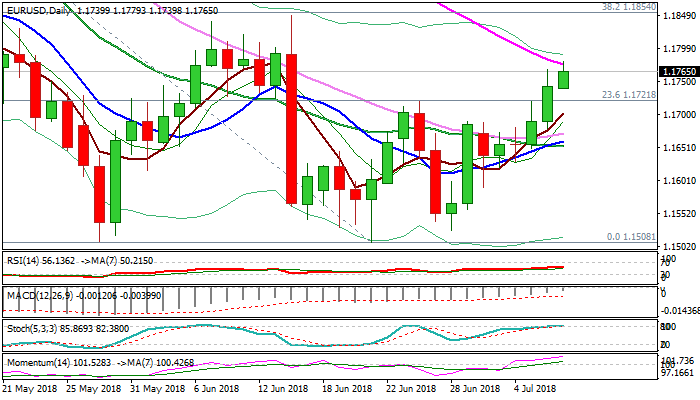
Fresh advance in early Monday’s trading penetrated thick daily cloud (cloud base lays at 1.1747) and cracked next strong barrier at 1.1775 (falling 55SMA) on probe above Friday’s high at 1.1767 (also Fibo 76.4% of 1.1848/1.1508 bear-leg).
Strong bullish signal was generated on Friday’s close above key barrier at 1.1718 (previous high of 26 June / Fibo 61.8% of 1.1848/1.1508), with daily MA’s (10, 20, 30) in bullish setup and strong bullish momentum, supporting for further advance.
Bulls eye key barriers at 1.1840/48 (07 / 14 June double-top, reinforced by Fibo 38.2% of larger 1.2413/1.1508 fall), break of which is needed to confirm base at 1.1510 zone and spark stronger recovery.
Bulls may show stronger hesitation at 55 SMA barrier as slow stochastic entered overbought territory on daily chart. Corrective dips are expected to find ground above strong support at 1.1650 zone (10/20SMA bull cross) to offer better opportunities for fresh longs.
Broken cloud base (1.1747) marks initial support followed by former pivotal barrier at 1.1718).
Res: 1.1779, 1.1809, 1.1840, 1.1854
Sup: 1.1747, 1.1718, 1.1678, 1.1650
EUR/USD Bullish Continuation Above 1.1792
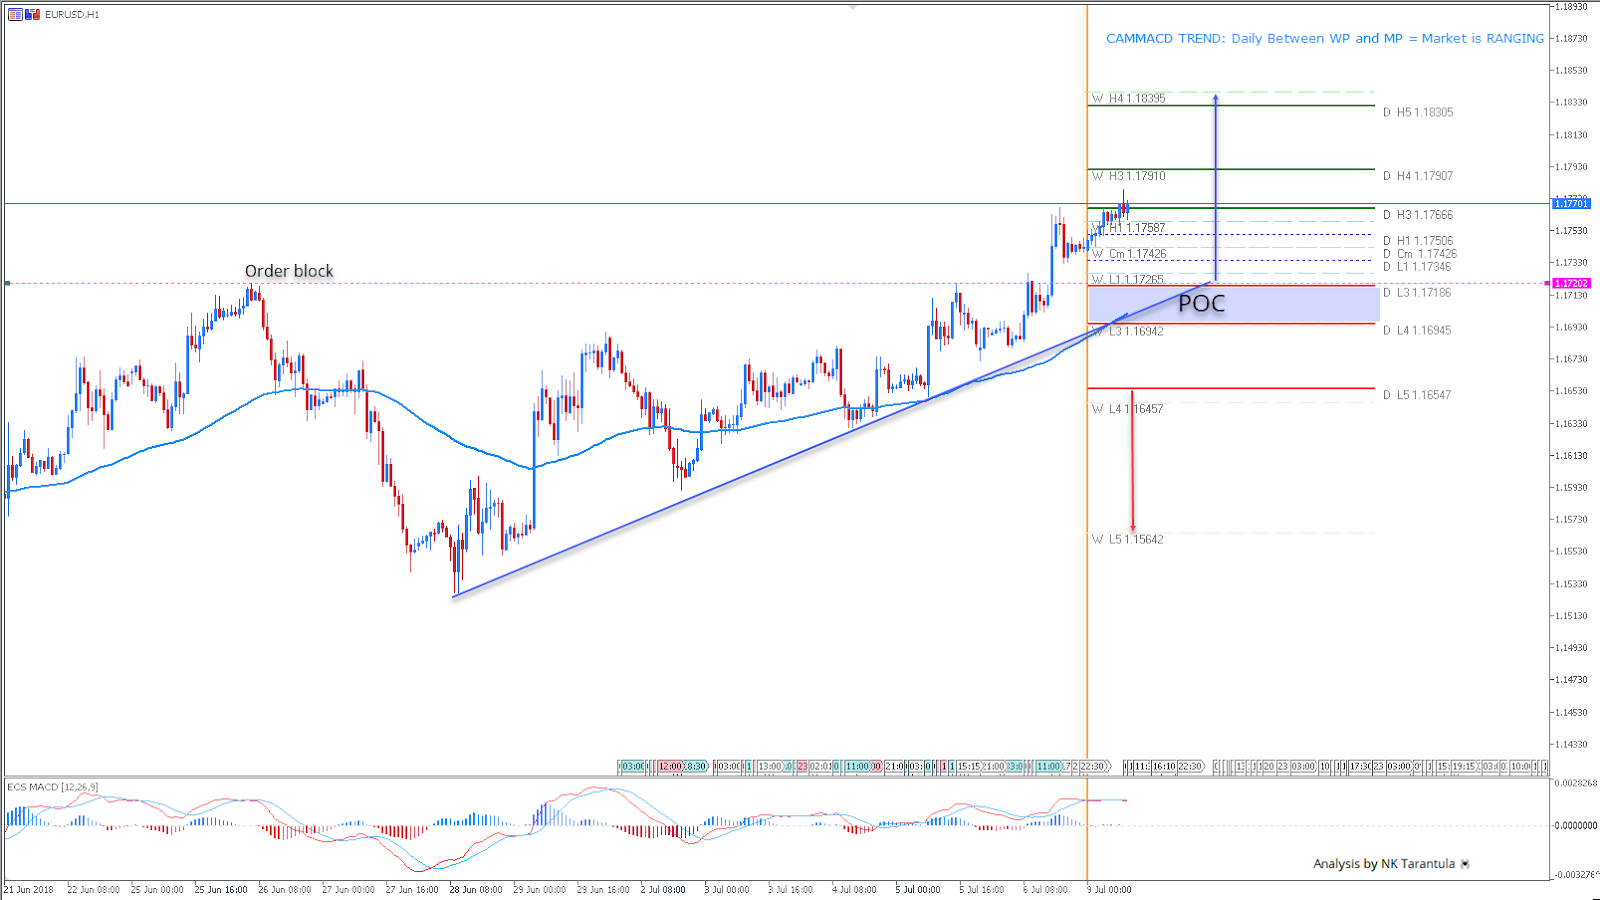
The EUR/USD bounced to the upside as predicted in the previous analysis. We can see that the market is above the POC zone and order block. A retrace to the POC 1695-1.1720 could provide the pair with a fresh buying momentum. New sellers are probably waiting within the zone. However a 4h candle close is needed above 1.1792 for a further continuation up. Next target is 1.1840 zone. A drop below 1.1645 might target 1.1600 and 1.1564, and the pair will be neutral to bearish again.
W L3 - Weekly Camarilla Pivot (Weekly Interim Support)
W H3 - Weekly Camarilla Pivot (Weekly Interim Resistance)
W H4 - Weekly Camarilla Pivot (Strong Weekly Resistance)
D H4 - Daily Camarilla Pivot (Very Strong Daily Resistance)
D L3 – Daily Camarilla Pivot (Daily Support)
D L4 – Daily H4 Camarilla (Very Strong Daily Support)
POC - Point Of Confluence (The zone where we expect price to react aka entry zone)
XAUUSD Intraday Analysis
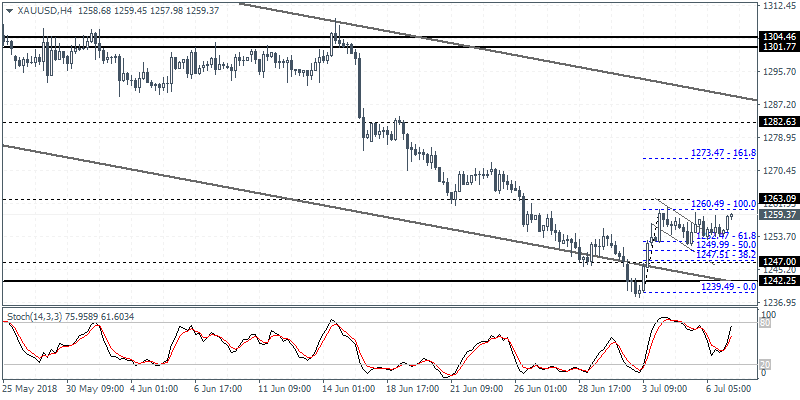
XAUUSD (1254.20): Gold prices continued to trade flat despite the bullish flag pattern, raising concerns on a potential invalidation. The failure to retest the resistance area of 1263 - 1260 is expected to keep prices flat with the possibility of a break down. The lower support is seen at 1247 handle. Gold prices could very well trade sideways within the said levels unless there is a strong catalyst to help the precious metal to breakout from this range.
All nine BoJ regions reported rosy economic assessment
According to BoJ's Regional Economy Report, six regions (Hokuriku, Kanto-Koshinetsu, Tokai, Kinki, Chugoku, and Kyushu-Okinawa) reported that their economy had been expanding or expanding moderately. Three regions (Hokkaido, Tohoku, and Shikoku) noted that the economy had continued to recover moderately. That's unchanged from previous assessment in April 2018.
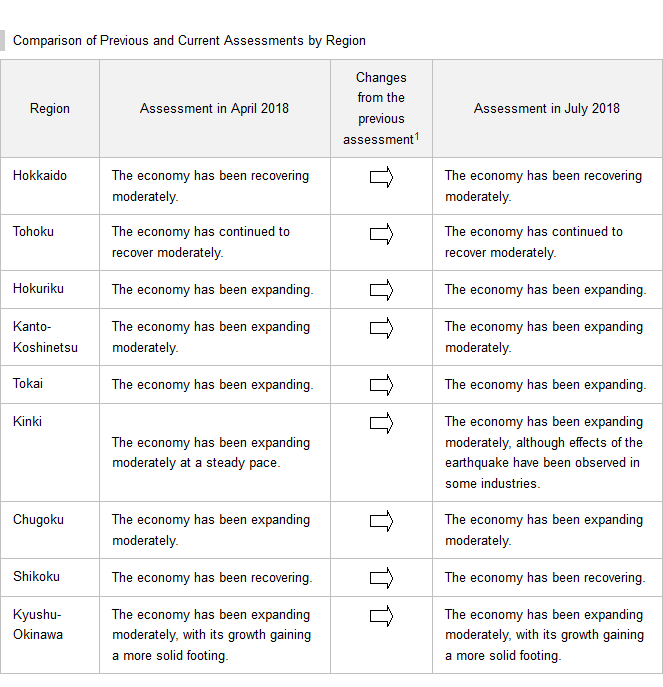
BoJ Governor Haruhiko also said in the meeting of the regional branch manager that "Japan's economy is expected to continue expanding moderately." But ultra-loose monetary policy would be maintained until inflation hits target. Nonetheless, Yasuhiro Yamada, manager of the BOJ's Osaka branch, warned that "Many companies in the region say (protectionism) is the number one risk. They are worried about the huge uncertainty over the trade outlook."
USDJPY Intraday Analysis
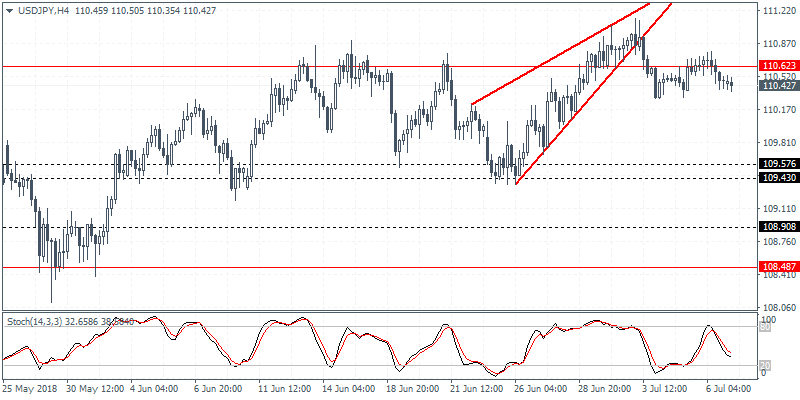
USDJPY (110.42): The USDJPY currency pair was seen attempting to breakout from the resistance level of 110.62 but failed to do so. This is expected to trigger some downside momentum. The support at 109.57 - 109.43 is most likely to be retested in the near term. Alternately, in the event that the USDJPY reverses the losses and breaks out above 110.62, further gains are likely with USDJPY expected to test a major multi-year falling trend line around the 112.00 region.